605 Mount Lancaster Ave NE #634 · St. Petersburg, FL
Flood risk 9/10 · Severe
- FEMA flood zone
- AE
- Chance of flooding over 30 yrs
- 0.99%
- Est. flood insurance / yr
- $1,737 – $8,500
Fire risk 2/10 · Minimal
- Est. fire insurance / yr
- $947 – $1,759
Heat risk 10/10 · Severe
- Hot days now (above 106°F)
- 6 days/yr
- Hot days in 30 yrs
- 21 days/yr
Wind risk 10/10 · Severe
- Chance of severe wind over 30 yrs
- 99.0%
Air-quality risk 3/10 · Minor
- Unhealthy air days now
- 2 days/yr
- Unhealthy air days in 30 yrs
- 3 days/yr
Risk factors via First Street. Map © Google.
Why this score? — see what drove the B+ grade
The composite is a weighted blend of 9 inputs, each scored 0–100. Each bar is that input's sub-score; the figure is the points it added to the 100-point composite (weight × sub-score).
- Cash flow +30.0/30.0
- ARV discount +15.0/15.0
- 1% rule +10.0/10.0
- DSCR +10.0/10.0
- Schools +4.3/10.0
- Livability +2.5/5.0
- Condition / age +2.5/5.0
- Rent growth +1.9/5.0
- Appreciation +0.0/10.0
$75,000
🖨 Deal sheet 📄 Offer letter ✓ Due diligence
Listing remarks
Live the Dream—Florida Style! This incredible 3-bedroom home offers the perfect blend of comfort, value, and resort-style living—all for an unbelievable price of just $109,000! Nestled in a highly desirable community just a short drive from Tampa, St. Pete, Clearwater, Orlando, and some of Florida’s best Gulf Coast beaches. This property provides the Florida dream lifestyle that many can only dream of. Dinners and sunsets overlooking Tampa bay at community restaurant. Access to all the many wonderful amenities offered by this amazing location. Pirate parades, sports event ( Hockey, Baseball, Football) , theatres, restaurans, really "cool" shops and plenty of b
Key facts
- Private ramps
- Resort style pool
- Stunning clubhouse
Tags
Property features AI
Finance
- Other: Buyer approval required; Deed restrictions; Golf carts allowed
- Financial info: Total monthly fees $380; total annual fees $4,560
- HOA & community: Has HOA; monthly fee $380; Association requires approval; Association amenities include pool, clubhouse, fitness center, dog park, park, recreational facilities, private road, maintenance of grounds, management, trash, water, sewer, common area taxes, escrow reserves, community mailboxes, association-owned recreation; Senior community; Pets allowed (cats OK) with limits
Exterior
- Parking: Carport with 1 space
- Security: 24-hour guard (community amenity)
- Utilities: Well water; Public sewer; Broadband/High-speed internet available; Cable available; Electricity available
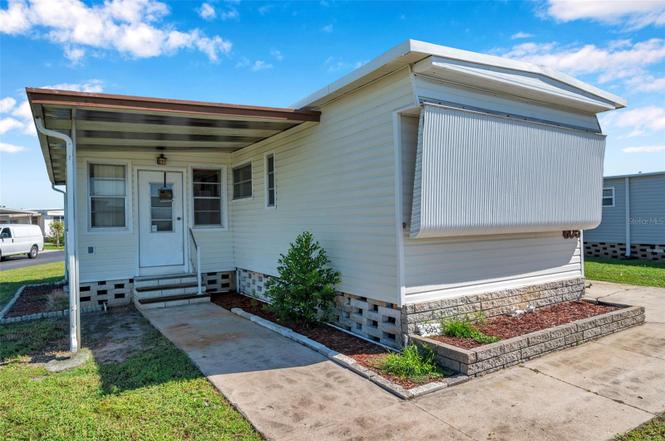
- Home design: Residential mobile home (single wide); One story; Faces southeast
- Construction: Frame construction; Metal roof
- Exterior features: Corner lot; Paved road access; Shed(s)/storage; Spa
Interior
- Kitchen: Microwave; Range; Refrigerator
- Bedrooms: 3 bedrooms
- Flooring: Carpet; Laminate
- Bathrooms: 2 full bathrooms
- Heating & cooling: Central heating; Central air conditioning
- Interior features: Ceiling fans; Enclosed, screened patio/porch; Storage
- Laundry & utility: Laundry: Other
Neighborhood map
What this means for you Summary
Snapshot
- This is a 3-bed/2.0-bath manufactured listed at $75k.
Deal economics
- At list price, monthly cash flow is $53 ($635/yr) — positive.
- The deal already cash-flows at list — no discount required.
- Meets the 1% rule at list price ($2k rent vs $75k).
- Recommended offer: $66k (12.0% below list) — sets the bar for market timing.
- Cap rate 14.0% vs local median 2.6% in St. Petersburg — top-decile yield for the area; either an underpriced asset or a hidden risk that comps aren't pricing in. Stress-test before assuming the spread holds.
Location & tenants
- Location reads: area grade B — affects rentability + tenant quality, not the cash-flow math above.
- Pinellas (suburban): math 51% / reading 51% proficiency, ranked #31 of 73 in FL (top 42%) — acceptable for families but not a draw, mixed tenant base, ~2y average lease.
- Zoned schools: Shore Acres Elementary School (math 61% / reading 52%, grade C+, #816 of 2,144 statewide, top 39%, 709 students, 46% FRL); Northeast High School (math 35% / reading 47%, grade F, #289 of 667 statewide, top 44%, 1,736 students, 50% FRL) — zoned schools at 48% FRL track the district average.
- Market conditions: Rents soft (-2.2%/yr); 383 active listings in the ZIP; 35 comparable units currently listed for rent nearby; rentals at typical pace (median 24d on market — plan ~3-4 weeks tenant-placement turnaround); 2,676 units permitted in Pinellas County in 2024 (1,422 in 5+ unit buildings).
- This rent runs 33% of the median local income ($67k/yr) — at the standard rent-burdened threshold; future hikes will face affordability resistance.
Forward outlook
- Local home prices are declining (-3.0%/yr); year-one equity from $519 of loan paydown is wiped out by about $2k of value loss. Plan a longer hold.
- Pinellas County population projected at +14% by 2050 — modest demand growth; plan on rents tracking national, not racing it.
Negotiation context
- It's been on market 325 days — a 12% lower offer ($66k) is reasonable based on typical stale-listing flexibility.
- 4 sale attempts since 2y ago; this cycle's ask has dropped $44k (37%) from the opening price — seller is motivated, your offer sets the floor, not the list.
- Current owner paid $42k; list at $75k implies a 76% gain — meaningful room to come down on a strong offer.
Risks & watch-outs
- Watch-outs: property tax is 2.7% of price; flood insurance adds $427/mo; HOA is 21% of rent.
- Climate carrying-cost: in FEMA flood zone AE (mandatory federal flood insurance); severe wind risk, 99% chance of damaging wind over 30y; extreme-heat days projected 6→21/yr by 2055 (HVAC capex compounding) — expect insurance premiums to compound above CPI over the hold.
Questions for the listing agent
- It's been on market 325 days. Have you received any prior offers? Is the seller open to a 12% concession, seller financing, or rate buy-down credit?
- Built in 1973 — when were the roof, HVAC, electrical panel, plumbing, and water heater last replaced?
- Property tax is high relative to price — has the assessment been appealed recently, and will the sale trigger a re-assessment?
- What's the actual annual flood-insurance premium (NFIP or private), and is the property in a SFHA with mandatory coverage?
- What does the HOA fee cover, when was the last increase, and are there any pending special assessments or reserve-fund shortfalls?
- Why hasn't it sold? Are there any deal-killer items the seller is aware of (foundation, flood, title, zoning, code violations)?
- Is there a deadline driving the sale (1031 exchange, divorce, estate, relocation)? That informs how much negotiation room exists.
- What's the average days-on-market for RENTAL listings here right now (not sales)? A rising rental-DOM trend means longer vacancies and softer asking-rent achievability than the comps imply.
- What's the recent tenant-quality profile in this submarket — average credit score on applications, eviction rate, late-payment / NSF rate, and stable-employment percentage? A property-management company in the area should have these aggregated.
- How much new for-sale + rental construction is in the pipeline within 1–3 miles? Heavy new supply typically softens prices + rents 12–24 months out; constrained supply supports both.
Investment metrics
- 1% rule
- 2.45% ✓
- Cap rate
- 13.96%
- Cash-on-cash
- 27.40%
- DSCR
- 2.22
- GRM
- 3.4
CMA / ARV
- ARV (on-the-fly)
- $97,500
- Comps found
- 2
Show comp detail 2 sales within ~0.75 mi
| Address | Dist | Beds/Ba | Sqft | Sold | Price | $/sf | Match |
|---|---|---|---|---|---|---|---|
| 6926 Americana Dr NE #134 | 0.37mi | 2/2.0 (-1) | 798 (+2%) | 14mo | $100,000 | $125 | 63 |
| 7028 Mount Jupiter Dr NE #601 | 0.10mi | 2/1.0 (-1) | 672 (-14%) | 6mo | $23,300 | $35 | 59 |
Match score weights: distance 35% · size 25% · config 20% · recency 20%. Top-matched comps best support the ARV.
Projected returns pro-forma
-3.0% appreciation · 0.0% rent growth · sell at horizon
- IRR
- -19.9%
- Equity multiple
- 0.35×
- Total profit
- $-13,599
- Equity at exit
- $11,183
- IRR
- -69.9%
- Equity multiple
- -0.24×
- Total profit
- $-26,008
- Equity at exit
- $6,485
Cash invested: $21,000 (down + closing). Projections, not guarantees.
Landlord ↔ Tenant lean methodology
- Overall (STATE)
- 87 Strongly Landlord-Friendly
- State Florida
- 87 Strongly Landlord-Friendly · R+3
- County
- — inherits STATE
- City
- — inherits STATE
ZIP-level market 33702
- Rents YoY
- -2.2%
- Active inventory
- 383
- Price-to-rent
- 3.4×
Monthly cashflow live
- Estimated rent
- $1,839 high interval (Pro) →
- Mortgage (P&I)
- −$393
- Tax from tax record
- −$168 /mo · $2,020/yr
- Insurance
- −$31
- Flood insurance flood zone
- −$427 /mo · $5,118/yr
- HOA
- −$380
- Vacancy / Maint / Mgmt
- −$386
- Net cashflow
- $53
Break-even live
UW: 25.0% down · 7.5% · 30yr · 1.5% tax · 5.0% vac · 8.0% maint · 8.0% mgmt
Financing live
Cash to close
- Down payment
- $18,750
- Closing costs
- $2,250
- Reserves months
- —
- Total cash needed
- —
Loan-product check · same deal, 3 products live
Conventional
25% down · 7.5% · 30yr
- Down + closing
- —
- Monthly P&I
- —
- Monthly cashflow
- —
- DSCR
- —
- Eligible?
- —
Personal DTI + credit; lowest rate.
DSCR
20% down · 8.5% · 30yr
- Down + closing
- —
- Monthly P&I
- —
- Monthly cashflow
- —
- DSCR
- —
- Eligible?
- —
No personal income docs; deal must DSCR.
Hard money
10% down · 12.0% · 12mo
- Down + closing
- —
- Monthly P&I
- —
- Monthly cashflow
- —
- DSCR
- —
- Eligible?
- —
Short-term bridge; refi at stabilization.
Rent comps 35 comps
| Address | Beds | Baths | Sqft | Rent | $/sqft | DOM | Units | Dist |
|---|---|---|---|---|---|---|---|---|
| 7181 Mount Hawthorne Rd NE #590 St Petersburg, FL | 2.0 | 2.0 | 832 | $1,350 | $1.62 | 22d | 1 | 0.02mi |
| 379 79th Ave NE Unit 334 1 St. Petersburg, FL | 2.0 | 1.0 | 915 | $1,600 | $1.75 | 24d | 1 | 0.43mi |
| 111 73rd Ave N Saint Petersburg, FL | 3.0 | 1.0–1.5 | 695 | $2,225 | $3.20 | 24d | 1 | 0.47mi |
| 200 78th Ave N Saint Petersburg, FL | 1.0–3.0 | 1.0 | 810 | $2,035 | $2.51 | 4d | 1 | 0.51mi |
| 209 NE Lincoln Cir N St Petersburg, FL | 2.0 | 1.5 | 855 | $1,498 | $1.75 | 24d | 2 | 0.61mi |
| 350 79th Ave N St Petersburg, FL | 2.0 | 1.0 | 915 | $1,610 | $1.76 | 7d | 2 | 0.69mi |
| 439 76th Ave N Saint Petersburg, FL | 2.0 | 1.0 | 825 | $1,795 | $2.18 | 17d | 1 | 0.70mi |
| 463 76th Ave N #3 St. Petersburg, FL | 2.0 | 1.0 | 825 | $1,350 | $1.64 | 24d | 1 | 0.72mi |
| 517 Hampton Ave NE St Petersburg, FL | 3.0 | 2.0 | 896 | $2,950 | $3.29 | 24d | 1 | 0.76mi |
| 509 77th Ave N St. Petersburg, FL | 1.0–2.0 | 1.0–2.0 | 850 | $1,678 | $1.97 | 24d | 12 | 0.80mi |
| 600 76th Ave N Saint Petersburg, FL | 1.0–2.0 | 1.0–1.5 | 775 | $1,849 | $2.39 | 4d | 10 | 0.82mi |
| 220 Southeast Blvd N St. Petersburg, FL | 2.0 | 1.0 | 850 | $2,000 | $2.35 | 16d | 1 | 0.91mi |
| 209 NW Jefferson Cir N Unit JEFFERSON209-15 St. Petersburg, FL | 2.0 | 1.0 | 740 | $1,275 | $1.72 | 3d | 1 | 0.93mi |
| 209 NW Jefferson Cir N Unit 15 St. Petersburg, FL | 2.0 | 1.0 | 740 | $1,275 | $1.72 | 24d | 1 | 0.93mi |
| 530 Freeport Ave N Saint Petersburg, FL | 2.0 | 1.0 | 1040 | $2,100 | $2.02 | 4d | 1 | 1.03mi |
| 6910 Dr Martin Luther King Jr St N Saint Petersburg, FL | 2.0 | 1.0 | 780 | $1,850 | $2.37 | 24d | 1 | 1.13mi |
| 375 54th Ter N St. Petersburg, FL | 1.0–2.0 | 1.0–2.0 | 966 | $3,323 | $3.44 | 2d | 13 | 1.21mi |
| 452 89th Ave N Saint Petersburg, FL | 2.0 | 1.0 | 690 | $1,295 | $1.88 | 24d | 1 | 1.24mi |
| 801 83rd Ave N #510 Saint Petersburg, FL | 2.0 | 2.0 | 800 | $1,600 | $2.00 | 4d | 1 | 1.24mi |
| 546 88th Ave N St. Petersburg, FL | 2.0 | 1.0 | 900 | $1,399 | $1.55 | 24d | 2 | 1.26mi |
| 426 Palm Ave N Unit 9 St. Petersburg, FL | 2.0 | 1.0 | 850 | $1,500 | $1.76 | 24d | 1 | 1.26mi |
| 612 88th Ave N St. Petersburg, FL | 2.0 | 1.0 | 900 | $1,499 | $1.67 | 2d | 1 | 1.27mi |
| 500 89th Ave N Unit 520-4 St. Petersburg, FL | 2.0 | 1.0 | 750 | $1,445 | $1.93 | 7d | 1 | 1.28mi |
| 621 88th Ave N Unit 637-4 St. Petersburg, FL | 2.0 | 1.0 | 800 | $1,595 | $1.99 | 7d | 1 | 1.30mi |
| 5519 Commonwealth Ave N Saint Petersburg, FL | 2.0 | 1.0 | 852 | $2,900 | $3.40 | 4d | 1 | 1.32mi |
| 443 90th Ave N Saint Petersburg, FL | 2.0 | 1.0 | 701 | $1,500 | $2.14 | 4d | 1 | 1.32mi |
| 451 90th Ave N Saint Petersburg, FL | 2.0 | 1.0 | 701 | $1,500 | $2.14 | 20d | 1 | 1.33mi |
| 4920 Locust St NE St. Petersburg, FL | 2.0 | 2.0 | 1035 | $1,825 | $1.76 | 24d | 1 | 1.40mi |
| 239 93rd Ave N Saint Petersburg, FL | 4.0 | 2.0 | 1111 | $2,905 | $2.61 | 24d | 1 | 1.40mi |
| 619 90th Ave N Saint Petersburg, FL | 2.0 | 1.0 | 800 | $1,550 | $1.94 | 24d | 1 | 1.41mi |
| 1165 83rd Ave N Unit D Saint Petersburg, FL | 2.0 | 2.0 | 960 | $1,295 | $1.35 | 24d | 1 | 1.43mi |
| 460 93rd Ave N Unit 8 St. Petersburg, FL | 2.0 | 1.0 | 700 | $1,295 | $1.85 | 24d | 1 | 1.44mi |
| 1245 84th Ave N Unit B St. Petersburg, FL | 2.0 | 1.0 | 900 | $1,650 | $1.83 | 24d | 1 | 1.47mi |
| 1125 83rd Ave N Unit A Saint Petersburg, FL | 2.0 | 2.0 | 940 | $1,750 | $1.86 | 4d | 1 | 1.48mi |
| 536 93rd Ave N Saint Petersburg, FL | 2.0 | 1.0 | 905 | $1,850 | $2.04 | 24d | 1 | 1.48mi |
HOA detail
- Monthly dues
- $380 · $4,560/yr
- Likely covers
- water
Listing history 23 events
-
2026-06-18days on market $75,000 Active 325 DOM
-
2026-06-17days on market $75,000 Active 324 DOM
-
2026-06-16days on market $75,000 Active 323 DOM
-
2026-06-15days on market $75,000 Active 322 DOM
-
2026-06-13days on market $75,000 Active 320 DOM
-
2026-06-09days on market $75,000 Active 316 DOM
-
2026-06-08days on market $75,000 Active 315 DOM
-
2026-06-07days on market $75,000 Active 314 DOM
-
2026-06-04days on market $75,000 Active 311 DOM
-
2026-06-03days on market $75,000 Active 310 DOM
-
2026-06-01days on market $75,000 Active 308 DOM
-
2026-05-31pricedays on market $75,000 Active 307 DOM
-
2026-02-26price $100,000
-
2025-09-02price $109,000
-
2025-07-28$119,000 Active
-
2025-07-13historical
-
2025-06-09price $129,000
-
2025-04-08$139,000 Active
-
2025-03-28historical
-
2025-01-16$139,000 Active
-
2024-10-26historical
-
2024-09-23$159,000 Active
-
2003-03-01soldstatus $42,500
ⓘ Source: listings_history table (triggers on properties + properties_extension) + one-shot
backfill from property_details.listing_events for pre-trigger history.
Tax reassessment forecast FL · Resets to sale price
- Current annual tax
- $2,020 · $168/mo
- Projected year-2 tax
- $2,020 · $168/mo
- Expected delta
- $0/yr ($0/mo · 0.0%)
ⓘ Screening estimate from a state-policy table — verify with the county assessor before closing.
Climate risk First Street
- Flood 9/10 Extreme FEMA zone AE · 99% chance over 30 yrs
- Wildfire 2/10 Low
- Heat 10/10 Extreme 6 d/yr ≥106°F today · 21 d/yr by 30 yrs out
- Wind 10/10 Extreme 99% chance of damaging wind over 30 yrs
- Air quality 3/10 Moderate 2 unhealthy d/yr today · 3 by 30 yrs out
Nearby sold comps map
Loading sold comps map…
Walkable amenities ~0.75 mi
Loading nearby amenities…
Taxation est. · year 1
- Rental income
- $22,062
- − Mortgage interest
- −$4,201
- − Property taxes
- −$2,020
- − Insurance
- −$5,494
- − Repairs & maintenance
- −$1,765
- − Management
- −$1,765
- − HOA
- −$4,560
- − Depreciation
- −$2,182
- Taxable income
- $75
- Est. tax owed @ 24.0%
- −$18
- After-tax cash flow
- $617/yr
For passive investors: Depreciation is non-cash, so a rental often shows a tax loss while cash-flowing — sheltering income. Rental losses are passive: they offset passive income freely, and up to $25,000/yr can offset ordinary (W-2) income if you actively participate and your MAGI is under $100k (phasing out to $0 by $150k); unused losses carry forward. On sale, claimed depreciation is recaptured at up to 25%, and gains may owe capital-gains tax (a 1031 exchange can defer both). Figures are a year-1 estimate at your 24.0% rate — not tax advice; consult a CPA.
Schools (NCES district)
- District
- Pinellas
- NCES district ID
- 1201560
- Math proficiency
- 51% ▼ -5.00%
- Reading proficiency
- 51% ▼ -3.00%
- Median HH income
- $46,270
- Composite
- 43.27/100
- National rank
- #3046
- State rank
- #31 of 73 in FL
Livability — St. Petersburg
No livability data for this city. (Only ~50 U.S. cities are tracked.)
Census & demographics
- Census place
- St. Petersburg, FL
- County
- Pinellas County · 939,478 people
- City population
- 249,151
- Metro
- Tampa-St. Petersburg-Clearwater, FL
- Population (ZIP)
- 31,294
- Household income
- $67,463
- Rent vs Own
- Severe rent burden
- 1000.0
Population outlook (Pinellas County) Hauer SSP2
- Today (2025)
- 1,027,532 people
- By 2030
- 1,063,586 · +3.5%
- By 2040
- 1,125,020 · +9.5%
- By 2050
- 1,168,637 · +13.7%
- By 2075
- 1,265,188 · +23.1%
- By 2100
- 1,260,357 · +22.7%
Race, ethnicity, and origin ACS 2023
- Neighborhood character
- Predominantly White (73%)
- Race & ethnicity
- White 73% Hispanic / Latino 12% Two or more races 10% Black 6% Asian 4%
- Hispanic origin (detail)
- Mexican 2% Puerto Rican 3% Cuban 2%
- Common ancestry
- Lithuanian 4% Romanian 3% Slovak 2%
- Foreign-born
- 12% · Canada, Vietnam, Jamaica
- Languages at home
- 83% English-only · Spanish 8% Russian/Polish/Slavic 3% Other Indo-European 1%
Political lean MEDSL · Pinellas
- 2024 margin
- Lean R (+5.2) · D 46.9% · R 52.1%
- 2008→2024 swing
- -13.5pp toward R · 2008: 8.3pp · 2024: -5.2pp
- All cycles
- 2024: R+5.2 2020: D+0.2 2016: R+1.1 2012: D+5.6 2008: D+8.3
Not yet ingested
- Civics
- —
Market trends
- HPI YoY
- ▼ -516.17%
- Current HPI
- 347.1781
- Rent YoY
- ▼ -2.22%
- Metro
- Tampa-St. Petersburg-Clearwater, FL
- State GDP YoY
- ▲ 3.28%
- F500 in state
- 36
Industry mix (Fortune 500 HQ in FL)
| Industry | F500 HQs | Revenue |
|---|---|---|
| Industrial Technology | 2 | $29B |
|
||
| Insurance | 2 | $17B |
|
||
| Retail | 1 | $60B |
|
||
| Technology Distribution | 1 | $58B |
|
||
| Homebuilding | 1 | $35B |
|
||
| Technology Manufacturing | 1 | $35B |
|
||
Price history
+135.3% since first listed11 events — show timeline
- 2026-02-26 Price Changed $100,000 Stellar MLS as Distributed by MLS Grid
- 2025-09-02 Price Changed $109,000 Stellar MLS as Distributed by MLS Grid
- 2025-07-28 Listed $119,000 Stellar MLS as Distributed by MLS Grid
- 2025-07-13 Listing Removed — Stellar MLS as Distributed by MLS Grid
- 2025-06-09 Price Changed $129,000 Stellar MLS as Distributed by MLS Grid
- 2025-04-08 Listed $139,000 Stellar MLS as Distributed by MLS Grid
- 2025-03-28 Listing Removed — Stellar MLS as Distributed by MLS Grid
- 2025-01-16 Listed $139,000 Stellar MLS as Distributed by MLS Grid
- 2024-10-26 Listing Removed — Stellar MLS as Distributed by MLS Grid
- 2024-09-23 Listed $159,000 Stellar MLS as Distributed by MLS Grid
- 2003-03-01 Sold (Public Records) $42,500 Public Records
Property tax history
+8.2%/yrLatest (2025): $2,020 · +3.8% YoY. Source: county tax records.
Cash-flow waterfall
monthlySold comps — $/sqft
last 12 mo · ≤1 miLoading sold comps…