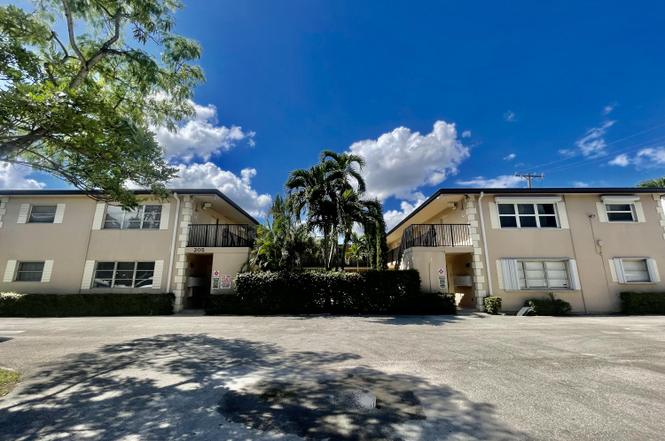
205 NE 3rd St #105 · Boynton Beach, FL
Flood risk 1/10 · Minimal
- FEMA flood zone
- X (unshaded)
- Chance of flooding over 30 yrs
- 0.0%
- Est. flood insurance / yr
- $507 – $1,088
Fire risk 1/10 · Minimal
- Est. fire insurance / yr
- $947 – $1,759
Heat risk 10/10 · Severe
- Hot days now (above 105°F)
- 7 days/yr
- Hot days in 30 yrs
- 27 days/yr
Wind risk 10/10 · Severe
- Chance of severe wind over 30 yrs
- 99.0%
Air-quality risk 2/10 · Minimal
- Unhealthy air days now
- 1 days/yr
- Unhealthy air days in 30 yrs
- 2 days/yr
Risk factors via First Street. Map © Google.
Why this score? — see what drove the C grade
The composite is a weighted blend of 9 inputs, each scored 0–100. Each bar is that input's sub-score; the figure is the points it added to the 100-point composite (weight × sub-score).
- Cash flow +21.9/30.0
- 1% rule +9.6/10.0
- ARV discount +7.5/15.0
- DSCR +7.0/10.0
- Schools +4.3/10.0
- Livability +3.6/5.0
- Rent growth +3.4/5.0
- Condition / age +2.5/5.0
- Appreciation +0.0/10.0
$135,000
🖨 Deal sheet (PDF) 📄 Offer letter ✓ Due diligence
Listing remarks
1/1 FIRST FLOOR UNIT. CONVENIENTLY SITUATED WITHIN WALKING DISTANCE TO BOYNTON BEACH DOWNTOWN AREA. CLOSE TO PUBLIC TRANSPORTATION, RESTAURANTS AND APPROX 1 MILE TO BEACH. GREAT INVESTMENT OPPORTUNITY. UNIT IS TENANT-OCCUPIED.
Key facts
- Close to restaurants
- 1 mile to beach
- First floor unit
Tags
Property features AI
Finance
- Other: Pets not allowed
- Financial info: No multifamily cash flow or income/expense details provided
- HOA & community: Association with monthly fee; Association fee covers water, trash, grounds maintenance, and common areas; Association provides laundry; Monthly HOA fee: $425
Exterior
- Parking: Parking details not provided
- Security: No security features listed
- Utilities: Public water; Public sewer; Three-phase electric; Sewer and water available
- Home design: Condominium; Two-story building; Resale property; Facing east
- Construction: CBS construction
- Exterior features: Not waterfront
Interior
- Kitchen: Electric range; Refrigerator
- Bedrooms: One bedroom on the main level
- Flooring: Ceramic tile
- Bathrooms: One full bathroom
- Heating & cooling: Central heating; Central air conditioning (electric)
- Interior features: No interior features specified
- Laundry & utility: Laundry available through the association
Neighborhood map
What this means for you Summary
Snapshot
- This is a 1-bed/1.0-bath condo listed at $135k.
Deal economics
- At list price, monthly cash flow is $212 ($3k/yr) — positive.
- The deal already cash-flows at list — no discount required.
- Meets the 1% rule at list price ($2k rent vs $135k).
- Recommended offer: $119k (12.0% below list) — sets the bar for market timing.
- Cap rate 8.2% vs local median 4.3% in Boynton Beach — top-decile yield for the area; either an underpriced asset or a hidden risk that comps aren't pricing in. Stress-test before assuming the spread holds.
Location & tenants
- Location reads 72/100 on livability (#351 in FL) — a middle-class / working-renter tenant base. Strengths: housing A+, health & safety B+, cost of living B; Watch: amenities D+, crime D-, commute F.
- Palm Beach (suburban): math 46% / reading 53% proficiency, ranked #34 of 73 in FL (top 47%) — families likely to look elsewhere, expect single-tenant / working-renter base with shorter leases.
- Zoned schools: Forest Park Elementary School (math 42% / reading 38%, grade F, #1,491 of 2,144 statewide, top 70%, 571 students, 81% FRL); Congress Community Middle School (math 21% / reading 28%, grade F, #522 of 571 statewide, top 93%, 988 students, 72% FRL); Boynton Beach Community High (math 13% / reading 25%, grade F, #565 of 667 statewide, top 85%, 1,547 students, 65% FRL) — zoned schools average 73% FRL vs 52% district-wide (21 pts higher); higher-poverty schools than district average — tighter screening recommended.
- Zoned-school proficiency averages 28% at this address vs 50% district-wide (-22 pts) — the specific schools serving this property underperform the Palm Beach average; the district grade overstates school quality for this exact location.
- Market conditions: Rents rising (+3.6%/yr); 539 active listings in the ZIP; 35 comparable units currently listed for rent nearby; rentals at typical pace (median 23d on market — plan ~3-4 weeks tenant-placement turnaround); 3,974 units permitted in Palm Beach County in 2024 (1,012 in 5+ unit buildings).
- This rent runs 35% of the median local income ($68k/yr) — at the standard rent-burdened threshold; future hikes will face affordability resistance.
Forward outlook
- Local home prices are declining (-3.0%/yr); year-one equity from $933 of loan paydown is wiped out by about $4k of value loss. Plan a longer hold.
- Palm Beach County population projected at +30% by 2050 — long-run rental-demand tailwind backs the buy-and-hold thesis.
Negotiation context
- It's been on market 250 days — a 12% lower offer ($119k) is reasonable based on typical stale-listing flexibility.
- Current owner paid $51k; list at $135k implies a 165% gain — meaningful room to come down on a strong offer.
Risks & watch-outs
- Watch-outs: HOA is 22% of rent.
- Climate carrying-cost: severe wind risk, 99% chance of damaging wind over 30y; extreme-heat days projected 7→27/yr by 2055 (HVAC capex compounding) — expect insurance premiums to compound above CPI over the hold.
Questions for the listing agent
- It's been on market 250 days. Have you received any prior offers? Is the seller open to a 12% concession, seller financing, or rate buy-down credit?
- Built in 1972 — when were the roof, HVAC, electrical panel, plumbing, and water heater last replaced?
- What does the HOA fee cover, when was the last increase, and are there any pending special assessments or reserve-fund shortfalls?
- Any open or pending special assessments — roof, HVAC, plumbing, elevator, façade? What's the per-unit balance and payoff schedule, and is the seller paying it off at close or rolling it to the buyer?
- Why hasn't it sold? Are there any deal-killer items the seller is aware of (foundation, flood, title, zoning, code violations)?
- Is there a deadline driving the sale (1031 exchange, divorce, estate, relocation)? That informs how much negotiation room exists.
- Crime grade is D in this area — have there been break-ins, vandalism, or insurance claims at this property in the last 3 years? What carrier currently insures it and at what premium?
- What's the average days-on-market for RENTAL listings here right now (not sales)? A rising rental-DOM trend means longer vacancies and softer asking-rent achievability than the comps imply.
- What's the recent tenant-quality profile in this submarket — average credit score on applications, eviction rate, late-payment / NSF rate, and stable-employment percentage? A property-management company in the area should have these aggregated.
- How much new apartment / multifamily construction is in the pipeline within 1–3 miles? Heavy new supply (>2% of stock underway) typically softens rents 12–24 months out; light construction supports rent growth.
Investment metrics
- 1% rule
- 1.46% ✓
- Cap rate
- 8.18%
- Cash-on-cash
- 6.73%
- DSCR
- 1.30
- GRM
- 5.7
CMA / ARV
No comps found within radius.
Projected returns pro-forma
-3.0% appreciation · 3.64% rent growth · sell at horizon
- IRR
- -4.8%
- Equity multiple
- 0.82×
- Total profit
- $-6,807
- Equity at exit
- $20,129
- IRR
- 6.1%
- Equity multiple
- 1.47×
- Total profit
- $17,940
- Equity at exit
- $11,672
Cash invested: $37,800 (down + closing). Projections, not guarantees.
Landlord ↔ Tenant lean methodology
- Overall (STATE)
- 87 Strongly Landlord-Friendly
- State Florida
- 87 Strongly Landlord-Friendly · R+3
- County
- — inherits STATE
- City
- — inherits STATE
ZIP-level market 33435
- Rents YoY
- 3.6%
- Active inventory
- 539
- Price-to-rent
- 5.7×
Monthly cashflow live
- Estimated rent
- $1,975 high interval (Pro) →
- Mortgage (P&I)
- −$708
- Tax from tax record
- −$159 /mo · $1,909/yr
- Insurance
- −$56
- HOA
- −$425
- Vacancy / Maint / Mgmt
- −$415
- Net cashflow
- $212
Break-even live
Sensitivity live
| Price | -10% $288 | -5% $250 | +0% $212 | +5% $174 | +10% $136 |
|---|---|---|---|---|---|
| Rent | -10% $56 | -5% $134 | +0% $212 | +5% $290 | +10% $368 |
| Rate | -1.0pp $280 | -0.5pp $246 | base $212 | +0.5pp $177 | +1.0pp $141 |
UW: 25.0% down · 7.5% · 30yr · 1.5% tax · 5.0% vac · 8.0% maint · 8.0% mgmt
Financing live
Cash to close
- Down payment
- $33,750
- Closing costs
- $4,050
- Reserves months
- —
- Total cash needed
- —
Loan-product check · same deal, 3 products live
Conventional
25% down · 7.5% · 30yr
- Down + closing
- —
- Monthly P&I
- —
- Monthly cashflow
- —
- DSCR
- —
- Eligible?
- —
Personal DTI + credit; lowest rate.
DSCR
20% down · 8.5% · 30yr
- Down + closing
- —
- Monthly P&I
- —
- Monthly cashflow
- —
- DSCR
- —
- Eligible?
- —
No personal income docs; deal must DSCR.
Hard money
10% down · 12.0% · 12mo
- Down + closing
- —
- Monthly P&I
- —
- Monthly cashflow
- —
- DSCR
- —
- Eligible?
- —
Short-term bridge; refi at stabilization.
Rent comps 35 comps
| Address | Beds | Baths | Sqft | Rent | $/sqft | DOM | Units | Dist |
|---|---|---|---|---|---|---|---|---|
| 101 S Federal Hwy Boynton Beach, FL | 1.0–2.0 | 1.0–2.0 | 906 | $2,012 | $2.22 | 0d | 15 | 0.21mi |
| 400 N Federal Hwy Unit N304 Boynton Beach, FL | 1.0 | 1.0 | 640 | $2,400 | $3.75 | 26d | 1 | 0.25mi |
| 115 SW 1st Ave Boynton Beach, FL | 1.0–2.0 | 1.0–2.0 | 804 | $1,875 | $2.33 | 16d | 2 | 0.25mi |
| 518 NE 4th St Unit A Boynton Beach, FL | 1.0 | 1.0 | 500 | $1,700 | $3.40 | 17d | 1 | 0.27mi |
| 207 SE 4th Ave Boynton Beach, FL | 1.0 | 1.0 | 650 | $1,795 | $2.76 | 3d | 1 | 0.28mi |
| 100 NE 6th St Boynton Beach, FL | 1.0 | 1.0 | 745 | $2,975 | $3.99 | 13d | 3 | 0.31mi |
| 100 NE 6th St Boynton Beach, FL | 1.0 | 1.0 | 745 | $2,975 | $3.99 | 21d | 3 | 0.31mi |
| 640 SE 2nd Ave Unit 111 Boynton Beach, FL | 1.0 | 1.0 | 650 | $1,720 | $2.65 | 4d | 1 | 0.31mi |
| 240 Horizons W #108 Boynton Beach, FL | 1.0 | 1.5 | 646 | $1,600 | $2.48 | 26d | 1 | 0.33mi |
| 620 Horizons W #207 Boynton Beach, FL | 1.0 | 1.0 | 570 | $1,200 | $2.11 | 26d | 1 | 0.44mi |
| 615 NE 7th Ave Boynton Beach, FL | 1.0 | 1.0 | 698 | $1,699 | $2.43 | 19d | 1 | 0.45mi |
| 689 NE 6th Ct #4070 Boynton Beach, FL | 1.0 | 1.0 | 703 | $1,900 | $2.70 | 19d | 1 | 0.52mi |
| 689 NE 6th Ct #404 Boynton Beach, FL | 1.0 | 1.0 | 703 | $2,000 | $2.84 | 26d | 1 | 0.52mi |
| 650 Horizons E #107 Boynton Beach, FL | 1.0 | 1.0 | 570 | $1,600 | $2.81 | 26d | 1 | 0.55mi |
| 800 Horizons W #211 Boynton Beach, FL | 1.0 | 1.0 | 570 | $1,650 | $2.89 | 16d | 1 | 0.55mi |
| 850 Horizons E #309 Boynton Beach, FL | 1.0 | 1.5 | 646 | $1,990 | $3.08 | 22d | 1 | 0.59mi |
| 1001 S Federal Hwy Unit 3 Boynton Beach, FL | 1.0 | 1.0 | 650 | $1,995 | $3.07 | 26d | 1 | 0.62mi |
| 717 NE 10th Ave Unit 6 Boynton Beach, FL | 1.0 | 1.0 | 700 | $1,600 | $2.29 | 9d | 1 | 0.67mi |
| 656 Manor Dr Unit 3 Boynton Beach, FL | — | 1.0 | 650 | $1,600 | $2.46 | 23d | 1 | 0.69mi |
| 6520 N Ocean Blvd Apt 3 Ocean Ridge, FL | 1.0 | 1.0 | 702 | $3,500 | $4.99 | 26d | 1 | 0.81mi |
| 6520 N Ocean Blvd Ocean Ridge, FL | 1.0–2.0 | 1.0 | 776 | $2,400 | $3.09 | 13d | 1 | 0.81mi |
| 430 NW 12th Ave Unit A Boynton Beach, FL | 1.0 | 1.0 | 500 | $2,195 | $4.39 | 26d | 1 | 0.84mi |
| 638 Snug Harbor Dr Boynton Beach, FL | 1.0–2.0 | 1.0–2.0 | 747 | $1,600 | $2.14 | 26d | 2 | 0.84mi |
| 408 NW 13th Ave Unit 2 Boynton Beach, FL | 1.0 | 1.0 | 400 | $1,375 | $3.44 | 26d | 1 | 0.85mi |
| 640 Snug Harbor Dr Unit F3 Boynton Beach, FL | 1.0 | 1.0 | 629 | $2,500 | $3.97 | 12d | 1 | 0.87mi |
| 5505 N Ocean Blvd Ocean Ridge, FL | 1.0–2.0 | 1.0–2.0 | 774 | $1,950 | $2.52 | 12d | 3 | 1.15mi |
| 515 SE 20th Ave Boynton Beach, FL | 2.0 | 1.0 | 787 | $1,719 | $2.18 | 1d | 5 | 1.20mi |
| 405 SE 20th Ave Unit 5F Boynton Beach, FL | — | 1.0 | 600 | $1,489 | $2.48 | 23d | 1 | 1.20mi |
| 2303 S Federal Hwy #19 Boynton Beach, FL | 1.0 | 1.0 | 615 | $1,450 | $2.36 | 7d | 1 | 1.36mi |
| 2301 SE 4th St Unit 15 Boynton Beach, FL | 1.0 | 1.0 | 573 | $1,545 | $2.70 | 26d | 1 | 1.36mi |
| 2301 SE 4th St #11 Boynton Beach, FL | 1.0 | 1.0 | 573 | $1,595 | $2.78 | 26d | 1 | 1.36mi |
| 22 Oceanview Dr Ocean Ridge, FL | 1.0 | 1.0 | 620 | $3,500 | $5.65 | 26d | 1 | 1.37mi |
| 1407 Tuscany Way #1407 Boynton Beach, FL | 1.0 | 1.0 | 721 | $2,100 | $2.91 | 4d | 1 | 1.39mi |
| 2412 Tuscany Way Boynton Beach, FL | 1.0 | 1.0 | 750 | $3,000 | $4.00 | 26d | 1 | 1.41mi |
| 21 Ruthmary Ave Unit G Briny Breezes, FL | 1.0 | 1.0 | 396 | $2,850 | $7.20 | 26d | 1 | 1.49mi |
HOA detail condo
- Monthly dues
- $425 · $5,100/yr
- Assessments
- None detected in remarks — confirm with the listing agent.
Listing history 18 events
-
2026-06-21days on market $135,000 Active 250 DOM
-
2026-06-18days on market $135,000 Active 247 DOM
-
2026-06-17days on market $135,000 Active 246 DOM
-
2026-06-16days on market $135,000 Active 245 DOM
-
2026-06-15days on market $135,000 Active 244 DOM
-
2026-06-13days on market $135,000 Active 242 DOM
-
2026-06-09days on market $135,000 Active 238 DOM
-
2026-06-07days on market $135,000 Active 236 DOM
-
2026-06-04days on market $135,000 Active 233 DOM
-
2026-06-03days on market $135,000 Active 232 DOM
-
2026-06-01days on market $135,000 Active 230 DOM
-
2026-05-31days on market $135,000 Active 229 DOM
-
2026-05-05price $135,000
-
2026-01-05price $148,000
-
2025-11-27price $149,000
-
2025-10-14$162,000 Active
-
2004-06-23soldstatus $51,000
-
1993-12-30soldstatus $22,500
ⓘ Source: listings_history table (triggers on properties + properties_extension) + one-shot
backfill from property_details.listing_events for pre-trigger history.
Tax reassessment forecast FL · Resets to sale price
- Current annual tax
- $1,909 · $159/mo
- Projected year-2 tax
- $1,909 · $159/mo
- Expected delta
- $0/yr ($0/mo · 0.0%)
ⓘ Screening estimate from a state-policy table — verify with the county assessor before closing.
Climate risk First Street
- Flood 1/10 Low FEMA zone X (unshaded) · 0% chance over 30 yrs
- Wildfire 1/10 Low
- Heat 10/10 Extreme 7 d/yr ≥105°F today · 27 d/yr by 30 yrs out
- Wind 10/10 Extreme 99% chance of damaging wind over 30 yrs
- Air quality 2/10 Low 1 unhealthy d/yr today · 2 by 30 yrs out
Nearby sold comps map
Loading sold comps map…
Walkable amenities ~0.75 mi
Loading nearby amenities…
Taxation est. · year 1
- Rental income
- $23,702
- − Mortgage interest
- −$7,562
- − Property taxes
- −$1,909
- − Insurance
- −$675
- − Repairs & maintenance
- −$1,896
- − Management
- −$1,896
- − HOA
- −$5,100
- − Depreciation
- −$3,927
- Taxable income
- $735
- Est. tax owed @ 24.0%
- −$177
- After-tax cash flow
- $2,368/yr
For passive investors: Depreciation is non-cash, so a rental often shows a tax loss while cash-flowing — sheltering income. Rental losses are passive: they offset passive income freely, and up to $25,000/yr can offset ordinary (W-2) income if you actively participate and your MAGI is under $100k (phasing out to $0 by $150k); unused losses carry forward. On sale, claimed depreciation is recaptured at up to 25%, and gains may owe capital-gains tax (a 1031 exchange can defer both). Figures are a year-1 estimate at your 24.0% rate — not tax advice; consult a CPA.
Schools (NCES district)
- District
- Palm Beach
- NCES district ID
- 1201500
- Math proficiency
- 46% ▼ -16.00%
- Reading proficiency
- 53% ▼ -4.00%
- Median HH income
- $53,943
- Composite
- 42.72/100
- National rank
- #3160
- State rank
- #34 of 73 in FL
Livability — Boynton Beach
- Score
- 72/100
- State rank
- #351
- US rank
- #6098
Category grades
Schools grade is shown separately in the Schools card above.
Census & demographics
- Census place
- Boynton Beach, FL
- County
- Palm Beach County · 1,438,312 people
- City population
- 148,060
- Metro
- Miami-Fort Lauderdale-Pompano Beach, FL
- Population (ZIP)
- 37,833
- Household income
- $67,979
- Rent vs Own
- Severe rent burden
- 1623.0
Population outlook (Palm Beach County) Hauer SSP2
- Today (2025)
- 1,637,487 people
- By 2030
- 1,743,255 · +6.5%
- By 2040
- 1,948,712 · +19.0%
- By 2050
- 2,132,979 · +30.3%
- By 2075
- 2,530,027 · +54.5%
- By 2100
- 2,706,979 · +65.3%
Race, ethnicity, and origin ACS 2023
- Neighborhood character
- Diverse neighborhood (Simpson 0.65)
- Race & ethnicity
- White 41% Black 40% Hispanic / Latino 15% Two or more races 10%
- Hispanic origin (detail)
- Mexican 3% Puerto Rican 3% Cuban 2% Dominican 1%
- Common ancestry
- Hispanic 23% Romanian 2% Lithuanian 2%
- Foreign-born
- 30% · Canada, Jamaica
- Languages at home
- 61% English-only · French/Haitian/Cajun 24% Spanish 11% Other Indo-European 2%
Political lean MEDSL · Palm Beach
- 2024 margin
- Toss-up / Even · D 50.0% · R 49.2%
- 2008→2024 swing
- -22.1pp toward R · 2008: 22.9pp · 2024: 0.8pp
- All cycles
- 2024: D+0.8 2020: D+12.8 2016: D+15.3 2012: D+17.0 2008: D+22.9
Not yet ingested
- Civics
- —
Market trends
- HPI YoY
- ▼ -345.86%
- Current HPI
- 371.0527
- Rent YoY
- ▲ 3.64%
- Metro
- Miami-Fort Lauderdale-Pompano Beach, FL
- State GDP YoY
- ▲ 3.28%
- F500 in state
- 36
Industry mix (Fortune 500 HQ in FL)
| Industry | F500 HQs | Revenue |
|---|---|---|
| Industrial Technology | 2 | $29B |
|
||
| Insurance | 2 | $17B |
|
||
| Retail | 1 | $60B |
|
||
| Technology Distribution | 1 | $58B |
|
||
| Homebuilding | 1 | $35B |
|
||
| Technology Manufacturing | 1 | $35B |
|
||
Price history
+500.0% since first listed6 events — show timeline
- 2026-05-05 Price Changed $135,000 Beaches MLS
- 2026-01-05 Price Changed $148,000 Beaches MLS
- 2025-11-27 Price Changed $149,000 Beaches MLS
- 2025-10-14 Listed $162,000 Beaches MLS
- 2004-06-23 Sold (Public Records) $51,000 Public Records
- 1993-12-30 Sold (Public Records) $22,500 Public Records
Property tax history
+7.3%/yrLatest (2025): $1,909 · -4.6% YoY. Source: county tax records.
Cash-flow waterfall
monthlySold comps — $/sqft
last 12 mo · ≤1 miLoading sold comps…