None · Mundelein, IL
Flood risk No data
- FEMA flood zone
- —
- Chance of flooding over 30 yrs
- —
- Est. flood insurance / yr
- —
Fire risk No data
- Est. fire insurance / yr
- —
Heat risk No data
- Hot days now (above threshold)
- —
- Hot days in 30 yrs
- —
Wind risk No data
- Chance of severe wind over 30 yrs
- —
Air-quality risk No data
- Unhealthy air days now
- —
- Unhealthy air days in 30 yrs
- —
Risk factors via First Street. Map © Google.
Why this score? — see what drove the D grade
The composite is a weighted blend of 9 inputs, each scored 0–100. Each bar is that input's sub-score; the figure is the points it added to the 100-point composite (weight × sub-score).
- Cash flow +9.7/30.0
- ARV discount +9.6/15.0
- Schools +7.1/10.0
- Livability +4.4/5.0
- Rent growth +3.2/5.0
- 1% rule +2.9/10.0
- DSCR +2.7/10.0
- Condition / age +2.5/5.0
- Appreciation +0.0/10.0
$425,000
🖨 Deal sheet 📄 Offer letter ✓ Due diligence
Key facts
- Garage
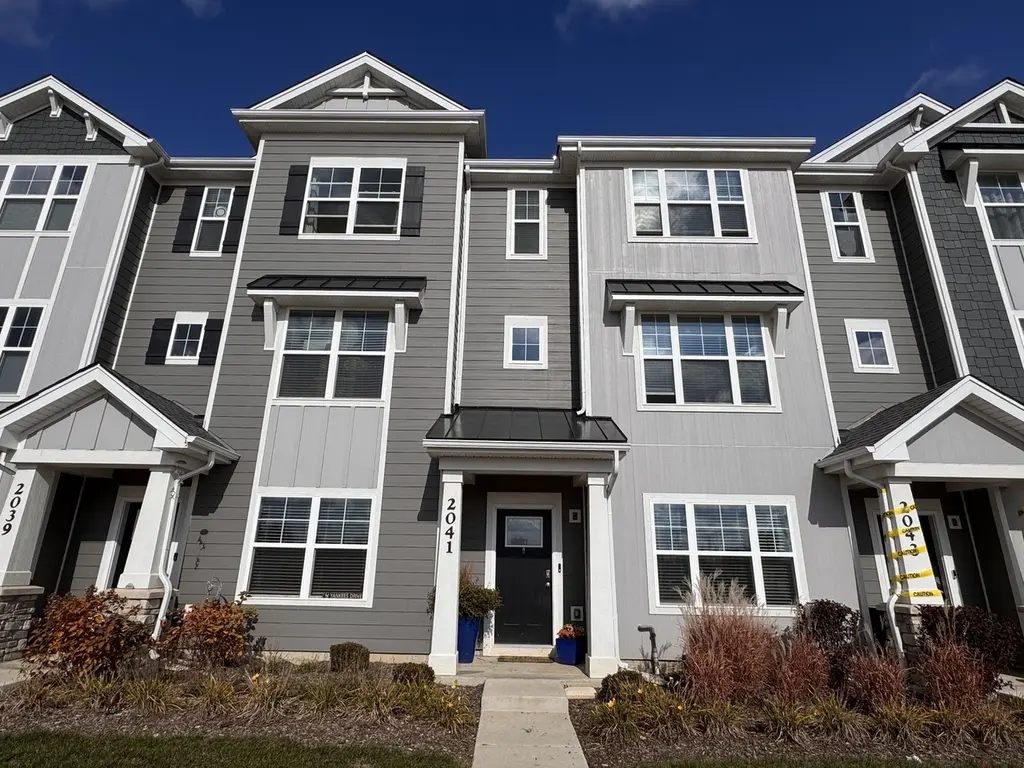
- Built 2023
Property features AI
Exterior
- Parking: Garage
- Home design: Townhouse; 3 floors in building
Interior
- Kitchen: Microwave; Dishwasher
- Bedrooms: 3 bedrooms
- Bathrooms: 2.5 bathrooms
- Heating & cooling: Air conditioning
- Interior features: 7 total rooms
- Laundry & utility: Washer; Dryer
Neighborhood map
What this means for you Summary
Snapshot
- This is a 3-bed/2.5-bath townhouse listed at $425k.
Deal economics
- At list price, monthly cash flow is $-279 ($-3k/yr) — negative.
- To cash-flow at today's rent, offer at most $385k (9.5% below list).
- To meet the 1% rule (rent ≥ 1% of price), the offer needs to be $336k (20.8% below list).
- Recommended offer: $336k (20.8% below list) — sets the bar for 1% rule.
- Cap rate 5.5% vs local median 3.1% in Mundelein — top-decile yield for the area; either an underpriced asset or a hidden risk that comps aren't pricing in. Stress-test before assuming the spread holds.
Location & tenants
- Location reads 87/100 on livability (#12 in IL, #274 nationally) — a professional / high-income tenant draw. Strengths: crime A+, commute A+, employment A+; Watch: amenities F.
- Adlai E Stevenson Hsd 125 (suburban): math 72% / reading 73% proficiency, ranked #3 of 620 in IL (top 0%) — strong family-tenant draw, lease renewals of 3-5y typical.
- Market conditions: Rents rising (+2.7%/yr); 32 active listings in the ZIP; 12 comparable units currently listed for rent nearby; rentals at typical pace (median 25d on market — plan ~3-4 weeks tenant-placement turnaround); high-income renter base; 948 units permitted in Lake County in 2024 (424 in 5+ unit buildings).
- This rent runs 37% of the median local income ($110k/yr) — at the standard rent-burdened threshold; future hikes will face affordability resistance.
Forward outlook
- Local home prices are declining (-3.0%/yr); year-one equity from $3k of loan paydown is wiped out by about $13k of value loss. Plan a longer hold.
- Lake County population projected to shrink 8% by 2050 — rents likely to lag national; underwrite the cash flow, not the appreciation.
Negotiation context
- Only 9 days on market — expect competitive offers; lowballing is unlikely to land.
Questions for the listing agent
- What do current leases actually rent for vs. the listed asking? Can we see a recent rent roll and the last 12 months of T-12 income?
- Is there a deadline driving the sale (1031 exchange, divorce, estate, relocation)? That informs how much negotiation room exists.
- The area grade is low — what's the realistic commute time and amenity access for the typical tenant pool here? Any planned neighborhood developments (good or bad) we should know about?
- What's the average days-on-market for RENTAL listings here right now (not sales)? A rising rental-DOM trend means longer vacancies and softer asking-rent achievability than the comps imply.
- What's the recent tenant-quality profile in this submarket — average credit score on applications, eviction rate, late-payment / NSF rate, and stable-employment percentage? A property-management company in the area should have these aggregated.
- How much new for-sale + rental construction is in the pipeline within 1–3 miles? Heavy new supply typically softens prices + rents 12–24 months out; constrained supply supports both.
Investment metrics
- 1% rule
- 0.79% ✗
- Cap rate
- 5.50%
- Cash-on-cash
- -2.82%
- DSCR
- 0.87
- GRM
- 10.5
CMA / ARV
- ARV (on-the-fly)
- $445,904
- Comps found
- 12
Show comp detail 12 sales within ~0.75 mi
| Address | Dist | Beds/Ba | Sqft | Sold | Price | $/sf | Match |
|---|---|---|---|---|---|---|---|
| 549 Yosemite Way | 0.07mi | 3/2.5 | 1,798 (0%) | 1mo | $448,990 | $250 | 96 |
| 551 Yosemite Way | 0.09mi | 3/2.5 | 1,798 (0%) | 2mo | $459,990 | $256 | 94 |
| 559 Yosemite Way | 0.10mi | 3/2.5 | 1,798 (0%) | 2mo | $450,990 | $251 | 94 |
| 569 Yosemite Way | 0.11mi | 3/2.5 | 1,798 (0%) | 3mo | $450,990 | $251 | 92 |
| 2170 Glacier St | 0.10mi | 3/2.5 | 1,752 (-3%) | 2mo | $438,990 | $251 | 90 |
| 545 Yosemite Way | 0.09mi | 2/2.5 (-1) | 1,630 (-9%) | 0mo | $404,990 | $248 | 75 |
| 555 Yosemite Way | 0.10mi | 2/2.5 (-1) | 1,630 (-9%) | 1mo | $398,490 | $244 | 74 |
| 565 Yosemite Way | 0.11mi | 2/2.5 (-1) | 1,630 (-9%) | 2mo | $398,990 | $245 | 72 |
| 1452 Lakeridge Ct | 0.49mi | 3/2.5 | 1,756 (-2%) | 1mo | $355,000 | $202 | 72 |
| 567 Yosemite Way | 0.11mi | 2/2.5 (-1) | 1,630 (-9%) | 3mo | $398,990 | $245 | 72 |
| 575 Yosemite Way | 0.12mi | 2/2.5 (-1) | 1,630 (-9%) | 3mo | $398,990 | $245 | 72 |
| 1367 Orleans Dr | 0.66mi | 3/2.5 | 1,640 (-9%) | 1mo | $355,000 | $216 | 54 |
Match score weights: distance 35% · size 25% · config 20% · recency 20%. Top-matched comps best support the ARV.
Projected returns pro-forma
-3.0% appreciation · 2.67% rent growth · sell at horizon
- IRR
- -21.3%
- Equity multiple
- 0.26×
- Total profit
- $-87,716
- Equity at exit
- $63,369
- IRR
- -15.7%
- Equity multiple
- 0.13×
- Total profit
- $-103,614
- Equity at exit
- $36,746
Cash invested: $119,000 (down + closing). Projections, not guarantees.
Landlord ↔ Tenant lean methodology
- Overall (STATE)
- 43 Moderately Tenant-Leaning
- State Illinois
- 43 Moderately Tenant-Leaning · D+7
- County
- — inherits STATE
- City
- — inherits STATE
ZIP-level market 60060
- Rents YoY
- 2.7%
- Active inventory
- 32
- Price-to-rent
- 10.5×
Monthly cashflow live
- Estimated rent
- $3,364 high interval (Pro) →
- Mortgage (P&I)
- −$2,229
- Tax est. 1.5%
- −$531 /mo · $6,375/yr
- Insurance
- −$177
- HOA
- −$0
- Vacancy / Maint / Mgmt
- −$707
- Net cashflow
- $-279
Break-even live
UW: 25.0% down · 7.5% · 30yr · 1.5% tax · 5.0% vac · 8.0% maint · 8.0% mgmt
Financing live
Cash to close
- Down payment
- $106,250
- Closing costs
- $12,750
- Reserves months
- —
- Total cash needed
- —
Loan-product check · same deal, 3 products live
Conventional
25% down · 7.5% · 30yr
- Down + closing
- —
- Monthly P&I
- —
- Monthly cashflow
- —
- DSCR
- —
- Eligible?
- —
Personal DTI + credit; lowest rate.
DSCR
20% down · 8.5% · 30yr
- Down + closing
- —
- Monthly P&I
- —
- Monthly cashflow
- —
- DSCR
- —
- Eligible?
- —
No personal income docs; deal must DSCR.
Hard money
10% down · 12.0% · 12mo
- Down + closing
- —
- Monthly P&I
- —
- Monthly cashflow
- —
- DSCR
- —
- Eligible?
- —
Short-term bridge; refi at stabilization.
Rent comps 12 comps
| Address | Beds | Baths | Sqft | Rent | $/sqft | DOM | Units | Dist |
|---|---|---|---|---|---|---|---|---|
| 2141 Yellowstone Blvd Mundelein, IL | 3.0 | 2.5 | 1798 | $3,500 | $1.95 | 24d | 1 | 0.10mi |
| 2227 Glacier St Mundelein, IL | 3.0 | 2.5 | 1800 | $3,500 | $1.94 | 24d | 1 | 0.12mi |
| 545 Yosemite Way Mundelein, IL | 2.0 | 2.5 | 1630 | $3,150 | $1.93 | 6d | 1 | 0.13mi |
| 2267 Glacier St Mundelein, IL | 3.0 | 2.5 | 1752 | $3,800 | $2.17 | 1d | 1 | 0.15mi |
| 409 Alpine Springs Dr Vernon Hills, IL | 3.0 | 2.5 | 2352 | $3,600 | $1.53 | 12d | 1 | 0.86mi |
| 717 Keystone Ln Vernon Hills, IL | 3.0 | 2.5 | 2352 | $3,399 | $1.45 | 24d | 1 | 0.94mi |
| 263 Aspen Pointe Rd Vernon Hills, IL | 3.0 | 2.5 | 2087 | $3,300 | $1.58 | 24d | 1 | 0.99mi |
| 136 Brookwood Ct Vernon Hills, IL | 2.0 | 1.5 | 1248 | $2,400 | $1.92 | 2d | 1 | 1.04mi |
| 410 Ashwood Ct Unit 410 Vernon Hills, IL | 2.0 | 1.5 | 1248 | $2,300 | $1.84 | 22d | 1 | 1.20mi |
| 36 Constitution Ct Vernon Hills, IL | 3.0 | 2.5 | 1525 | $3,000 | $1.97 | 24d | 1 | 1.34mi |
| 26821 N Oakdale Ln Mundelein, IL | 3.0 | 2.0 | 1710 | $3,800 | $2.22 | 24d | 1 | 1.43mi |
| 10 Mayflower Rd Vernon Hills, IL | 3.0 | 2.5 | 2000 | $4,000 | $2.00 | 1d | 1 | 1.48mi |
Listing history 7 events
-
2026-06-18days on market $425,000 Coming Soon 9 DOM
-
2026-06-17days on market $425,000 Coming Soon 8 DOM
-
2026-06-16days on market $425,000 Coming Soon 7 DOM
-
2026-06-15days on market $425,000 Coming Soon 6 DOM
-
2026-06-13days on market $425,000 Coming Soon 4 DOM
-
2026-06-13days on market $425,000 Coming Soon 3 DOM
-
2026-06-10$425,000 Coming Soon 1 DOM
ⓘ Source: listings_history table (triggers on properties + properties_extension) + one-shot
backfill from property_details.listing_events for pre-trigger history.
Nearby sold comps map
Loading sold comps map…
Walkable amenities ~0.75 mi
Loading nearby amenities…
Taxation est. · year 1
- Rental income
- $40,372
- − Mortgage interest
- −$23,807
- − Property taxes
- −$6,375
- − Insurance
- −$2,125
- − Repairs & maintenance
- −$3,230
- − Management
- −$3,230
- − Depreciation
- −$12,364
- Taxable loss
- −$10,757
- Est. tax savings @ 24.0%
- +$2,582
- After-tax cash flow
- $-769/yr
For passive investors: Depreciation is non-cash, so a rental often shows a tax loss while cash-flowing — sheltering income. Rental losses are passive: they offset passive income freely, and up to $25,000/yr can offset ordinary (W-2) income if you actively participate and your MAGI is under $100k (phasing out to $0 by $150k); unused losses carry forward. On sale, claimed depreciation is recaptured at up to 25%, and gains may owe capital-gains tax (a 1031 exchange can defer both). Figures are a year-1 estimate at your 24.0% rate — not tax advice; consult a CPA.
Schools (NCES district)
- District
- Adlai E Stevenson Hsd 125
- NCES district ID
- 1732580
- Math proficiency
- 72% ▼ -4.00%
- Reading proficiency
- 73% ▼ -2.00%
- Median HH income
- $146,434
- Composite
- 70.66/100
- National rank
- #253
- State rank
- #3 of 620 in IL
Livability — Mundelein
- Score
- 87/100
- State rank
- #12
- US rank
- #274
Category grades
Schools grade is shown separately in the Schools card above.
Census & demographics
- Census place
- Mundelein, IL
- County
- Lake County · 591,991 people
- City population
- 37,344
- Metro
- Chicago-Naperville-Elgin, IL-IN-WI
- Population (ZIP)
- 37,344
- Household income
- $110,335
- Rent vs Own
- Severe rent burden
- 750.0
Population outlook (Lake County) Hauer SSP2
- Today (2025)
- 700,217 people
- By 2030
- 693,290 · -1.0%
- By 2040
- 673,588 · -3.8%
- By 2050
- 643,556 · -8.1%
- By 2075
- 562,792 · -19.6%
- By 2100
- 457,715 · -34.6%
Race, ethnicity, and origin ACS 2023
- Neighborhood character
- Diverse neighborhood (Simpson 0.61)
- Race & ethnicity
- White 50% Hispanic / Latino 35% Two or more races 14% Asian 10% Native American 2% Black 2%
- Hispanic origin (detail)
- Mexican 32%
- Common ancestry
- Romanian 6% Scotch-Irish 1% Subsaharan African 1%
- Foreign-born
- 28% · Canada, China, South Korea
- Languages at home
- 55% English-only · Spanish 29% Russian/Polish/Slavic 5% Other Indo-European 4%
Political lean MEDSL · Lake
- 2024 margin
- Strong D (+20.8) · D 59.7% · R 38.9% · Other 1.4%
- 2008→2024 swing
- +1.1pp toward D · 2008: 19.6pp · 2024: 20.8pp
- All cycles
- 2024: D+20.8 2020: D+24.1 2016: D+20.3 2012: D+8.1 2008: D+19.6
Not yet ingested
- Civics
- —
Market trends
- HPI YoY
- ▼ -173.41%
- Current HPI
- 201.0795
- Rent YoY
- ▲ 2.67%
- Metro
- Chicago-Naperville-Elgin, IL-IN-WI
- State GDP YoY
- ▲ 1.59%
- F500 in state
- 60
Industry mix (Fortune 500 HQ in IL)
| Industry | F500 HQs | Revenue |
|---|---|---|
| Insurance | 4 | $201B |
|
||
| Consumer Goods | 4 | $87B |
|
||
| Industrial Machinery | 3 | $64B |
|
||
| Healthcare | 2 | $55B |
|
||
| Retail / Pharmacy | 1 | $148B |
|
||
| Agriculture / Food | 1 | $86B |
|
||
Cash-flow waterfall
monthlySold comps — $/sqft
last 12 mo · ≤1 miLoading sold comps…