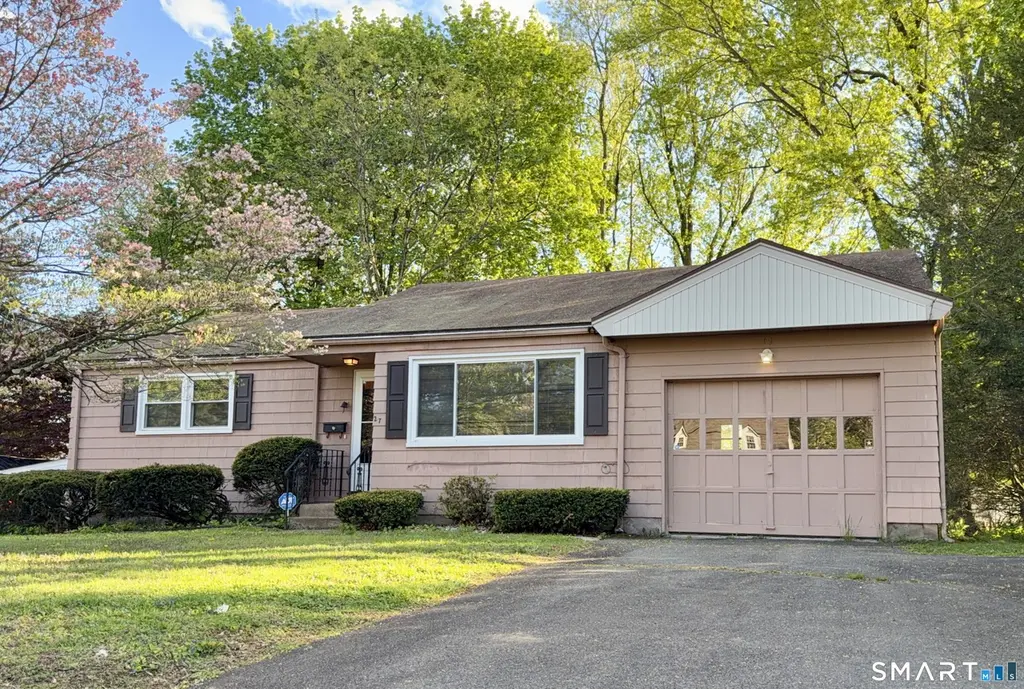
27 West St · Portland, CT
Flood risk 1/10 · Minimal
- FEMA flood zone
- X (unshaded)
- Chance of flooding over 30 yrs
- 0.0%
- Est. flood insurance / yr
- $473 – $860
Fire risk 1/10 · Minimal
- Est. fire insurance / yr
- $829 – $1,539
Heat risk 5/10 · Moderate
- Hot days now (above 99°F)
- 7 days/yr
- Hot days in 30 yrs
- 16 days/yr
Wind risk 6/10 · Moderate
- Chance of severe wind over 30 yrs
- 27.0%
Air-quality risk 3/10 · Minor
- Unhealthy air days now
- 3 days/yr
- Unhealthy air days in 30 yrs
- 4 days/yr
Risk factors via First Street. Map © Google.
Why this score? — see what drove the D+ grade
The composite is a weighted blend of 9 inputs, each scored 0–100. Each bar is that input's sub-score; the figure is the points it added to the 100-point composite (weight × sub-score).
- Cash flow +16.3/30.0
- ARV discount +10.8/15.0
- DSCR +5.1/10.0
- Schools +4.9/10.0
- 1% rule +4.1/10.0
- Livability +3.8/5.0
- Rent growth +2.5/5.0
- Condition / age +2.5/5.0
- Appreciation +0.0/10.0
$299,900
🖨 Deal sheet 📄 Offer letter ✓ Due diligence
Listing remarks
* Multiple offers - Highest & best deadline Tuesday, May 12, by noon please * Discover the quiet charm of this lovingly crafted home nestled on a manageable quarter-acre lot near the heart of historic Cromwell. Offered for the first time by its original owner, this well-cared-for home reflects pride of ownership, ready for updates to realize it's full potential. Step inside to hardwood floors spanning a generously sized living room that flows into a light-filled kitchen overlooking the lovely, level backyard. A delightful three-season porch extends the living space - perfect for morning coffee, quiet evenings listening to nature, or entertaining guests after a shared meal. The spacio
Key facts
- 0.23 acre lot
- Garage
- Built 1965
Property features AI
Exterior
- Parking: Attached garage (1-car)
- Utilities: Public water connected; Public sewer connected; Oil hot water and domestic hot water; Fuel tank located in basement
- Home design: Single-family home; Tan exterior
- Construction: Frame with concrete construction elements; Concrete foundation; Asphalt shingle roof; Clapboard siding
- Exterior features: Sidewalk; Gutters; Lightly wooded, level yard; Walkable to water
Interior
- Kitchen: Oven/Range; Refrigerator
- Bedrooms: 2 bedrooms
- Bathrooms: 1 full bathroom
- Heating & cooling: Hot water heating (oil-fired); Oil hot water boiler; Thermopane windows
- Interior features: Auto garage door opener; Bath grab bars
- Laundry & utility: Washer (located in 2nd bedroom closet); Laundry on main level
Neighborhood map
What this means for you Summary
Snapshot
- This is a 2-bed/1.0-bath single-family listed at $300k.
Deal economics
- At list price, monthly cash flow is $167 ($2k/yr) — positive.
- The deal already cash-flows at list — no discount required.
- To meet the 1% rule (rent ≥ 1% of price), the offer needs to be $272k (9.1% below list).
- Recommended offer: $272k (9.1% below list) — sets the bar for 1% rule.
- Cap rate 7.0% vs local median 2.7% in Portland — top-decile yield for the area; either an underpriced asset or a hidden risk that comps aren't pricing in. Stress-test before assuming the spread holds.
Location & tenants
- Location reads 76/100 on livability (#57 in CT, #3,527 nationally) — a middle-class / working-renter tenant base. Strengths: crime A+, housing A+, health & safety A+; Watch: amenities F, commute F.
- Cromwell School District (suburban): math 51% / reading 58% proficiency, ranked #63 of 153 in CT (top 41%) — acceptable for families but not a draw, mixed tenant base, ~2y average lease; only 14% free/reduced lunch — higher-income household profile.
- Zoned schools: Edna C. Stevens School (473 students, 27% FRL); Cromwell High School (math 52% / reading 67%, grade C+, #45 of 194 statewide, top 25%, 536 students, 25% FRL).
- Market conditions: 58 active listings in the ZIP; 3 comparable units currently listed for rent nearby; rentals at typical pace (median 24d on market — plan ~3-4 weeks tenant-placement turnaround); high-income renter base; 278 units permitted in Lower Connecticut River Valley Planning Region in 2024 (89 in 5+ unit buildings).
Forward outlook
- Local home prices are declining (-3.0%/yr); year-one equity from $2k of loan paydown is wiped out by about $9k of value loss. Plan a longer hold.
Negotiation context
- Only 7 days on market — expect competitive offers; lowballing is unlikely to land.
Risks & watch-outs
- Climate carrying-cost: major wind risk, 27% chance of damaging wind over 30y; extreme-heat days projected 7→16/yr by 2055 (HVAC capex compounding) — expect insurance premiums to compound above CPI over the hold.
Questions for the listing agent
- Built in 1965 — when were the roof, HVAC, electrical panel, plumbing, and water heater last replaced?
- Is there a deadline driving the sale (1031 exchange, divorce, estate, relocation)? That informs how much negotiation room exists.
- Schools are B-rated — typically a magnet for longer-tenancy family renters. What's the average tenant stay here, and is there a school-zone premium baked into asking?
- The area grade is low — what's the realistic commute time and amenity access for the typical tenant pool here? Any planned neighborhood developments (good or bad) we should know about?
- What's the average days-on-market for RENTAL listings here right now (not sales)? A rising rental-DOM trend means longer vacancies and softer asking-rent achievability than the comps imply.
- What's the recent tenant-quality profile in this submarket — average credit score on applications, eviction rate, late-payment / NSF rate, and stable-employment percentage? A property-management company in the area should have these aggregated.
- How much new for-sale + rental construction is in the pipeline within 1–3 miles? Heavy new supply typically softens prices + rents 12–24 months out; constrained supply supports both.
Investment metrics
- 1% rule
- 0.91% ✗
- Cap rate
- 6.96%
- Cash-on-cash
- 2.38%
- DSCR
- 1.11
- GRM
- 9.2
CMA / ARV
- ARV (median comp)
- $323,466
- List price
- $299,900
- Delta
- -7.29%
- Verdict
- FAIR
- Comps
- 20 within 1.0 mi
Show comp detail 5 sales within ~0.75 mi
| Address | Dist | Beds/Ba | Sqft | Sold | Price | $/sf | Match |
|---|---|---|---|---|---|---|---|
| 27 West St | 0.00mi | 2/1.0 | 1,032 (0%) | 0mo | $317,500 | $308 | 100 |
| 281 Main St | 0.38mi | 2/2.0 | 1,022 (-1%) | 22mo | $269,900 | $264 | 58 |
| 59 River Rd | 0.51mi | 2/1.0 | 1,040 (+1%) | 24mo | $300,000 | $288 | 55 |
| 13 Catherine St | 0.44mi | 3/2.0 (+1) | 1,074 (+4%) | 11mo | $367,000 | $342 | 54 |
| 4 Wightman Pl | 0.39mi | 2/1.0 | 912 (-12%) | 23mo | $261,000 | $286 | 43 |
Match score weights: distance 35% · size 25% · config 20% · recency 20%. Top-matched comps best support the ARV.
Projected returns pro-forma
-3.0% appreciation · 3.0% rent growth · sell at horizon
- IRR
- -12.5%
- Equity multiple
- 0.55×
- Total profit
- $-38,002
- Equity at exit
- $44,716
- IRR
- -3.5%
- Equity multiple
- 0.77×
- Total profit
- $-19,483
- Equity at exit
- $25,930
Cash invested: $83,972 (down + closing). Projections, not guarantees.
Landlord ↔ Tenant lean methodology
- Overall (STATE)
- 27 Tenant-Leaning
- State Connecticut
- 27 Tenant-Leaning · D+7
- County
- — inherits STATE
- City
- — inherits STATE
ZIP-level market 06416
- Home prices YoY
- -16.0%
- Active inventory
- 58
- Price-to-rent
- 9.2×
Monthly cashflow live
- Estimated rent
- $2,725 medium interval (Pro) →
- Mortgage (P&I)
- −$1,573
- Tax from tax record
- −$288 /mo · $3,462/yr
- Insurance
- −$125
- HOA
- −$0
- Vacancy / Maint / Mgmt
- −$572
- Net cashflow
- $167
Break-even live
UW: 25.0% down · 7.5% · 30yr · 1.5% tax · 5.0% vac · 8.0% maint · 8.0% mgmt
Financing live
Cash to close
- Down payment
- $74,975
- Closing costs
- $8,997
- Reserves months
- —
- Total cash needed
- —
Loan-product check · same deal, 3 products live
Conventional
25% down · 7.5% · 30yr
- Down + closing
- —
- Monthly P&I
- —
- Monthly cashflow
- —
- DSCR
- —
- Eligible?
- —
Personal DTI + credit; lowest rate.
DSCR
20% down · 8.5% · 30yr
- Down + closing
- —
- Monthly P&I
- —
- Monthly cashflow
- —
- DSCR
- —
- Eligible?
- —
No personal income docs; deal must DSCR.
Hard money
10% down · 12.0% · 12mo
- Down + closing
- —
- Monthly P&I
- —
- Monthly cashflow
- —
- DSCR
- —
- Eligible?
- —
Short-term bridge; refi at stabilization.
Rent comps 3 comps
| Address | Beds | Baths | Sqft | Rent | $/sqft | DOM | Units | Dist |
|---|---|---|---|---|---|---|---|---|
| 35 West St Cromwell, CT | 3.0 | 1.5 | 1392 | $3,000 | $2.16 | 23d | 1 | 0.06mi |
| 548 Main St Unit 2 Portland, CT | 3.0 | 1.0 | 1005 | $1,752 | $1.74 | 23d | 1 | 1.37mi |
| 548 Main St Unit 2 Portland, CT | 3.0 | 1.0 | 1005 | $1,752 | $1.74 | 1d | 1 | 1.37mi |
Listing history 2 events
-
2026-05-14status Under Contract 1497-char remark
-
2026-05-06$299,900 Active 1497-char remark
ⓘ Source: listings_history table (triggers on properties + properties_extension) + one-shot
backfill from property_details.listing_events for pre-trigger history.
Tax reassessment forecast CT · Partial reset (capped growth)
- Current annual tax
- $3,462 · $288/mo
- Projected year-2 tax
- $4,940 · $412/mo
- Expected delta
- +$1,478/yr (+$123/mo · 42.7%)
ⓘ Screening estimate from a state-policy table — verify with the county assessor before closing.
Climate risk First Street
- Flood 1/10 Low FEMA zone X (unshaded) · 0% chance over 30 yrs
- Wildfire 1/10 Low
- Heat 5/10 Major 7 d/yr ≥99°F today · 16 d/yr by 30 yrs out
- Wind 6/10 Major 27% chance of damaging wind over 30 yrs
- Air quality 3/10 Moderate 3 unhealthy d/yr today · 4 by 30 yrs out
Nearby sold comps map
Loading sold comps map…
Walkable amenities ~0.75 mi
Loading nearby amenities…
Taxation est. · year 1
- Rental income
- $32,699
- − Mortgage interest
- −$16,799
- − Property taxes
- −$3,462
- − Insurance
- −$1,500
- − Repairs & maintenance
- −$2,616
- − Management
- −$2,616
- − Depreciation
- −$8,724
- Taxable loss
- −$3,018
- Est. tax savings @ 24.0%
- +$724
- After-tax cash flow
- $2,723/yr
For passive investors: Depreciation is non-cash, so a rental often shows a tax loss while cash-flowing — sheltering income. Rental losses are passive: they offset passive income freely, and up to $25,000/yr can offset ordinary (W-2) income if you actively participate and your MAGI is under $100k (phasing out to $0 by $150k); unused losses carry forward. On sale, claimed depreciation is recaptured at up to 25%, and gains may owe capital-gains tax (a 1031 exchange can defer both). Figures are a year-1 estimate at your 24.0% rate — not tax advice; consult a CPA.
Schools (NCES district)
- District
- Cromwell School District
- NCES district ID
- 0900990
- Math proficiency
- 51% ▼ -7.00%
- Reading proficiency
- 58% ▼ -9.00%
- Median HH income
- $80,252
- Composite
- 49.39/100
- National rank
- #2013
- State rank
- #63 of 153 in CT
Livability — Portland
- Score
- 76/100
- State rank
- #57
- US rank
- #3527
Category grades
Schools grade is shown separately in the Schools card above.
Census & demographics
- County
- Middlesex County · 63,941 people
- Metro
- Hartford-East Hartford-Middletown, CT
- Population (ZIP)
- 14,334
- Household income
- $110,596
- Rent vs Own
- Severe rent burden
- 188.0
Population outlook (Lower Connecticut River Valley County) Hauer SSP2
- By 2040
- 188,651
Race, ethnicity, and origin ACS 2023
- Neighborhood character
- Predominantly White (74%)
- Race & ethnicity
- White 74% Two or more races 12% Hispanic / Latino 9% Asian 6% Black 6%
- Hispanic origin (detail)
- Puerto Rican 5%
- Common ancestry
- Romanian 11% Lithuanian 5% Italian 1%
- Foreign-born
- 10% · Canada, China, South Korea
- Languages at home
- 87% English-only · Spanish 4% Other Indo-European 2% Russian/Polish/Slavic 2%
Political lean MEDSL · Lower Connecticut River Valley
- 2024 margin
- D (+13.4) · D 55.9% · R 42.4% · Other 1.7%
- All cycles
- 2024: D+13.4
Not yet ingested
- Civics
- —
Market trends
- HPI YoY
- ▼ -49.38%
- Current HPI
- 259.9702
- Rent YoY
- —
- Metro
- Hartford-East Hartford-Middletown, CT
- State GDP YoY
- ▲ 1.06%
- F500 in state
- 38
Industry mix (Fortune 500 HQ in CT)
| Industry | F500 HQs | Revenue |
|---|---|---|
| Industrial Machinery | 4 | $38B |
|
||
| Insurance | 3 | $71B |
|
||
| Financial Services | 2 | $25B |
|
||
| Transportation / Logistics | 2 | $18B |
|
||
| Healthcare | 1 | $247B |
|
||
| Telecommunications | 1 | $55B |
|
||
Price history
+5.9% since first listed3 events — show timeline
- 2026-06-09 Sold (MLS) $317,500 Smart MLS
- 2026-05-14 Pending — Smart MLS
- 2026-05-06 Listed $299,900 Smart MLS
Property tax history
+1.3%/yrLatest (2022): $3,462 · +0.0% YoY. Source: county tax records.
Cash-flow waterfall
monthlySold comps — $/sqft
last 12 mo · ≤1 miLoading sold comps…