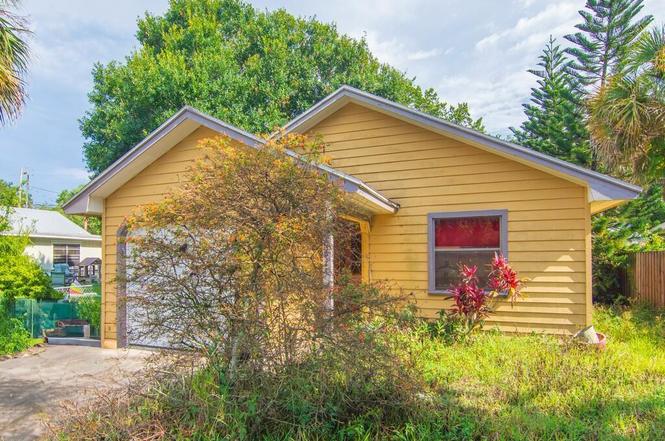
3625 2nd Ln · Vero Beach South, FL
Flood risk 1/10 · Minimal
- FEMA flood zone
- X (unshaded)
- Chance of flooding over 30 yrs
- 0.0%
- Est. flood insurance / yr
- $507 – $1,088
Fire risk 2/10 · Minimal
- Est. fire insurance / yr
- $947 – $1,759
Heat risk 10/10 · Severe
- Hot days now (above 106°F)
- 7 days/yr
- Hot days in 30 yrs
- 24 days/yr
Wind risk 10/10 · Severe
- Chance of severe wind over 30 yrs
- 99.0%
Air-quality risk 1/10 · Minimal
- Unhealthy air days now
- 0 days/yr
- Unhealthy air days in 30 yrs
- 0 days/yr
Risk factors via First Street. Map © Google.
Why this score? — see what drove the B+ grade
The composite is a weighted blend of 9 inputs, each scored 0–100. Each bar is that input's sub-score; the figure is the points it added to the 100-point composite (weight × sub-score).
- Cash flow +30.0/30.0
- ARV discount +15.0/15.0
- 1% rule +10.0/10.0
- DSCR +10.0/10.0
- Schools +4.2/10.0
- Livability +3.9/5.0
- Rent growth +2.5/5.0
- Condition / age +2.5/5.0
- Appreciation +0.0/10.0
$195,000
🖨 Deal sheet 📄 Offer letter ✓ Due diligence
Listing remarks MLS
Cash-only 2 bed, 2 bath home in Vero Beach with strong potential for renovation or investment. Built in 1990, this property is located in a quiet neighborhood and features a solid layout ready for transformation. The roof and AC are of unknown age and condition, and the home is being sold as-is. Ideal for investors or buyers seeking a fixer-upper in a desirable area close to beaches, schools, and local amenities.
Key facts
- Solid layout
- Local amenities
- Quiet neighborhood
Tags
Neighborhood map
What this means for you Summary
Snapshot
- This is a 2-bed/2.0-bath single-family listed at $195k.
Deal economics
- At list price, monthly cash flow is $974 ($12k/yr) — positive.
- The deal already cash-flows at list — no discount required.
- Meets the 1% rule at list price ($3k rent vs $195k).
- Cap rate 12.3% vs local median 4.3% in Vero Beach South — top-decile yield for the area; either an underpriced asset or a hidden risk that comps aren't pricing in. Stress-test before assuming the spread holds.
Location & tenants
- Location reads 78/100 on livability (#163 in FL, #2,445 nationally) — a middle-class / working-renter tenant base. Strengths: commute A+, housing A+, health & safety A; Watch: amenities F.
- Indian River (other): math 48% / reading 52% proficiency, ranked #35 of 73 in FL (top 48%) — acceptable for families but not a draw, mixed tenant base, ~2y average lease.
- Market conditions: 184 active listings in the ZIP; 15 comparable units currently listed for rent nearby; rentals leasing fast (median 14d on market — plan ~1-2 weeks tenant-placement turnaround); 564 units permitted in Indian River County in 2024 (281 in 5+ unit buildings).
Forward outlook
- Local home prices are declining (-3.0%/yr); year-one equity from $1k of loan paydown is wiped out by about $6k of value loss. Plan a longer hold.
- Indian River County population projected at +18% by 2050 — long-run rental-demand tailwind backs the buy-and-hold thesis.
- At projected returns (-3.0% appreciation + 3.0% rent growth), your $55k cash investment doubles in ~6 years — after that, you're playing with house money.
Negotiation context
- Only 8 days on market — expect competitive offers; lowballing is unlikely to land.
- 2 sale attempts with the ask held roughly flat each time — persistent listings suggest the price (not the market) is what's stuck; bring a comps-based counter.
Risks & watch-outs
- Climate carrying-cost: severe wind risk, 99% chance of damaging wind over 30y; extreme-heat days projected 7→24/yr by 2055 (HVAC capex compounding) — expect insurance premiums to compound above CPI over the hold.
Questions for the listing agent
- Is there a deadline driving the sale (1031 exchange, divorce, estate, relocation)? That informs how much negotiation room exists.
- What's the average days-on-market for RENTAL listings here right now (not sales)? A rising rental-DOM trend means longer vacancies and softer asking-rent achievability than the comps imply.
- What's the recent tenant-quality profile in this submarket — average credit score on applications, eviction rate, late-payment / NSF rate, and stable-employment percentage? A property-management company in the area should have these aggregated.
- How much new for-sale + rental construction is in the pipeline within 1–3 miles? Heavy new supply typically softens prices + rents 12–24 months out; constrained supply supports both.
Investment metrics
- 1% rule
- 1.52% ✓
- Cap rate
- 12.29%
- Cash-on-cash
- 21.41%
- DSCR
- 1.95
- GRM
- 5.5
CMA / ARV
- ARV (on-the-fly)
- $254,840
- Comps found
- 12
Show comp detail 12 sales within ~0.75 mi
| Address | Dist | Beds/Ba | Sqft | Sold | Price | $/sf | Match |
|---|---|---|---|---|---|---|---|
| 3246 1st St | 0.31mi | 2/2.0 | 1,117 (+1%) | 6mo | $225,900 | $202 | 79 |
| 306 35th Ave | 0.14mi | 3/2.0 (+1) | 1,186 (+7%) | 3mo | $240,000 | $202 | 74 |
| 3496 1st St SW | 0.34mi | 2/2.0 | 1,023 (-8%) | 1mo | $270,000 | $264 | 71 |
| 19 43rd Ct | 0.56mi | 3/2.0 (+1) | 1,132 (+2%) | 2mo | $260,000 | $230 | 64 |
| 306 30th Ave | 0.40mi | 2/2.0 | 1,000 (-10%) | 7mo | $275,000 | $275 | 59 |
| 3236 1st Rd | 0.36mi | 3/2.0 (+1) | 1,200 (+8%) | 6mo | $265,000 | $221 | 59 |
| 805 36th Ave | 0.69mi | 3/2.0 (+1) | 1,107 (-0%) | 5mo | $285,000 | $257 | 58 |
| 3256 1st St SW | 0.39mi | 2/2.0 | 976 (-12%) | 8mo | $277,500 | $284 | 55 |
| 3196 1st Ln | 0.32mi | 3/2.0 (+1) | 1,274 (+15%) | 2mo | $232,000 | $182 | 54 |
| 16 44th Ave | 0.57mi | 3/2.0 (+1) | 1,181 (+7%) | 8mo | $262,000 | $222 | 51 |
| 660 42nd Ct | 0.62mi | 3/2.0 (+1) | 1,004 (-9%) | 6mo | $199,900 | $199 | 46 |
| 2545 1st Pl N | 0.68mi | 3/2.0 (+1) | 1,232 (+11%) | 4mo | $305,500 | $248 | 42 |
Match score weights: distance 35% · size 25% · config 20% · recency 20%. Top-matched comps best support the ARV.
Projected returns pro-forma
-3.0% appreciation · 3.0% rent growth · sell at horizon
- IRR
- 14.0%
- Equity multiple
- 1.56×
- Total profit
- $30,515
- Equity at exit
- $29,075
- IRR
- 22.8%
- Equity multiple
- 2.95×
- Total profit
- $106,712
- Equity at exit
- $16,860
Cash invested: $54,600 (down + closing). Projections, not guarantees.
Landlord ↔ Tenant lean methodology
- Overall (STATE)
- 87 Strongly Landlord-Friendly
- State Florida
- 87 Strongly Landlord-Friendly · R+3
- County
- — inherits STATE
- City
- — inherits STATE
ZIP-level market 32968
- Home prices YoY
- -27.5%
- Active inventory
- 184
- Price-to-rent
- 5.5×
Monthly cashflow live
- Estimated rent
- $2,966 high interval (Pro) →
- Mortgage (P&I)
- −$1,023
- Tax from tax record
- −$265 /mo · $3,178/yr
- Insurance
- −$81
- HOA
- −$0
- Vacancy / Maint / Mgmt
- −$623
- Net cashflow
- $974
Break-even live
UW: 25.0% down · 7.5% · 30yr · 1.5% tax · 5.0% vac · 8.0% maint · 8.0% mgmt
Financing live
Cash to close
- Down payment
- $48,750
- Closing costs
- $5,850
- Reserves months
- —
- Total cash needed
- —
Loan-product check · same deal, 3 products live
Conventional
25% down · 7.5% · 30yr
- Down + closing
- —
- Monthly P&I
- —
- Monthly cashflow
- —
- DSCR
- —
- Eligible?
- —
Personal DTI + credit; lowest rate.
DSCR
20% down · 8.5% · 30yr
- Down + closing
- —
- Monthly P&I
- —
- Monthly cashflow
- —
- DSCR
- —
- Eligible?
- —
No personal income docs; deal must DSCR.
Hard money
10% down · 12.0% · 12mo
- Down + closing
- —
- Monthly P&I
- —
- Monthly cashflow
- —
- DSCR
- —
- Eligible?
- —
Short-term bridge; refi at stabilization.
Rent comps 15 comps
| Address | Beds | Baths | Sqft | Rent | $/sqft | DOM | Units | Dist |
|---|---|---|---|---|---|---|---|---|
| 3285 3rd Pl Unit 1018166P Vero Beach, FL | 3.0 | 2.0 | 1420 | $3,708 | $2.61 | 13d | 1 | 0.25mi |
| 3673 2nd Pl SW Vero Beach, FL | 3.0 | 2.0 | 1410 | $4,800 | $3.40 | 13d | 1 | 0.58mi |
| 3673 2nd Pl SW Vero Beach, FL | 3.0 | 2.0 | 1410 | $4,800 | $3.40 | 21d | 1 | 0.58mi |
| 405 27th Ct Vero Beach, FL | 3.0 | 2.0 | 1100 | $1,850 | $1.68 | 13d | 1 | 0.59mi |
| 2624 2nd St SW Vero Beach, FL | 2.0 | 1.0 | 748 | $1,750 | $2.34 | 13d | 1 | 0.77mi |
| 248 27th Ave SW Vero Beach, FL | 3.0 | 2.0 | 836 | $1,700 | $2.03 | 21d | 1 | 0.82mi |
| 1816 5th Pl Unit 1018162P Vero Beach, FL | 2.0 | 2.0 | 1323 | $3,841 | $2.90 | 21d | 1 | 1.25mi |
| 275 16th Ave Vero Beach, FL | 2.0 | 2.0 | 1144 | $1,600 | $1.40 | 13d | 1 | 1.35mi |
| 2543 Stockbridge Sq SW Vero Beach, FL | 3.0 | 2.0 | 1464 | $2,200 | $1.50 | 13d | 1 | 1.37mi |
| 1702 7th St Vero Beach, FL | 3.0 | 2.0 | 1230 | $2,100 | $1.71 | 13d | 1 | 1.40mi |
| 1406 36th Ave Vero Beach, FL | 2.0 | 2.5 | 1284 | $2,000 | $1.56 | 13d | 1 | 1.42mi |
| 1406 36th Ave Vero Beach, FL | 2.0 | 2.5 | 1284 | $2,150 | $1.67 | 21d | 1 | 1.42mi |
| 1408 36th Ave Unit 1408 Vero Beach, FL | 2.0 | 2.5 | 1284 | $2,150 | $1.67 | 21d | 1 | 1.43mi |
| 1330 28th Ave Vero Beach, FL | 3.0 | 2.0 | 1488 | $3,200 | $2.15 | 21d | 1 | 1.44mi |
| 2619 Langrove Ln SW Unit 2619 Vero Beach, FL | 3.0 | 2.0 | 1464 | $2,450 | $1.67 | 21d | 1 | 1.47mi |
Listing history 8 events
-
2026-05-11soldstatus $200,000
-
2026-03-11status Pending
-
2025-07-16soldstatus $180,000
-
2025-06-05status Pending 416-char remark
Show marketing remark (416 chars)
Cash-only 2 bed, 2 bath home in Vero Beach with strong potential for renovation or investment. Built in 1990, this property is located in a quiet neighborhood and features a solid layout ready for transformation. The roof and AC are of unknown age and condition, and the home is being sold as-is. Ideal for investors or buyers seeking a fixer-upper in a desirable area close to beaches, schools, and local amenities.
-
2025-06-05status Pending
Show marketing remark (416 chars)
Cash-only 2 bed, 2 bath home in Vero Beach with strong potential for renovation or investment. Built in 1990, this property is located in a quiet neighborhood and features a solid layout ready for transformation. The roof and AC are of unknown age and condition, and the home is being sold as-is. Ideal for investors or buyers seeking a fixer-upper in a desirable area close to beaches, schools, and local amenities.
-
2025-05-27$195,000 Active
Show marketing remark (416 chars)
Cash-only 2 bed, 2 bath home in Vero Beach with strong potential for renovation or investment. Built in 1990, this property is located in a quiet neighborhood and features a solid layout ready for transformation. The roof and AC are of unknown age and condition, and the home is being sold as-is. Ideal for investors or buyers seeking a fixer-upper in a desirable area close to beaches, schools, and local amenities.
-
2025-05-27$195,000 Active 416-char remark
Show marketing remark (416 chars)
Cash-only 2 bed, 2 bath home in Vero Beach with strong potential for renovation or investment. Built in 1990, this property is located in a quiet neighborhood and features a solid layout ready for transformation. The roof and AC are of unknown age and condition, and the home is being sold as-is. Ideal for investors or buyers seeking a fixer-upper in a desirable area close to beaches, schools, and local amenities.
-
2008-09-17soldstatus $101,000
ⓘ Source: listings_history table (triggers on properties + properties_extension) + one-shot
backfill from property_details.listing_events for pre-trigger history.
Tax reassessment forecast FL · Resets to sale price
- Current annual tax
- $3,178 · $265/mo
- Projected year-2 tax
- $3,178 · $265/mo
- Expected delta
- $0/yr ($0/mo · 0.0%)
ⓘ Screening estimate from a state-policy table — verify with the county assessor before closing.
Climate risk First Street
- Flood 1/10 Low FEMA zone X (unshaded) · 0% chance over 30 yrs
- Wildfire 2/10 Low
- Heat 10/10 Extreme 7 d/yr ≥106°F today · 24 d/yr by 30 yrs out
- Wind 10/10 Extreme 99% chance of damaging wind over 30 yrs
- Air quality 1/10 Low 0 unhealthy d/yr today · 0 by 30 yrs out
Nearby sold comps map
Loading sold comps map…
Walkable amenities ~0.75 mi
Loading nearby amenities…
Taxation est. · year 1
- Rental income
- $35,590
- − Mortgage interest
- −$10,923
- − Property taxes
- −$3,178
- − Insurance
- −$975
- − Repairs & maintenance
- −$2,847
- − Management
- −$2,847
- − Depreciation
- −$5,673
- Taxable income
- $9,147
- Est. tax owed @ 24.0%
- −$2,195
- After-tax cash flow
- $9,497/yr
For passive investors: Depreciation is non-cash, so a rental often shows a tax loss while cash-flowing — sheltering income. Rental losses are passive: they offset passive income freely, and up to $25,000/yr can offset ordinary (W-2) income if you actively participate and your MAGI is under $100k (phasing out to $0 by $150k); unused losses carry forward. On sale, claimed depreciation is recaptured at up to 25%, and gains may owe capital-gains tax (a 1031 exchange can defer both). Figures are a year-1 estimate at your 24.0% rate — not tax advice; consult a CPA.
Schools (NCES district)
- District
- Indian River
- NCES district ID
- 1200930
- Math proficiency
- 48% ▼ -9.00%
- Reading proficiency
- 52% ▼ -3.00%
- Median HH income
- $46,597
- Composite
- 42.45/100
- National rank
- #3218
- State rank
- #35 of 73 in FL
Livability — Vero Beach South
- Score
- 78/100
- State rank
- #163
- US rank
- #2445
Category grades
Schools grade is shown separately in the Schools card above.
Census & demographics
- Census place
- Vero Beach South, FL
- Population (ZIP)
- 15,576
Population outlook (Indian River County) Hauer SSP2
- Today (2025)
- 165,104 people
- By 2030
- 172,869 · +4.7%
- By 2040
- 185,640 · +12.4%
- By 2050
- 194,465 · +17.8%
- By 2075
- 211,115 · +27.9%
- By 2100
- 211,781 · +28.3%
Race, ethnicity, and origin ACS 2023
- Neighborhood character
- Predominantly White (80%)
- Race & ethnicity
- White 80% Hispanic / Latino 12% Two or more races 11% Black 4%
- Hispanic origin (detail)
- Mexican 4% Puerto Rican 3% Cuban 2%
- Common ancestry
- Romanian 4% Slovak 3% Lithuanian 3%
- Foreign-born
- 5% · Canada, China
- Languages at home
- 90% English-only · Spanish 7% Other Indo-European 1% Chinese 1%
Political lean MEDSL · Indian River
- 2024 margin
- Strong R (+27.4) · D 36.0% · R 63.4%
- 2008→2024 swing
- -12.5pp toward R · 2008: -14.8pp · 2024: -27.4pp
- All cycles
- 2024: R+27.4 2020: R+21.6 2016: R+24.5 2012: R+22.3 2008: R+14.8
Not yet ingested
- Civics
- —
Market trends
- HPI YoY
- ▼ -118.63%
- Current HPI
- 312.136
- Rent YoY
- —
- Metro
- —
- State GDP YoY
- ▲ 3.28%
- F500 in state
- 36
Industry mix (Fortune 500 HQ in FL)
| Industry | F500 HQs | Revenue |
|---|---|---|
| Industrial Technology | 2 | $29B |
|
||
| Insurance | 2 | $17B |
|
||
| Retail | 1 | $60B |
|
||
| Technology Distribution | 1 | $58B |
|
||
| Homebuilding | 1 | $35B |
|
||
| Technology Manufacturing | 1 | $35B |
|
||
Price history
+98.0% since first listed8 events — show timeline
- 2026-05-11 Sold (Public Records) $200,000 Public Records
- 2026-03-11 Pending — Beaches MLS
- 2025-07-16 Sold (Public Records) $180,000 Public Records
- 2025-06-05 Pending — SCMLS
- 2025-06-05 Pending — Beaches MLS
- 2025-05-27 Listed $195,000 SCMLS
- 2025-05-27 Listed $195,000 Beaches MLS
- 2008-09-17 Sold (Public Records) $101,000 Public Records
Property tax history
+17.6%/yrLatest (2025): $3,178 · +407.7% YoY. Source: county tax records.
Cash-flow waterfall
monthlySold comps — $/sqft
last 12 mo · ≤1 miLoading sold comps…