4367 Maple Dr · Slidell, LA
Flood risk 9/10 · Severe
- FEMA flood zone
- AE
- Chance of flooding over 30 yrs
- 0.99%
- Est. flood insurance / yr
- $1,737 – $8,500
Fire risk 3/10 · Minor
- Est. fire insurance / yr
- $1,269 – $2,357
Heat risk 9/10 · Severe
- Hot days now (above 107°F)
- 7 days/yr
- Hot days in 30 yrs
- 21 days/yr
Wind risk 9/10 · Severe
- Chance of severe wind over 30 yrs
- 99.0%
Air-quality risk 2/10 · Minimal
- Unhealthy air days now
- 1 days/yr
- Unhealthy air days in 30 yrs
- 2 days/yr
Risk factors via First Street. Map © Google.
Why this score? — see what drove the D+ grade
The composite is a weighted blend of 9 inputs, each scored 0–100. Each bar is that input's sub-score; the figure is the points it added to the 100-point composite (weight × sub-score).
- Cash flow +15.0/30.0
- ARV discount +7.5/15.0
- 1% rule +5.0/10.0
- DSCR +5.0/10.0
- Schools +4.3/10.0
- Livability +3.5/5.0
- Rent growth +2.9/5.0
- Condition / age +2.5/5.0
- Appreciation +0.0/10.0
$36,800
🖨 Deal sheet 📄 Offer letter ✓ Due diligence
Listing remarks MLS
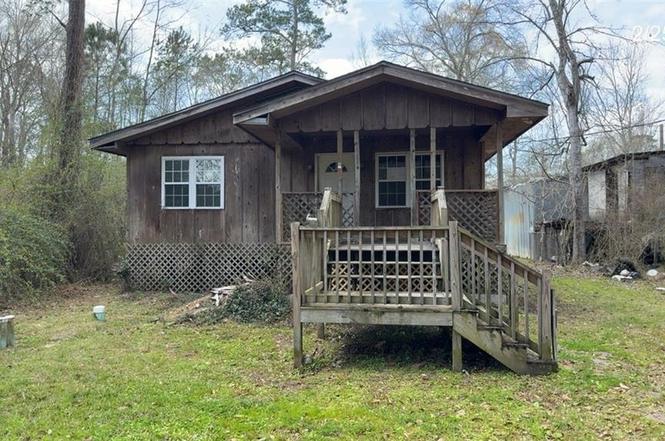
BRING THIS HOME BACK TO LIFE*3 BEDROOM 2 BATH HOME*DEAD END STREET*NICE FRONT PORCH AND LARGE REAR YARD*
Key facts
- Front porch
- Large rear yard
- 7,697 sq ft lot
Tags
Neighborhood map
What this means for you Summary
Snapshot
- This is a 3-bed/2.0-bath single-family listed at $37k.
Deal economics
- At list price, monthly cash flow is $922 ($11k/yr) — positive.
- The deal already cash-flows at list — no discount required.
- Meets the 1% rule at list price ($2k rent vs $37k).
- Recommended offer: $36k (3.0% below list) — sets the bar for market timing.
- Cap rate 50.3% vs local median 5.9% in Slidell — top-decile yield for the area; either an underpriced asset or a hidden risk that comps aren't pricing in. Stress-test before assuming the spread holds.
Location & tenants
- Location reads 70/100 on livability (#57 in LA) — a middle-class / working-renter tenant base. Strengths: cost of living A+, housing A+, health & safety A+; Watch: amenities F, commute F.
- St. Tammany Parish (suburban): math 43% / reading 55% proficiency, ranked #11 of 98 in LA (top 11%) — families likely to look elsewhere, expect single-tenant / working-renter base with shorter leases.
- Market conditions: Rents rising (+1.7%/yr); 589 active listings in the ZIP; 5 comparable units currently listed for rent nearby; rentals at typical pace (median 21d on market — plan ~3-4 weeks tenant-placement turnaround); solid renter incomes; 1,064 units permitted in St. Tammany Parish in 2024 (0 in 5+ unit buildings).
Forward outlook
- Local home prices are declining (-3.0%/yr); year-one equity from $254 of loan paydown is wiped out by about $1k of value loss. Plan a longer hold.
- St. Tammany County population projected at +27% by 2050 — long-run rental-demand tailwind backs the buy-and-hold thesis.
- At projected returns (-3.0% appreciation + 1.7% rent growth), your $10k cash investment doubles in ~2 years — after that, you're playing with house money.
Negotiation context
- It's been on market 53 days — a 3% lower offer ($36k) is reasonable based on typical stale-listing flexibility.
- 4 sale attempts since 20y ago; this cycle's ask has dropped $3k (8%) from the opening price — seller is motivated, your offer sets the floor, not the list.
Risks & watch-outs
- Watch-outs: property tax is 4.2% of price; flood insurance adds $427/mo.
- Climate carrying-cost: in FEMA flood zone AE (mandatory federal flood insurance); severe wind risk, 99% chance of damaging wind over 30y; extreme-heat days projected 7→21/yr by 2055 (HVAC capex compounding) — expect insurance premiums to compound above CPI over the hold.
Questions for the listing agent
- It's been on market 53 days. Have you received any prior offers? Is the seller open to a 3% concession, seller financing, or rate buy-down credit?
- Property tax is high relative to price — has the assessment been appealed recently, and will the sale trigger a re-assessment?
- What's the actual annual flood-insurance premium (NFIP or private), and is the property in a SFHA with mandatory coverage?
- Is there a deadline driving the sale (1031 exchange, divorce, estate, relocation)? That informs how much negotiation room exists.
- Schools are B-rated — typically a magnet for longer-tenancy family renters. What's the average tenant stay here, and is there a school-zone premium baked into asking?
- The area grade is low — what's the realistic commute time and amenity access for the typical tenant pool here? Any planned neighborhood developments (good or bad) we should know about?
- What's the average days-on-market for RENTAL listings here right now (not sales)? A rising rental-DOM trend means longer vacancies and softer asking-rent achievability than the comps imply.
- What's the recent tenant-quality profile in this submarket — average credit score on applications, eviction rate, late-payment / NSF rate, and stable-employment percentage? A property-management company in the area should have these aggregated.
- How much new for-sale + rental construction is in the pipeline within 1–3 miles? Heavy new supply typically softens prices + rents 12–24 months out; constrained supply supports both.
Investment metrics
- 1% rule
- 5.80% ✓
- Cap rate
- 50.27%
- Cash-on-cash
- 157.07%
- DSCR
- 7.99
- GRM
- 1.4
CMA / ARV
- ARV (on-the-fly)
- $274,120
- Comps found
- 12
Show comp detail 12 sales within ~0.75 mi
| Address | Dist | Beds/Ba | Sqft | Sold | Price | $/sf | Match |
|---|---|---|---|---|---|---|---|
| 4367 Maple Dr | 0.00mi | 3/2.0 | 1,491 (-3%) | 1mo | $28,000 | $19 | 94 |
| 4251 Poplar Dr | 0.20mi | 4/2.0 (+1) | 1,615 (+5%) | 1mo | $257,000 | $159 | 77 |
| 4318 Gum Dr | 0.31mi | 3/2.0 | 1,426 (-7%) | 8mo | $180,500 | $127 | 66 |
| 40698 Cara Mae Dr | 0.74mi | 4/2.0 (+1) | 1,555 (+1%) | 0mo | $282,900 | $182 | 59 |
| 40674 Cara Mae Dr | 0.73mi | 4/2.0 (+1) | 1,555 (+1%) | 1mo | $277,900 | $179 | 58 |
| 40644 Cara Mae Dr | 0.74mi | 4/2.0 (+1) | 1,555 (+1%) | 3mo | $269,900 | $174 | 57 |
| 40620 Cara Mae Dr | 0.73mi | 4/2.0 (+1) | 1,555 (+1%) | 5mo | $282,900 | $182 | 55 |
| 40578 Cara Mae Dr | 0.73mi | 4/2.0 (+1) | 1,555 (+1%) | 6mo | $276,900 | $178 | 54 |
| 40574 Cara Mae Dr | 0.73mi | 4/2.0 (+1) | 1,555 (+1%) | 6mo | $281,900 | $181 | 54 |
| 4613 Oak Dr | 0.60mi | 3/2.0 | 1,345 (-13%) | 1mo | $250,000 | $186 | 50 |
| 4346 Gum Dr | 0.31mi | 3/2.0 | 1,334 (-13%) | 20mo | $150,000 | $112 | 46 |
| 40511 Cara Mae Dr | 0.73mi | 3/2.0 | 1,510 (-2%) | 23mo | $245,000 | $162 | 44 |
Match score weights: distance 35% · size 25% · config 20% · recency 20%. Top-matched comps best support the ARV.
Projected returns pro-forma
-3.0% appreciation · 1.72% rent growth · sell at horizon
- IRR
- —
- Equity multiple
- 5.89×
- Total profit
- $50,398
- Equity at exit
- $5,487
- IRR
- —
- Equity multiple
- 11.68×
- Total profit
- $110,056
- Equity at exit
- $3,182
Cash invested: $10,304 (down + closing). Projections, not guarantees.
Landlord ↔ Tenant lean methodology
- Overall (STATE)
- 90 Strongly Landlord-Friendly
- State Louisiana
- 90 Strongly Landlord-Friendly · R+12
- County
- — inherits STATE
- City
- — inherits STATE
ZIP-level market 70461
- Home prices YoY
- -33.0%
- Rents YoY
- 1.7%
- Active inventory
- 589
- Price-to-rent
- 1.4×
Monthly cashflow live
- Estimated rent
- $2,136 high interval (Pro) →
- Mortgage (P&I)
- −$193
- Tax from tax record
- −$130 /mo · $1,564/yr
- Insurance
- −$15
- Flood insurance flood zone
- −$427 /mo · $5,118/yr
- HOA
- −$0
- Vacancy / Maint / Mgmt
- −$449
- Net cashflow
- $922
Break-even live
UW: 25.0% down · 7.5% · 30yr · 1.5% tax · 5.0% vac · 8.0% maint · 8.0% mgmt
Financing live
Cash to close
- Down payment
- $9,200
- Closing costs
- $1,104
- Reserves months
- —
- Total cash needed
- —
Loan-product check · same deal, 3 products live
Conventional
25% down · 7.5% · 30yr
- Down + closing
- —
- Monthly P&I
- —
- Monthly cashflow
- —
- DSCR
- —
- Eligible?
- —
Personal DTI + credit; lowest rate.
DSCR
20% down · 8.5% · 30yr
- Down + closing
- —
- Monthly P&I
- —
- Monthly cashflow
- —
- DSCR
- —
- Eligible?
- —
No personal income docs; deal must DSCR.
Hard money
10% down · 12.0% · 12mo
- Down + closing
- —
- Monthly P&I
- —
- Monthly cashflow
- —
- DSCR
- —
- Eligible?
- —
Short-term bridge; refi at stabilization.
Rent comps 5 comps
| Address | Beds | Baths | Sqft | Rent | $/sqft | DOM | Units | Dist |
|---|---|---|---|---|---|---|---|---|
| 812 N Lake Verret Ct Slidell, LA | 3.0 | 2.0 | 1862 | $2,500 | $1.34 | 23d | 1 | 1.03mi |
| 4145 Saint Peter St Slidell, LA | 3.0 | 2.0 | 1422 | $2,000 | $1.41 | 43d | 1 | 1.07mi |
| 814 Lake Borgne Ct Slidell, LA | 3.0 | 2.0 | 1560 | $1,900 | $1.22 | 21d | 1 | 1.18mi |
| 59518 Autumn Dr Slidell, LA | 3.0 | 2.0 | 1374 | $2,200 | $1.60 | 11d | 1 | 1.41mi |
| 59518 Autumn Dr Slidell, LA | 3.0 | 2.0 | 1374 | $2,200 | $1.60 | 3d | 1 | 1.41mi |
Listing history 10 events
-
2026-04-20status Pending 104-char remark
Show marketing remark (104 chars)
BRING THIS HOME BACK TO LIFE*3 BEDROOM 2 BATH HOME*DEAD END STREET*NICE FRONT PORCH AND LARGE REAR YARD*
-
2026-04-20status Pending
Show marketing remark (104 chars)
BRING THIS HOME BACK TO LIFE*3 BEDROOM 2 BATH HOME*DEAD END STREET*NICE FRONT PORCH AND LARGE REAR YARD*
-
2026-04-15price $36,800 104-char remark
Show marketing remark (104 chars)
BRING THIS HOME BACK TO LIFE*3 BEDROOM 2 BATH HOME*DEAD END STREET*NICE FRONT PORCH AND LARGE REAR YARD*
-
2026-04-15price $36,800
Show marketing remark (104 chars)
BRING THIS HOME BACK TO LIFE*3 BEDROOM 2 BATH HOME*DEAD END STREET*NICE FRONT PORCH AND LARGE REAR YARD*
-
2026-02-26$40,000 Active 104-char remark
Show marketing remark (104 chars)
BRING THIS HOME BACK TO LIFE*3 BEDROOM 2 BATH HOME*DEAD END STREET*NICE FRONT PORCH AND LARGE REAR YARD*
-
2026-02-26$40,000 Active
Show marketing remark (104 chars)
BRING THIS HOME BACK TO LIFE*3 BEDROOM 2 BATH HOME*DEAD END STREET*NICE FRONT PORCH AND LARGE REAR YARD*
-
2006-04-27soldstatus $38,000
-
2006-04-13soldstatus $38,000
-
2006-01-02$29,000
-
2006-01-02$29,000
ⓘ Source: listings_history table (triggers on properties + properties_extension) + one-shot
backfill from property_details.listing_events for pre-trigger history.
Tax reassessment forecast LA · Resets to sale price
- Current annual tax
- $1,564 · $130/mo
- Projected year-2 tax
- $1,564 · $130/mo
- Expected delta
- $0/yr ($0/mo · 0.0%)
ⓘ Screening estimate from a state-policy table — verify with the county assessor before closing.
Climate risk First Street
- Flood 9/10 Extreme FEMA zone AE · 99% chance over 30 yrs
- Wildfire 3/10 Moderate
- Heat 9/10 Extreme 7 d/yr ≥107°F today · 21 d/yr by 30 yrs out
- Wind 9/10 Extreme 99% chance of damaging wind over 30 yrs
- Air quality 2/10 Low 1 unhealthy d/yr today · 2 by 30 yrs out
Nearby sold comps map
Loading sold comps map…
Walkable amenities ~0.75 mi
Loading nearby amenities…
Taxation est. · year 1
- Rental income
- $25,630
- − Mortgage interest
- −$2,061
- − Property taxes
- −$1,564
- − Insurance
- −$5,302
- − Repairs & maintenance
- −$2,050
- − Management
- −$2,050
- − Depreciation
- −$1,071
- Taxable income
- $11,531
- Est. tax owed @ 24.0%
- −$2,767
- After-tax cash flow
- $8,298/yr
For passive investors: Depreciation is non-cash, so a rental often shows a tax loss while cash-flowing — sheltering income. Rental losses are passive: they offset passive income freely, and up to $25,000/yr can offset ordinary (W-2) income if you actively participate and your MAGI is under $100k (phasing out to $0 by $150k); unused losses carry forward. On sale, claimed depreciation is recaptured at up to 25%, and gains may owe capital-gains tax (a 1031 exchange can defer both). Figures are a year-1 estimate at your 24.0% rate — not tax advice; consult a CPA.
Schools (NCES district)
- District
- St. Tammany Parish
- NCES district ID
- 2201650
- Math proficiency
- 43% ▼ -32.00%
- Reading proficiency
- 55% ▼ -26.00%
- Median HH income
- $61,752
- Composite
- 43.04/100
- National rank
- #3098
- State rank
- #11 of 98 in LA
Livability — Slidell
- Score
- 70/100
- State rank
- #57
- US rank
- #7673
Category grades
Schools grade is shown separately in the Schools card above.
Census & demographics
- County
- Saint Tammany Parish · 228,296 people
- City population
- 95,511
- Metro
- New Orleans-Metairie, LA
- Population (ZIP)
- 34,808
- Household income
- $89,003
- Rent vs Own
- Severe rent burden
- 328.0
Population outlook (St. Tammany County) Hauer SSP2
- Today (2025)
- 286,725 people
- By 2030
- 304,175 · +6.1%
- By 2040
- 336,203 · +17.3%
- By 2050
- 364,590 · +27.2%
- By 2075
- 433,362 · +51.1%
- By 2100
- 470,333 · +64.0%
Race, ethnicity, and origin ACS 2023
- Neighborhood character
- Diverse neighborhood (Simpson 0.63)
- Race & ethnicity
- White 55% Black 24% Two or more races 14% Hispanic / Latino 11% Asian 3%
- Hispanic origin (detail)
- Common ancestry
- Lithuanian 9% Italian 1% Romanian 1%
- Foreign-born
- 8% · Canada, China, Vietnam
- Languages at home
- 89% English-only · Spanish 7% Chinese 1% Vietnamese 1%
Political lean MEDSL · St. Tammany
- 2024 margin
- Solid R (+43.8) · D 27.3% · R 71.1% · Other 1.6%
- 2008→2024 swing
- +9.6pp toward D · 2008: -53.4pp · 2024: -43.8pp
- All cycles
- 2024: R+43.8 2020: R+44.2 2016: R+50.8 2012: R+52.2 2008: R+53.4
Not yet ingested
- Civics
- —
Market trends
- HPI YoY
- ▼ -74.47%
- Current HPI
- 151.3353
- Rent YoY
- ▲ 1.72%
- Metro
- New Orleans-Metairie, LA
- State GDP YoY
- ▲ 3.29%
- F500 in state
- 10
Industry mix (Fortune 500 HQ in LA)
| Industry | F500 HQs | Revenue |
|---|---|---|
| Telecommunications | 2 | $23B |
|
||
| Utilities | 1 | $12B |
|
||
| Wholesale / Distribution | 1 | $5B |
|
||
| Advertising | 1 | $2B |
|
||
Price history
+26.9% since first listed10 events — show timeline
- 2026-04-20 Pending — AcadianaMLS
- 2026-04-20 Pending — GSREIN
- 2026-04-15 Price Changed $36,800 AcadianaMLS
- 2026-04-15 Price Changed $36,800 GSREIN
- 2026-02-26 Listed $40,000 GSREIN
- 2026-02-26 Listed $40,000 AcadianaMLS
- 2006-04-27 Sold (Public Records) $38,000 Public Records
- 2006-04-13 Sold (MLS) $38,000 GSREIN
- 2006-01-02 Listed $29,000 GSREIN
- 2006-01-02 Listed $29,000 AcadianaMLS
Property tax history
+2.6%/yrLatest (2025): $1,564 · +142.2% YoY. Source: county tax records.
Cash-flow waterfall
monthlySold comps — $/sqft
last 12 mo · ≤1 miLoading sold comps…