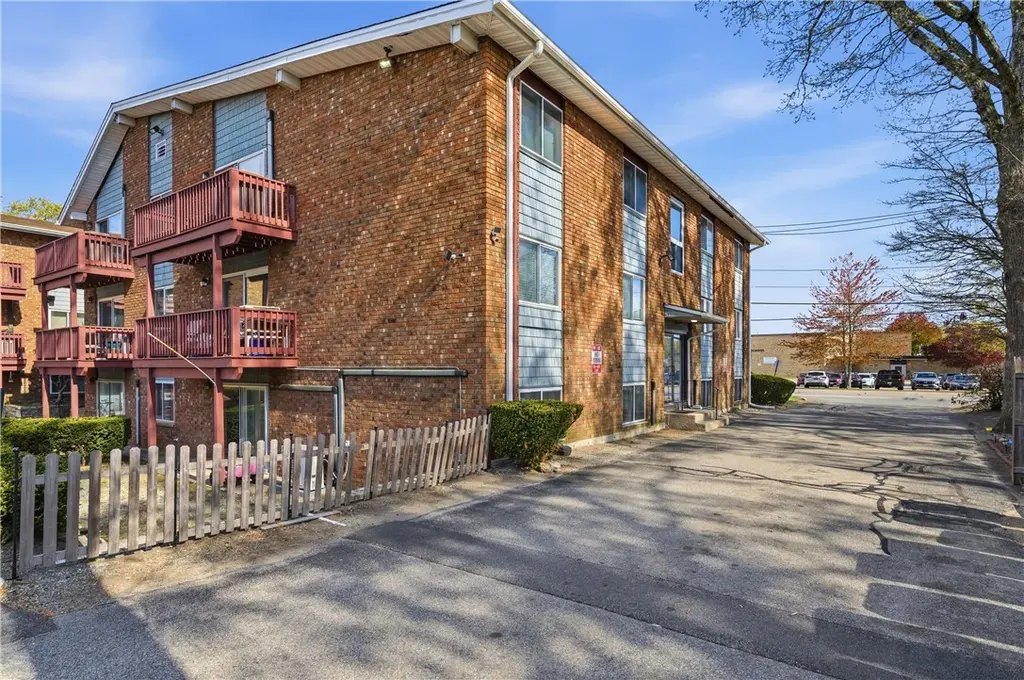
110 Pilgrim Pkwy #11 · Warwick, RI
Flood risk 1/10 · Minimal
- FEMA flood zone
- X (unshaded)
- Chance of flooding over 30 yrs
- 0.0%
- Est. flood insurance / yr
- $507 – $1,088
Fire risk 1/10 · Minimal
- Est. fire insurance / yr
- $835 – $1,551
Heat risk 5/10 · Moderate
- Hot days now (above 96°F)
- 7 days/yr
- Hot days in 30 yrs
- 16 days/yr
Wind risk 6/10 · Moderate
- Chance of severe wind over 30 yrs
- 70.0%
Air-quality risk 2/10 · Minimal
- Unhealthy air days now
- 2 days/yr
- Unhealthy air days in 30 yrs
- 2 days/yr
Risk factors via First Street. Map © Google.
Why this score? — see what drove the D grade
The composite is a weighted blend of 9 inputs, each scored 0–100. Each bar is that input's sub-score; the figure is the points it added to the 100-point composite (weight × sub-score).
- Cash flow +15.0/30.0
- 1% rule +5.7/10.0
- ARV discount +4.9/15.0
- DSCR +4.6/10.0
- Livability +3.9/5.0
- Rent growth +2.5/5.0
- Condition / age +2.5/5.0
- Schools +2.2/10.0
- Appreciation +0.0/10.0
$214,900
🖨 Deal sheet (PDF) 📄 Offer letter ✓ Due diligence
Listing remarks MLS
SOLD BEFORE PRINT!
Key facts
- Private balcony
- Centrally located
- Updated kitchen
Tags
Property features AI
Finance
- Financial info: Pets allowed: cats and small dogs (under 25 lbs.)
- HOA & community: Monthly association fee of $330 covering grounds maintenance, parking, and snow removal; Community of 36 units; Community amenities include golf, highway access, nearby schools, public transportation, recreation area, restaurants, and shopping
Exterior
- Parking: Assigned parking (2 spaces), no garage
- Utilities: Sewer connected; Water connected; Electric with circuit breakers
- Home design: Pilgrim Court building; 3 stories; First-floor entry access; Entry level listed as 2
- Construction: Plaster, brick, and vinyl siding construction; Concrete perimeter foundation
- Exterior features: Sprinkler/irrigation system; Paved driveway
Interior
- Kitchen: Eat-in kitchen; Oven; Range; Refrigerator
- Bedrooms: Two bedrooms on the first floor
- Flooring: Laminate flooring; Carpet
- Bathrooms: One full bathroom
- Heating & cooling: Forced air heating (electric); Central air conditioning
- Interior features: Tub with shower
- Laundry & utility: Laundry in a common area; Water heater
Neighborhood map
What this means for you Summary
Snapshot
- This is a 2-bed/1.0-bath condo listed at $215k.
Deal economics
- At list price, monthly cash flow is $68 ($815/yr) — positive.
- The deal already cash-flows at list — no discount required.
- Meets the 1% rule at list price ($2k rent vs $215k).
- Recommended offer: $212k (1.5% below list) — sets the bar for market timing.
- Cap rate 6.7% vs local median 3.3% in Warwick — top-decile yield for the area; either an underpriced asset or a hidden risk that comps aren't pricing in. Stress-test before assuming the spread holds.
Location & tenants
- Location reads 78/100 on livability (#6 in RI, #2,425 nationally) — a middle-class / working-renter tenant base. Strengths: crime A+, commute A+, housing A+; Watch: amenities F.
- Warwick (urban): math 15% / reading 32% proficiency, ranked #25 of 39 in RI (top 64%) — low school quality limits family demand, transient renter base, plan for 1-2y turnover.
- Zoned schools: Holliman School (math 17% / reading 37%, grade F, #82 of 167 statewide, top 53%, 282 students, 36% FRL); Pilgrim High School (math 20% / reading 48%, grade F, #29 of 58 statewide, top 49%, 1,147 students, 32% FRL).
- Market conditions: 70 active listings in the ZIP; 12 comparable units currently listed for rent nearby; rentals at typical pace (median 19d on market — plan ~3-4 weeks tenant-placement turnaround); 471 units permitted in Kent County in 2024 (240 in 5+ unit buildings).
Forward outlook
- Local home prices are declining (-3.0%/yr); year-one equity from $1k of loan paydown is wiped out by about $6k of value loss. Plan a longer hold.
- Kent County population projected at -14% by 2050 — secular population decline; favor cash flow + early exit over multi-decade hold.
Negotiation context
- It's been on market 17 days — a 2% lower offer ($212k) is reasonable based on typical stale-listing flexibility.
- 2 sale attempts since 25y ago with the ask held roughly flat each time — persistent listings suggest the price (not the market) is what's stuck; bring a comps-based counter.
- Current owner paid $145k; 48% above their basis — modest negotiation headroom, anchor on the comps not their cost.
Risks & watch-outs
- Climate carrying-cost: major wind risk, 70% chance of damaging wind over 30y; extreme-heat days projected 7→16/yr by 2055 (HVAC capex compounding) — expect insurance premiums to compound above CPI over the hold.
Questions for the listing agent
- Built in 1970 — when were the roof, HVAC, electrical panel, plumbing, and water heater last replaced?
- What does the HOA fee cover, when was the last increase, and are there any pending special assessments or reserve-fund shortfalls?
- Any open or pending special assessments — roof, HVAC, plumbing, elevator, façade? What's the per-unit balance and payoff schedule, and is the seller paying it off at close or rolling it to the buyer?
- Is there a deadline driving the sale (1031 exchange, divorce, estate, relocation)? That informs how much negotiation room exists.
- Schools are D-rated, which usually means shorter tenancies and higher turnover. Who's the typical renter profile here, and what's been the actual vacancy rate?
- The area grade is low — what's the realistic commute time and amenity access for the typical tenant pool here? Any planned neighborhood developments (good or bad) we should know about?
- What's the average days-on-market for RENTAL listings here right now (not sales)? A rising rental-DOM trend means longer vacancies and softer asking-rent achievability than the comps imply.
- What's the recent tenant-quality profile in this submarket — average credit score on applications, eviction rate, late-payment / NSF rate, and stable-employment percentage? A property-management company in the area should have these aggregated.
- How much new apartment / multifamily construction is in the pipeline within 1–3 miles? Heavy new supply (>2% of stock underway) typically softens rents 12–24 months out; light construction supports rent growth.
Investment metrics
- 1% rule
- 1.07% ✓
- Cap rate
- 6.67%
- Cash-on-cash
- 1.35%
- DSCR
- 1.06
- GRM
- 7.8
CMA / ARV
- ARV (median comp)
- $203,306
- List price
- $214,900
- Delta
- 5.70%
- Verdict
- FAIR
- Comps
- 19 within 1.0 mi
Projected returns pro-forma
-3.0% appreciation · 3.0% rent growth · sell at horizon
- IRR
- -14.0%
- Equity multiple
- 0.50×
- Total profit
- $-30,306
- Equity at exit
- $32,042
- IRR
- -5.1%
- Equity multiple
- 0.67×
- Total profit
- $-20,037
- Equity at exit
- $18,581
Cash invested: $60,172 (down + closing). Projections, not guarantees.
Landlord ↔ Tenant lean methodology
- Overall (STATE)
- 31 Tenant-Leaning
- State Rhode Island
- 31 Tenant-Leaning · D+8
- County
- — inherits STATE
- City
- — inherits STATE
ZIP-level market 02888
- Active inventory
- 70
- Price-to-rent
- 7.8×
Monthly cashflow live
- Estimated rent
- $2,293 high interval (Pro) →
- Mortgage (P&I)
- −$1,127
- Tax from tax record
- −$197 /mo · $2,363/yr
- Insurance
- −$90
- HOA
- −$330
- Vacancy / Maint / Mgmt
- −$481
- Net cashflow
- $68
Break-even live
Sensitivity live
| Price | -10% $190 | -5% $129 | +0% $68 | +5% $7 | +10% $-54 |
|---|---|---|---|---|---|
| Rent | -10% $-113 | -5% $-23 | +0% $68 | +5% $158 | +10% $249 |
| Rate | -1.0pp $176 | -0.5pp $123 | base $68 | +0.5pp $12 | +1.0pp $-44 |
UW: 25.0% down · 7.5% · 30yr · 1.5% tax · 5.0% vac · 8.0% maint · 8.0% mgmt
Financing live
Cash to close
- Down payment
- $53,725
- Closing costs
- $6,447
- Reserves months
- —
- Total cash needed
- —
Loan-product check · same deal, 3 products live
Conventional
25% down · 7.5% · 30yr
- Down + closing
- —
- Monthly P&I
- —
- Monthly cashflow
- —
- DSCR
- —
- Eligible?
- —
Personal DTI + credit; lowest rate.
DSCR
20% down · 8.5% · 30yr
- Down + closing
- —
- Monthly P&I
- —
- Monthly cashflow
- —
- DSCR
- —
- Eligible?
- —
No personal income docs; deal must DSCR.
Hard money
10% down · 12.0% · 12mo
- Down + closing
- —
- Monthly P&I
- —
- Monthly cashflow
- —
- DSCR
- —
- Eligible?
- —
Short-term bridge; refi at stabilization.
Rent comps 12 comps
| Address | Beds | Baths | Sqft | Rent | $/sqft | DOM | Units | Dist |
|---|---|---|---|---|---|---|---|---|
| 900 Post Rd Warwick, RI | 2.0 | 1.5 | 990 | $2,260 | $2.28 | 6d | 1 | 0.50mi |
| 900 Post Rd Warwick, RI | 1.0–2.0 | 1.0–1.5 | 815 | $2,185 | $2.68 | 3d | 6 | 0.50mi |
| 5 Shippen Ave Warwick, RI | 2.0 | 1.0 | 1111 | $2,500 | $2.25 | 25d | 1 | 0.52mi |
| 0 W Shore Rd Warwick, RI | 1.0 | 1.0 | 650 | $1,550 | $2.38 | 45d | 1 | 0.82mi |
| 135 Park View Ave Warwick, RI | 2.0 | 1.0 | 912 | $2,500 | $2.74 | 3d | 1 | 0.82mi |
| 126 Washington St Unit 1 Warwick, RI | 2.0 | 1.0 | 840 | $2,000 | $2.38 | 19d | 1 | 1.03mi |
| 200 Post Rd #416 Warwick, RI | 2.0 | 1.0 | 932 | $2,500 | $2.68 | 3d | 1 | 1.34mi |
| 200 Post Rd Warwick, RI | 1.0–2.0 | 1.0–1.5 | 1016 | $2,500 | $2.46 | 13d | 2 | 1.34mi |
| 175 Massachusetts Ave #103 Warwick, RI | 2.0 | 1.0 | 1000 | $2,000 | $2.00 | 19d | 1 | 1.36mi |
| 175 Massachusetts Ave #103 Warwick, RI | 2.0 | 1.0 | 1000 | $2,400 | $2.40 | 45d | 1 | 1.36mi |
| 400 Narragansett Pkwy Warwick, RI | 2.0 | 1.0–1.5 | 776 | $2,800 | $3.61 | 25d | 2 | 1.45mi |
| 400 Narragansett Pkwy Unit EI2 Warwick, RI | 2.0 | 1.5 | 1002 | $2,800 | $2.79 | 3d | 1 | 1.46mi |
HOA detail condo
- Monthly dues
- $330 · $3,960/yr
- Assessments
- None detected in remarks — confirm with the listing agent.
Listing history 6 events
-
2026-05-06$214,900 Active 593-char remark
-
2004-10-08soldstatus $145,000
-
2001-10-01soldstatus $60,000
-
2001-07-30soldstatus $41,900 18-char remark
Show marketing remark (18 chars)
SOLD BEFORE PRINT!
-
2001-03-26historical 18-char remark
Show marketing remark (18 chars)
SOLD BEFORE PRINT!
-
2001-02-16$41,900 18-char remark
Show marketing remark (18 chars)
SOLD BEFORE PRINT!
ⓘ Source: listings_history table (triggers on properties + properties_extension) + one-shot
backfill from property_details.listing_events for pre-trigger history.
Tax reassessment forecast RI · Partial reset (capped growth)
- Current annual tax
- $2,363 · $197/mo
- Projected year-2 tax
- $2,933 · $244/mo
- Expected delta
- +$570/yr (+$47/mo · 24.1%)
ⓘ Screening estimate from a state-policy table — verify with the county assessor before closing.
Climate risk First Street
- Flood 1/10 Low FEMA zone X (unshaded) · 0% chance over 30 yrs
- Wildfire 1/10 Low
- Heat 5/10 Major 7 d/yr ≥96°F today · 16 d/yr by 30 yrs out
- Wind 6/10 Major 70% chance of damaging wind over 30 yrs
- Air quality 2/10 Low 2 unhealthy d/yr today · 2 by 30 yrs out
Nearby sold comps map
Loading sold comps map…
Walkable amenities ~0.75 mi
Loading nearby amenities…
Taxation est. · year 1
- Rental income
- $27,513
- − Mortgage interest
- −$12,038
- − Property taxes
- −$2,363
- − Insurance
- −$1,074
- − Repairs & maintenance
- −$2,201
- − Management
- −$2,201
- − HOA
- −$3,960
- − Depreciation
- −$6,252
- Taxable loss
- −$2,576
- Est. tax savings @ 24.0%
- +$618
- After-tax cash flow
- $1,433/yr
For passive investors: Depreciation is non-cash, so a rental often shows a tax loss while cash-flowing — sheltering income. Rental losses are passive: they offset passive income freely, and up to $25,000/yr can offset ordinary (W-2) income if you actively participate and your MAGI is under $100k (phasing out to $0 by $150k); unused losses carry forward. On sale, claimed depreciation is recaptured at up to 25%, and gains may owe capital-gains tax (a 1031 exchange can defer both). Figures are a year-1 estimate at your 24.0% rate — not tax advice; consult a CPA.
Schools (NCES district)
- District
- Warwick
- NCES district ID
- 4401110
- Math proficiency
- 15% ▼ -11.00%
- Reading proficiency
- 32% ▼ -7.00%
- Median HH income
- $63,420
- Composite
- 22.03/100
- National rank
- #8203
- State rank
- #25 of 39 in RI
Livability — Warwick
- Score
- 78/100
- State rank
- #6
- US rank
- #2425
Category grades
Schools grade is shown separately in the Schools card above.
Census & demographics
- Census place
- Warwick, RI
- City population
- 108,434
- Population (ZIP)
- 18,951
Population outlook (Kent County) Hauer SSP2
- Today (2025)
- 160,994 people
- By 2030
- 157,428 · -2.2%
- By 2040
- 148,389 · -7.8%
- By 2050
- 137,995 · -14.3%
- By 2075
- 118,536 · -26.4%
- By 2100
- 102,266 · -36.5%
Race, ethnicity, and origin ACS 2023
- Neighborhood character
- Predominantly White (81%)
- Race & ethnicity
- White 81% Two or more races 7% Black 6% Hispanic / Latino 6% Asian 1%
- Hispanic origin (detail)
- Puerto Rican 2% Dominican 2%
- Common ancestry
- Russian 10% Lithuanian 6% Romanian 3%
- Foreign-born
- 7% · Canada
- Languages at home
- 91% English-only · Spanish 3% Other Indo-European 2% French/Haitian/Cajun 2%
Political lean MEDSL · Kent
- 2024 margin
- Toss-up / Even · D 49.9% · R 48.1% · Other 2.0%
- 2008→2024 swing
- -15.6pp toward R · 2008: 17.5pp · 2024: 1.9pp
- All cycles
- 2024: D+1.9 2020: D+7.6 2016: R+0.7 2012: D+18.4 2008: D+17.5
Not yet ingested
- Civics
- —
Market trends
- HPI YoY
- ▼ -570.87%
- Current HPI
- 371.5696
- Rent YoY
- —
- Metro
- —
- State GDP YoY
- ▲ 2.25%
- F500 in state
- 10
Industry mix (Fortune 500 HQ in RI)
| Industry | F500 HQs | Revenue |
|---|---|---|
| Healthcare | 1 | $373B |
|
||
| Food Distribution | 1 | $31B |
|
||
| Aerospace / Defense | 1 | $14B |
|
||
| Financial Services | 1 | $8B |
|
||
| Consumer Goods | 1 | $4B |
|
||
Price history
+412.9% since first listed7 events — show timeline
- 2026-05-23 Pending — RIS
- 2026-05-06 Listed $214,900 RIS
- 2004-10-08 Sold (Public Records) $145,000 Public Records
- 2001-10-01 Sold (Public Records) $60,000 Public Records
- 2001-07-30 Sold (MLS) $41,900 RIS
- 2001-03-26 Listing Removed — RIS
- 2001-02-16 Listed $41,900 RIS
Property tax history
+3.1%/yrLatest (2025): $2,363 · +4.7% YoY. Source: county tax records.
Cash-flow waterfall
monthlySold comps — $/sqft
last 12 mo · ≤1 miLoading sold comps…