 Duplex
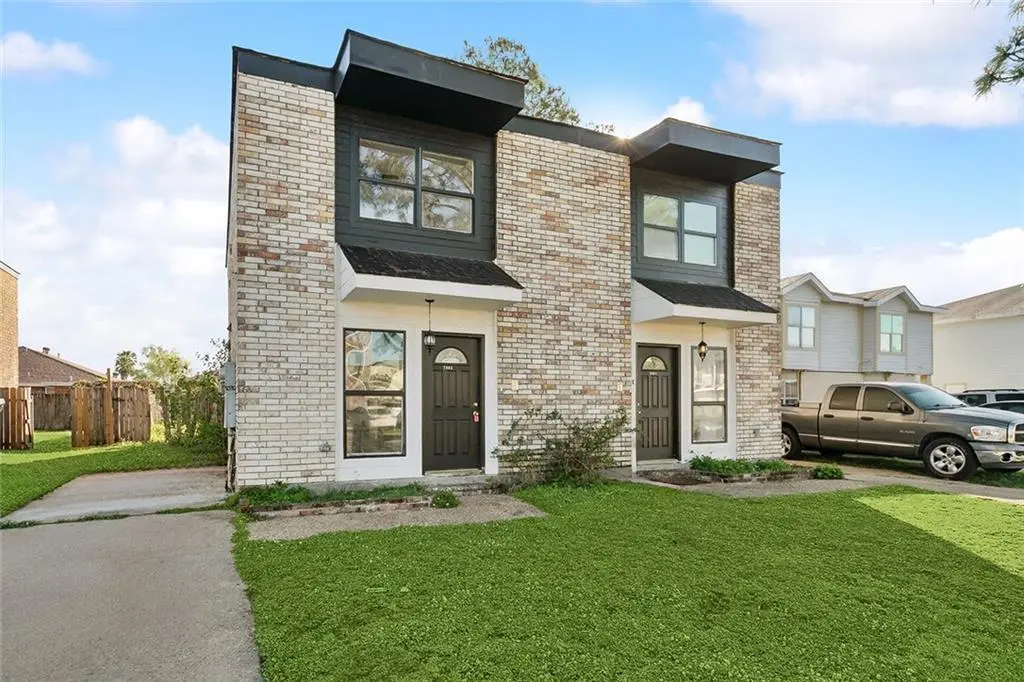
7001-7003 Yorktown Dr · New Orleans, LA
Flood risk 9/10 · Severe
- FEMA flood zone
- X (shaded)
- Chance of flooding over 30 yrs
- 0.6%
- Est. flood insurance / yr
- $507 – $1,088
Fire risk 1/10 · Minimal
- Est. fire insurance / yr
- $1,269 – $2,357
Heat risk 10/10 · Severe
- Hot days now (above 107°F)
- 7 days/yr
- Hot days in 30 yrs
- 21 days/yr
Wind risk 10/10 · Severe
- Chance of severe wind over 30 yrs
- 99.0%
Air-quality risk 3/10 · Minor
- Unhealthy air days now
- 3 days/yr
- Unhealthy air days in 30 yrs
- 3 days/yr
Risk factors via First Street. Map © Google.
Why this score? — see what drove the B grade
The composite is a weighted blend of 9 inputs, each scored 0–100. Each bar is that input's sub-score; the figure is the points it added to the 100-point composite (weight × sub-score).
- Cash flow +30.0/30.0
- DSCR +10.0/10.0
- 1% rule +9.8/10.0
- ARV discount +9.8/15.0
- Livability +4.0/5.0
- Rent growth +2.5/5.0
- Condition / age +2.5/5.0
- Schools +1.6/10.0
- Appreciation +0.0/10.0
$203,000
🖨 Deal sheet 📄 Offer letter ✓ Due diligence
Multi-family units
County records classify this as Multi-Family (2-4 Unit). Listing-text estimate: 2 units. confirmed
Listing remarks MLS
Best Duplex deal in the city. Collect rent from one side and live almost free on the other side! Don't miss your opportunity to own this stunning two-story duplex, perfectly designed for both comfort and investment potential! Nestled in a quiet neighborhood, this property features a charming exterior with modern aesthetics and great INCOME potential. This is subject to a short sale.
Key facts
- Two-story duplex
- Income potential
- Quiet neighborhood
Tags
Property features AI
Finance
- Financial info: Property contains 2 total units
Exterior
- Parking: Driveway with two parking spaces
- Utilities: Public water; Public sewer
- Home design: Duplex (2 units); 2-story building
- Construction: Brick construction; Shingle roof; Slab foundation; Built in very good condition
- Exterior features: City lot with rectangular shape; Lot dimensions approximately 52 x 114
Interior
- Bedrooms: Each unit has 3 bedrooms
- Bathrooms: Each unit has 2 total bathrooms (1 full and 1 half)
- Heating & cooling: Central heating; Central air conditioning
- Interior features: Two 2-story units in very good condition; Tenant pays electricity, gas, and water
Neighborhood map
What this means for you Summary
Snapshot
- This is a 2 × 3-bed/1.5-bath units multifamily listed at $203k.
Deal economics
- At list price, monthly cash flow is $975 ($12k/yr) — positive. Per door: $488/mo.
- The deal already cash-flows at list — no discount required.
- Meets the 1% rule at list price ($3k rent vs $203k).
- Cap rate 12.4% vs local median 4.4% in New Orleans — top-decile yield for the area; either an underpriced asset or a hidden risk that comps aren't pricing in. Stress-test before assuming the spread holds.
Location & tenants
- Location reads 81/100 on livability (#3 in LA, #1,383 nationally) — a professional / high-income tenant draw. Strengths: amenities A+, commute A+, health & safety A+; Watch: crime C-, employment D.
- Orleans Parish (urban): math 11% / reading 27% proficiency, ranked #69 of 98 in LA (top 70%) — low school quality limits family demand, transient renter base, plan for 1-2y turnover; 68% free/reduced lunch — lower-income household profile, screen leases tightly.
- Market conditions: 128 active listings in the ZIP; 12 comparable units currently listed for rent nearby; rentals at typical pace (median 24d on market — plan ~3-4 weeks tenant-placement turnaround); lower-income renter base — watch delinquency; 710 units permitted in Orleans Parish in 2024 (244 in 5+ unit buildings).
- At $3,011/mo this rent would consume 89% of the median local household income ($41k/yr) (locally 2030% of renters already pay >50% of income on rent) — very limited rent-growth headroom before tenants either downsize or default.
Forward outlook
- Local home prices are declining (-3.0%/yr); year-one equity from $1k of loan paydown is wiped out by about $6k of value loss. Plan a longer hold.
- Orleans County population projected at +61% by 2050 — long-run rental-demand tailwind backs the buy-and-hold thesis.
- At projected returns (-3.0% appreciation + 3.0% rent growth), your $57k cash investment doubles in ~6 years — after that, you're playing with house money.
Negotiation context
- Only 1 days on market — expect competitive offers; lowballing is unlikely to land.
- 8 sale attempts since 28y ago with the ask held roughly flat each time — persistent listings suggest the price (not the market) is what's stuck; bring a comps-based counter.
- Current owner paid $80k; list at $203k implies a 154% gain — meaningful room to come down on a strong offer.
Risks & watch-outs
- Watch-outs: flood insurance adds $66/mo.
- Climate carrying-cost: severe flood risk; severe wind risk, 99% chance of damaging wind over 30y; extreme-heat days projected 7→21/yr by 2055 (HVAC capex compounding) — expect insurance premiums to compound above CPI over the hold.
Questions for the listing agent
- Can we see the unit-by-unit rent roll, current vacancy, and any below-market leases? What's the average tenancy length?
- What capital expenditures (roof, boiler, parking lot, exteriors) have been made in the last 5 years, and what's planned in the next 2?
- Built in 1978 — when were the roof, HVAC, electrical panel, plumbing, and water heater last replaced?
- What's the actual annual flood-insurance premium (NFIP or private), and is the property in a SFHA with mandatory coverage?
- Is there a deadline driving the sale (1031 exchange, divorce, estate, relocation)? That informs how much negotiation room exists.
- What's the average days-on-market for RENTAL listings here right now (not sales)? A rising rental-DOM trend means longer vacancies and softer asking-rent achievability than the comps imply.
- What's the recent tenant-quality profile in this submarket — average credit score on applications, eviction rate, late-payment / NSF rate, and stable-employment percentage? A property-management company in the area should have these aggregated.
- How much new apartment / multifamily construction is in the pipeline within 1–3 miles? Heavy new supply (>2% of stock underway) typically softens rents 12–24 months out; light construction supports rent growth.
Investment metrics
- 1% rule
- 1.48% ✓
- Cap rate
- 12.45%
- Cash-on-cash
- 21.99%
- DSCR
- 1.98
- GRM
- 5.6
CMA / ARV
- ARV (on-the-fly)
- $213,774
- Comps found
- 9
Show comp detail 9 sales within ~0.75 mi
| Address | Dist | Beds/Ba | Sqft | Sold | Price | $/sf | Match |
|---|---|---|---|---|---|---|---|
| 7160 Bunker Hill Rd | 0.16mi | 5/3.0 (+1) | 2,718 (+0%) | 7mo | $190,000 | $70 | 77 |
| 7131 Yorktown Dr | 0.12mi | 5/3.0 (+1) | 2,814 (+4%) | 7mo | $179,000 | $64 | 73 |
| 7140 42 Boston Dr | 0.14mi | 5/3.0 (+1) | 2,648 (-2%) | 14mo | $225,000 | $85 | 69 |
| 7120 22 Bunker Hill Rd | 0.13mi | 5/3.0 (+1) | 2,450 (-10%) | 6mo | $212,500 | $87 | 64 |
| 7143 Boston Dr | 0.15mi | 5/3.0 (+1) | 2,648 (-2%) | 20mo | $208,000 | $79 | 64 |
| 7100 02 Bunker Hill Rd | 0.10mi | 5/3.0 (+1) | 2,450 (-10%) | 8mo | $225,000 | $92 | 64 |
| 8830 32 Bunker Hill Rd | 0.11mi | 4/3.0 | 2,400 (-11%) | 23mo | $165,000 | $69 | 53 |
| 8921 23 Gervais St | 0.60mi | 5/3.0 (+1) | 2,373 (-12%) | 14mo | $194,000 | $82 | 31 |
| 8601 Dinkins St | 0.68mi | 5/3.0 (+1) | 2,303 (-15%) | 12mo | $160,000 | $69 | 24 |
Match score weights: distance 35% · size 25% · config 20% · recency 20%. Top-matched comps best support the ARV.
Projected returns pro-forma
-3.0% appreciation · 3.0% rent growth · sell at horizon
- IRR
- 12.9%
- Equity multiple
- 1.51×
- Total profit
- $29,256
- Equity at exit
- $30,268
- IRR
- 21.8%
- Equity multiple
- 2.86×
- Total profit
- $105,633
- Equity at exit
- $17,552
Cash invested: $56,840 (down + closing). Projections, not guarantees.
Landlord ↔ Tenant lean methodology
- Overall (STATE)
- 90 Strongly Landlord-Friendly
- State Louisiana
- 90 Strongly Landlord-Friendly · R+12
- County
- — inherits STATE
- City
- — inherits STATE
ZIP-level market 70127
- Home prices YoY
- -29.2%
- Active inventory
- 128
- Price-to-rent
- 11.2×
Monthly cashflow live
- Estimated rent
- $3,011 high interval (Pro) →
- Mortgage (P&I)
- −$1,065
- Tax from tax record
- −$188 /mo · $2,256/yr
- Insurance
- −$85
- Flood insurance flood zone
- −$66 /mo · $798/yr
- HOA
- −$0
- Vacancy / Maint / Mgmt
- −$632
- Net cashflow
- $975
Break-even live
2-unit breakdown (identical units grouped — click to expand)
| Units | Beds | Baths | Est. rent |
|---|---|---|---|
| 2× units | 3 | 1.5 | $3,010 |
| #1 | 3 | 1.5 | $1,505 |
| #2 | 3 | 1.5 | $1,505 |
| Total (2 units) | $3,011 | ||
UW: 25.0% down · 7.5% · 30yr · 1.5% tax · 5.0% vac · 8.0% maint · 8.0% mgmt
Financing live
Cash to close
- Down payment
- $50,750
- Closing costs
- $6,090
- Reserves months
- —
- Total cash needed
- —
Loan-product check · same deal, 3 products live
Conventional
25% down · 7.5% · 30yr
- Down + closing
- —
- Monthly P&I
- —
- Monthly cashflow
- —
- DSCR
- —
- Eligible?
- —
Personal DTI + credit; lowest rate.
DSCR
20% down · 8.5% · 30yr
- Down + closing
- —
- Monthly P&I
- —
- Monthly cashflow
- —
- DSCR
- —
- Eligible?
- —
No personal income docs; deal must DSCR.
Hard money
10% down · 12.0% · 12mo
- Down + closing
- —
- Monthly P&I
- —
- Monthly cashflow
- —
- DSCR
- —
- Eligible?
- —
Short-term bridge; refi at stabilization.
Rent comps 12 comps
| Address | Beds | Baths | Sqft | Rent | $/sqft | DOM | Units | Dist |
|---|---|---|---|---|---|---|---|---|
| 7063 Boston Dr New Orleans, LA | 4.0 | 2.5 | 1750 | $1,900 | $1.09 | 16d | 1 | 0.10mi |
| 6910 Bunker Hill Rd New Orleans, LA | 3.0 | 2.5 | 1785 | $1,400 | $0.78 | 20d | 1 | 0.10mi |
| 6951 Salem Dr New Orleans, LA | 3.0 | 2.5 | 1900 | $1,875 | $0.99 | 23d | 1 | 0.13mi |
| 6972 Bundy Rd New Orleans, LA | 3.0 | 2.5 | 2048 | $1,500 | $0.73 | 23d | 1 | 0.16mi |
| 7202 Salem Dr New Orleans, LA | 3.0 | 2.5 | 1995 | $1,750 | $0.88 | 23d | 1 | 0.21mi |
| 7201 Salem Dr New Orleans, LA | 3.0 | 2.5 | 1764 | $1,650 | $0.94 | 23d | 1 | 0.22mi |
| 7401 Scottsdale Dr New Orleans, LA | 3.0 | 2.5 | 2100 | $2,000 | $0.95 | 23d | 1 | 0.43mi |
| 8936 Curran Blvd New Orleans, LA | 3.0 | 2.0 | 2050 | $1,575 | $0.77 | 21d | 1 | 0.54mi |
| 7608 Laine Ave New Orleans, LA | 3.0 | 2.5 | 2060 | $1,950 | $0.95 | 23d | 1 | 0.73mi |
| 5611 Rickert Dr New Orleans, LA | 3.0 | 2.5 | 2155 | $2,900 | $1.35 | 43d | 1 | 0.92mi |
| 10951 Roger Dr Unit B New Orleans, LA | 3.0 | 2.5 | 2048 | $1,850 | $0.90 | 23d | 1 | 1.25mi |
| 5000 Cardenas Dr New Orleans, LA | 3.0 | 2.0 | 1800 | $1,920 | $1.07 | 23d | 1 | 1.47mi |
Listing history 24 events
-
2026-04-10status Pending 385-char remark
Show marketing remark (385 chars)
Best Duplex deal in the city. Collect rent from one side and live almost free on the other side! Don't miss your opportunity to own this stunning two-story duplex, perfectly designed for both comfort and investment potential! Nestled in a quiet neighborhood, this property features a charming exterior with modern aesthetics and great INCOME potential. This is subject to a short sale.
-
2026-04-10status Pending
Show marketing remark (385 chars)
Best Duplex deal in the city. Collect rent from one side and live almost free on the other side! Don't miss your opportunity to own this stunning two-story duplex, perfectly designed for both comfort and investment potential! Nestled in a quiet neighborhood, this property features a charming exterior with modern aesthetics and great INCOME potential. This is subject to a short sale.
-
2026-04-06$203,000 Active 385-char remark
Show marketing remark (385 chars)
Best Duplex deal in the city. Collect rent from one side and live almost free on the other side! Don't miss your opportunity to own this stunning two-story duplex, perfectly designed for both comfort and investment potential! Nestled in a quiet neighborhood, this property features a charming exterior with modern aesthetics and great INCOME potential. This is subject to a short sale.
-
2026-04-06$203,000 Active
Show marketing remark (385 chars)
Best Duplex deal in the city. Collect rent from one side and live almost free on the other side! Don't miss your opportunity to own this stunning two-story duplex, perfectly designed for both comfort and investment potential! Nestled in a quiet neighborhood, this property features a charming exterior with modern aesthetics and great INCOME potential. This is subject to a short sale.
-
2026-03-05status Pending
-
2026-02-10price $175,000
-
2026-02-10price $175,000
-
2026-01-12price $215,000
-
2026-01-12price $215,000
-
2025-11-12price $218,500
-
2025-11-11price $218,500
-
2025-10-10price $220,000
-
2025-10-10price $220,000
-
2025-09-20price $225,000
-
2025-09-20price $225,000
-
2025-08-14$230,000 Active
-
2025-05-09$220,000 Active
-
2025-03-24$245,000 Active
-
2022-10-24$199,999
-
1998-12-18soldstatus $79,900
-
1998-12-18soldstatus $79,000
-
1998-06-04$79,900
-
1998-06-04$79,900
-
1997-04-10soldstatus $42,000
ⓘ Source: listings_history table (triggers on properties + properties_extension) + one-shot
backfill from property_details.listing_events for pre-trigger history.
Tax reassessment forecast LA · Resets to sale price
- Current annual tax
- $2,256 · $188/mo
- Projected year-2 tax
- $2,256 · $188/mo
- Expected delta
- $0/yr ($0/mo · 0.0%)
ⓘ Screening estimate from a state-policy table — verify with the county assessor before closing.
Climate risk First Street
- Flood 9/10 Extreme FEMA zone X (shaded) · 60% chance over 30 yrs
- Wildfire 1/10 Low
- Heat 10/10 Extreme 7 d/yr ≥107°F today · 21 d/yr by 30 yrs out
- Wind 10/10 Extreme 99% chance of damaging wind over 30 yrs
- Air quality 3/10 Moderate 3 unhealthy d/yr today · 3 by 30 yrs out
Nearby sold comps map
Loading sold comps map…
Walkable amenities ~0.75 mi
Loading nearby amenities…
Taxation est. · year 1
- Rental income
- $36,132
- − Mortgage interest
- −$11,371
- − Property taxes
- −$2,256
- − Insurance
- −$1,812
- − Repairs & maintenance
- −$2,891
- − Management
- −$2,891
- − Depreciation
- −$5,905
- Taxable income
- $9,006
- Est. tax owed @ 24.0%
- −$2,161
- After-tax cash flow
- $9,540/yr
For passive investors: Depreciation is non-cash, so a rental often shows a tax loss while cash-flowing — sheltering income. Rental losses are passive: they offset passive income freely, and up to $25,000/yr can offset ordinary (W-2) income if you actively participate and your MAGI is under $100k (phasing out to $0 by $150k); unused losses carry forward. On sale, claimed depreciation is recaptured at up to 25%, and gains may owe capital-gains tax (a 1031 exchange can defer both). Figures are a year-1 estimate at your 24.0% rate — not tax advice; consult a CPA.
Schools (NCES district)
- District
- Orleans Parish
- NCES district ID
- 2201170
- Math proficiency
- 11% ▼ -52.00%
- Reading proficiency
- 27% ▼ -46.00%
- Median HH income
- $37,011
- Composite
- 15.78/100
- National rank
- #9271
- State rank
- #69 of 98 in LA
Livability — New Orleans
- Score
- 81/100
- State rank
- #3
- US rank
- #1383
Category grades
Schools grade is shown separately in the Schools card above.
Census & demographics
- Census place
- New Orleans, LA
- County
- Orleans Parish · 338,817 people
- City population
- 338,817
- Metro
- New Orleans-Metairie, LA
- Population (ZIP)
- 23,107
- Household income
- $40,765
- Rent vs Own
- Severe rent burden
- 2030.0
Population outlook (Orleans County) Hauer SSP2
- Today (2025)
- 513,025 people
- By 2030
- 575,781 · +12.2%
- By 2040
- 700,174 · +36.5%
- By 2050
- 826,541 · +61.1%
- By 2075
- 1,123,374 · +119.0%
- By 2100
- 1,355,609 · +164.2%
Race, ethnicity, and origin ACS 2023
- Neighborhood character
- Predominantly Black (91%)
- Race & ethnicity
- Black 91% Hispanic / Latino 4% Two or more races 4% White 2%
- Common ancestry
- Lithuanian 1% Hispanic 1%
- Foreign-born
- 3% · Canada, Vietnam
- Languages at home
- 96% English-only · Spanish 2%
Political lean MEDSL · Orleans
- 2024 margin
- Solid D (+67.0) · D 82.2% · R 15.2% · Other 2.7%
- 2008→2024 swing
- +6.7pp toward D · 2008: 60.3pp · 2024: 67.0pp
- All cycles
- 2024: D+67.0 2020: D+68.2 2016: D+66.2 2012: D+62.5 2008: D+60.3
Not yet ingested
- Civics
- —
Market trends
- HPI YoY
- ▼ -72.43%
- Current HPI
- 175.4465
- Rent YoY
- —
- Metro
- New Orleans-Metairie, LA
- State GDP YoY
- ▲ 3.29%
- F500 in state
- 10
Industry mix (Fortune 500 HQ in LA)
| Industry | F500 HQs | Revenue |
|---|---|---|
| Telecommunications | 2 | $23B |
|
||
| Utilities | 1 | $12B |
|
||
| Wholesale / Distribution | 1 | $5B |
|
||
| Advertising | 1 | $2B |
|
||
Price history
+383.3% since first listed24 events — show timeline
- 2026-04-10 Pending — AcadianaMLS
- 2026-04-10 Pending — GSREIN
- 2026-04-06 Listed $203,000 GSREIN
- 2026-04-06 Listed $203,000 AcadianaMLS
- 2026-03-05 Pending — AcadianaMLS
- 2026-02-10 Price Changed $175,000 AcadianaMLS
- 2026-02-10 Price Changed $175,000 GSREIN
- 2026-01-12 Price Changed $215,000 AcadianaMLS
- 2026-01-12 Price Changed $215,000 GSREIN
- 2025-11-12 Price Changed $218,500 AcadianaMLS
- 2025-11-11 Price Changed $218,500 GSREIN
- 2025-10-10 Price Changed $220,000 AcadianaMLS
- 2025-10-10 Price Changed $220,000 GSREIN
- 2025-09-20 Price Changed $225,000 AcadianaMLS
- 2025-09-20 Price Changed $225,000 GSREIN
- 2025-08-14 Listed $230,000 AcadianaMLS
- 2025-05-09 Listed $220,000 AcadianaMLS
- 2025-03-24 Listed $245,000 AcadianaMLS
- 2022-10-24 Listed $199,999 AcadianaMLS
- 1998-12-18 Sold (Public Records) $79,000 Public Records
- 1998-12-18 Sold (MLS) $79,900 GSREIN
- 1998-06-04 Listed $79,900 GSREIN
- 1998-06-04 Listed $79,900 AcadianaMLS
- 1997-04-10 Sold (Public Records) $42,000 Public Records
Property tax history
+10.9%/yrLatest (2026): $2,256 · +1.1% YoY. Source: county tax records.
Cash-flow waterfall
monthlySold comps — $/sqft
last 12 mo · ≤1 miLoading sold comps…