2640 S Cottonwood Ln #98 · Tucson, AZ
Flood risk 1/10 · Minimal
- FEMA flood zone
- X (unshaded)
- Chance of flooding over 30 yrs
- 0.0%
- Est. flood insurance / yr
- $507 – $1,088
Fire risk 5/10 · Moderate
- Est. fire insurance / yr
- $610 – $1,132
Heat risk 8/10 · Major
- Hot days now (above 106°F)
- 7 days/yr
- Hot days in 30 yrs
- 19 days/yr
Wind risk 1/10 · Minimal
- Chance of severe wind over 30 yrs
- —
Air-quality risk 1/10 · Minimal
- Unhealthy air days now
- 0 days/yr
- Unhealthy air days in 30 yrs
- 0 days/yr
Risk factors via First Street. Map © Google.
Why this score? — see what drove the B grade
The composite is a weighted blend of 9 inputs, each scored 0–100. Each bar is that input's sub-score; the figure is the points it added to the 100-point composite (weight × sub-score).
- Cash flow +30.0/30.0
- ARV discount +15.0/15.0
- DSCR +10.0/10.0
- 1% rule +8.5/10.0
- Livability +3.7/5.0
- Condition / age +2.8/5.0
- Rent growth +2.6/5.0
- Schools +1.6/10.0
- Appreciation +0.0/10.0
$109,900
🖨 Deal sheet 📄 Offer letter ✓ Due diligence
Listing remarks
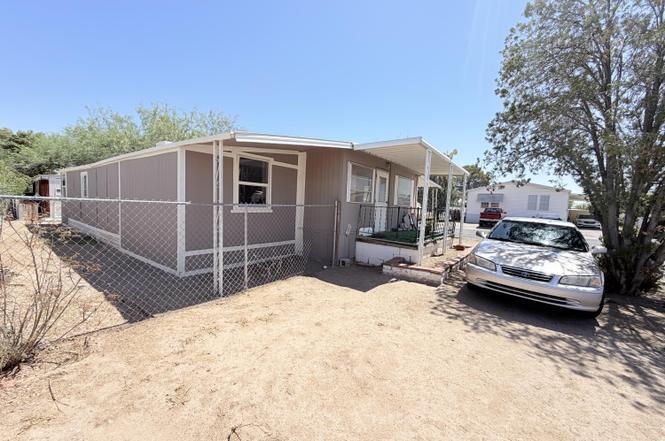
Come see this amazing land/home package deal, which sits in a quiet friendly family neighborhood. This spacious home is 1440 SQFT of well-maintained living space with 2 bedrooms, 2-bathrooms. This home features a bright and open feel. Recent updates include updated electrical and a large lot. Conveniently located near I-10, offering easy access to shopping, dining, a community garden and more. Don't miss out on this great opportunity--schedule your showing today!
Key facts
- Updated electrical
- Large lot
- Community garden
Tags
Property features AI
Finance
- Other: Zoned Tucson - MH1
- HOA & community: Community pool
Exterior
- Parking: Attached garage; 1 carport / covered space
- Utilities: Public water; Sewer connected
- Home design: Mobile home; Single-story
- Construction: Frame construction; Metal roof
- Exterior features: Covered patio; Chain link fencing; North/South exposure; Paved city-maintained road
Interior
- Kitchen: Electric range
- Flooring: Laminate flooring
- Bathrooms: 2 full bathrooms
- Heating & cooling: Forced air heating (natural gas); Central air conditioning
- Interior features: Electric range; Covered laundry room
- Laundry & utility: Laundry room
Neighborhood map
What this means for you Summary
Snapshot
- This is a 2-bed/2.0-bath manufactured listed at $110k. Condition is rated average.
Deal economics
- At list price, monthly cash flow is $414 ($5k/yr) — positive.
- The deal already cash-flows at list — no discount required.
- Meets the 1% rule at list price ($1k rent vs $110k).
- Cap rate 10.8% vs local median 3.7% in Tucson — top-decile yield for the area; either an underpriced asset or a hidden risk that comps aren't pricing in. Stress-test before assuming the spread holds.
Location & tenants
- Location reads 74/100 on livability (#17 in AZ, #4,502 nationally) — a middle-class / working-renter tenant base. Strengths: commute A+, cost of living A+, housing A+; Watch: health & safety C-, crime F, employment D-.
- Tucson Unified District (4403) (urban): math 14% / reading 23% proficiency, ranked #190 of 249 in AZ (top 76%) — low school quality limits family demand, transient renter base, plan for 1-2y turnover.
- Zoned schools: Tolson Elementary School (math 22% / reading 22%, grade F, #687 of 1,109 statewide, top 65%, 372 students, 72% FRL); Mansfeld Middle Magnet School (math 14% / reading 26%, grade F, #127 of 218 statewide, top 60%, 817 students, 60% FRL); Cholla High School (math 2% / reading 17%, grade F, #343 of 381 statewide, top 93%, 1,760 students, 62% FRL) — zoned schools at 65% FRL track the district average.
- Market conditions: Rents flat; 264 active listings in the ZIP; 20 comparable units currently listed for rent nearby; rentals at typical pace (median 24d on market — plan ~3-4 weeks tenant-placement turnaround); 45% of comp listings sitting > 30 days — soft ceiling on asking rent; 5,268 units permitted in Pima County in 2024 (996 in 5+ unit buildings).
- This rent runs 34% of the median local income ($53k/yr) — at the standard rent-burdened threshold; future hikes will face affordability resistance.
Forward outlook
- Local home prices are declining (-3.0%/yr); year-one equity from $760 of loan paydown is wiped out by about $3k of value loss. Plan a longer hold.
- Pima County population projected at +8% by 2050 — modest demand growth; plan on rents tracking national, not racing it.
Negotiation context
- Only 3 days on market — expect competitive offers; lowballing is unlikely to land.
Risks & watch-outs
- Climate carrying-cost: moderate wildfire risk; extreme-heat days projected 7→19/yr by 2055 (HVAC capex compounding) — expect insurance premiums to compound above CPI over the hold.
Questions for the listing agent
- Built in 1972 — when were the roof, HVAC, electrical panel, plumbing, and water heater last replaced?
- Is there a deadline driving the sale (1031 exchange, divorce, estate, relocation)? That informs how much negotiation room exists.
- Schools are D-rated, which usually means shorter tenancies and higher turnover. Who's the typical renter profile here, and what's been the actual vacancy rate?
- Crime grade is F in this area — have there been break-ins, vandalism, or insurance claims at this property in the last 3 years? What carrier currently insures it and at what premium?
- What's the average days-on-market for RENTAL listings here right now (not sales)? A rising rental-DOM trend means longer vacancies and softer asking-rent achievability than the comps imply.
- What's the recent tenant-quality profile in this submarket — average credit score on applications, eviction rate, late-payment / NSF rate, and stable-employment percentage? A property-management company in the area should have these aggregated.
- How much new for-sale + rental construction is in the pipeline within 1–3 miles? Heavy new supply typically softens prices + rents 12–24 months out; constrained supply supports both.
Investment metrics
- 1% rule
- 1.35% ✓
- Cap rate
- 10.82%
- Cash-on-cash
- 16.16%
- DSCR
- 1.72
- GRM
- 6.2
CMA / ARV
- ARV (on-the-fly)
- $144,000
- Comps found
- 5
Show comp detail 5 sales within ~0.75 mi
| Address | Dist | Beds/Ba | Sqft | Sold | Price | $/sf | Match |
|---|---|---|---|---|---|---|---|
| 2640 S Cottonwood Ln #63 | 0.00mi | 3/2.0 (+1) | 1,512 (+5%) | 4mo | $160,000 | $106 | 84 |
| 2640 S Cottonwood Ln #44 | 0.00mi | 3/2.0 (+1) | 1,512 (+5%) | 20mo | $151,000 | $100 | 70 |
| 2640 S Cottonwood Ln #81 | 0.00mi | 3/1.5 (+1) | 1,365 (-5%) | 22mo | $50,000 | $37 | 66 |
| 2640 S Cottonwood Ln #71 | 0.00mi | 3/2.0 (+1) | 1,238 (-14%) | 20mo | $122,795 | $99 | 55 |
| 2640 S Cottonwood Ln #94 | 0.00mi | 3/2.0 (+1) | 1,248 (-13%) | 23mo | $152,500 | $122 | 54 |
Match score weights: distance 35% · size 25% · config 20% · recency 20%. Top-matched comps best support the ARV.
Projected returns pro-forma
-3.0% appreciation · 0.21% rent growth · sell at horizon
- IRR
- 4.0%
- Equity multiple
- 1.15×
- Total profit
- $4,554
- Equity at exit
- $16,386
- IRR
- 10.7%
- Equity multiple
- 1.72×
- Total profit
- $22,299
- Equity at exit
- $9,502
Cash invested: $30,772 (down + closing). Projections, not guarantees.
Landlord ↔ Tenant lean methodology
- Overall (STATE)
- 87 Strongly Landlord-Friendly
- State Arizona
- 87 Strongly Landlord-Friendly · R+3
- County
- — inherits STATE
- City
- — inherits STATE
ZIP-level market 85713
- Home prices YoY
- -24.5%
- Rents YoY
- 0.2%
- Active inventory
- 264
- Price-to-rent
- 6.2×
Monthly cashflow live
- Estimated rent
- $1,486 high interval (Pro) →
- Mortgage (P&I)
- −$576
- Tax est. 1.5%
- −$137 /mo · $1,648/yr
- Insurance
- −$46
- HOA
- −$0
- Vacancy / Maint / Mgmt
- −$312
- Net cashflow
- $414
Break-even live
UW: 25.0% down · 7.5% · 30yr · 1.5% tax · 5.0% vac · 8.0% maint · 8.0% mgmt
Financing live
Cash to close
- Down payment
- $27,475
- Closing costs
- $3,297
- Reserves months
- —
- Total cash needed
- —
Loan-product check · same deal, 3 products live
Conventional
25% down · 7.5% · 30yr
- Down + closing
- —
- Monthly P&I
- —
- Monthly cashflow
- —
- DSCR
- —
- Eligible?
- —
Personal DTI + credit; lowest rate.
DSCR
20% down · 8.5% · 30yr
- Down + closing
- —
- Monthly P&I
- —
- Monthly cashflow
- —
- DSCR
- —
- Eligible?
- —
No personal income docs; deal must DSCR.
Hard money
10% down · 12.0% · 12mo
- Down + closing
- —
- Monthly P&I
- —
- Monthly cashflow
- —
- DSCR
- —
- Eligible?
- —
Short-term bridge; refi at stabilization.
Rent comps 20 comps
| Address | Beds | Baths | Sqft | Rent | $/sqft | DOM | Units | Dist |
|---|---|---|---|---|---|---|---|---|
| 2640 S Cottonwood Ln Unit 13 Tucson, AZ | 3.0 | 2.0 | 1200 | $1,395 | $1.16 | 44d | 1 | 0.03mi |
| 1325 W Silverlake Rd Tucson, AZ | 2.0–3.0 | 2.0 | 990 | $1,400 | $1.41 | 11d | 2 | 0.48mi |
| 2410 S Mission Rd Tucson, AZ | 3.0 | 1.0–2.0 | 620 | $1,175 | $1.90 | 44d | 10 | 0.58mi |
| 2800 S Mission Rd Tucson, AZ | 3.0 | 1.0–2.0 | 663 | $1,252 | $1.89 | 1d | 23 | 0.62mi |
| 1808 W Caravelle Rd Tucson, AZ | 2.0 | 2.0 | 1260 | $1,395 | $1.11 | 44d | 1 | 0.77mi |
| 3655 S San Rafael Pl Tucson, AZ | 3.0 | 1.0 | 1204 | $1,650 | $1.37 | 44d | 1 | 0.97mi |
| 3420 S Clark Ave Tucson, AZ | 3.0 | 2.0 | 1100 | $1,495 | $1.36 | 11d | 1 | 0.98mi |
| 4050 S Kostka Ave Tucson, AZ | 3.0 | 1.0 | 1568 | $1,895 | $1.21 | 1d | 1 | 1.08mi |
| 3450 S Liberty Ave Unit 2 Tucson, AZ | 3.0 | 2.0 | 950 | $1,475 | $1.55 | 44d | 1 | 1.11mi |
| 251 W 38th St Tucson, AZ | 3.0 | 2.0 | 1050 | $1,700 | $1.62 | 44d | 1 | 1.13mi |
| 251 W 38th St Tucson, AZ | 3.0 | 2.0 | 1050 | $1,800 | $1.71 | 14d | 1 | 1.13mi |
| 1754 W Pueblo Vista Blvd Tucson, AZ | 3.0 | 3.0 | 1206 | $1,705 | $1.41 | 20d | 1 | 1.15mi |
| 920 W Starr Pass Blvd Tucson, AZ | 3.0 | 2.0 | 1362 | $1,895 | $1.39 | 44d | 1 | 1.17mi |
| 425 W 26th St Tucson, AZ | 3.0 | 2.0 | 1250 | $1,450 | $1.16 | 44d | 1 | 1.20mi |
| 3638 S 9th Ave Tucson, AZ | 3.0 | 1.0 | 945 | $1,600 | $1.69 | 3d | 1 | 1.33mi |
| 135 W 26th St Tucson, AZ | 3.0 | 2.0 | 1700 | $2,450 | $1.44 | 44d | 1 | 1.40mi |
| 3917 S Liberty Ave Tucson, AZ | 3.0 | 2.0 | 1044 | $1,590 | $1.52 | 3d | 1 | 1.44mi |
| 202 E 32nd St Tucson, AZ | 3.0 | 1.0 | 1251 | $1,599 | $1.28 | 23d | 1 | 1.47mi |
| 202 E 32nd St Tucson, AZ | 3.0 | 1.0 | 1251 | $1,599 | $1.28 | 2d | 1 | 1.47mi |
| 1314 S 8th Ave Unit 1515896P Tucson, AZ | 3.0 | 2.0 | 1496 | $4,852 | $3.24 | 3d | 1 | 1.49mi |
Listing history 5 events
-
2026-06-18price $109,900 Active 3 DOM
-
2026-06-18days on market $119,000 Active 3 DOM
-
2026-06-17days on market $119,000 Active 2 DOM
-
2026-06-15remarks 467-char remark
-
2026-06-15$119,000 Active 1 DOM
ⓘ Source: listings_history table (triggers on properties + properties_extension) + one-shot
backfill from property_details.listing_events for pre-trigger history.
Climate risk First Street
- Flood 1/10 Low FEMA zone X (unshaded) · 0% chance over 30 yrs
- Wildfire 5/10 Major
- Heat 8/10 Severe 7 d/yr ≥106°F today · 19 d/yr by 30 yrs out
- Wind 1/10 Low
- Air quality 1/10 Low 0 unhealthy d/yr today · 0 by 30 yrs out
Nearby sold comps map
Loading sold comps map…
Walkable amenities ~0.75 mi
Loading nearby amenities…
Taxation est. · year 1
- Rental income
- $17,832
- − Mortgage interest
- −$6,156
- − Property taxes
- −$1,648
- − Insurance
- −$550
- − Repairs & maintenance
- −$1,427
- − Management
- −$1,427
- − Depreciation
- −$3,197
- Taxable income
- $3,428
- Est. tax owed @ 24.0%
- −$823
- After-tax cash flow
- $4,151/yr
For passive investors: Depreciation is non-cash, so a rental often shows a tax loss while cash-flowing — sheltering income. Rental losses are passive: they offset passive income freely, and up to $25,000/yr can offset ordinary (W-2) income if you actively participate and your MAGI is under $100k (phasing out to $0 by $150k); unused losses carry forward. On sale, claimed depreciation is recaptured at up to 25%, and gains may owe capital-gains tax (a 1031 exchange can defer both). Figures are a year-1 estimate at your 24.0% rate — not tax advice; consult a CPA.
Condition & rehab AI · 12 photos
This home requires moderate repairs and maintenance, with updates to paint, landscaping, and appliances to increase its resale and rental value.
Repairs flagged
- Minor Kitchen appliances — Older appliances may need replacement.
- Minor Paint touch-up — Paint appears to be in good condition, but may need touch-up.
- Minor Landscaping — Landscaping could benefit from some updates to enhance curb appeal.
Value-add opportunities
- Resale Paint touch-up — Enhances the home's appearance and can be done quickly.
- Rental Landscaping — Improves curb appeal and can attract tenants.
- Both New kitchen appliances — Enhances the home's appeal and can be done in phases.
Renovation cost estimate screening
| Repair item | Severity | Est. cost |
|---|---|---|
| Kitchen appliances · Older appliances may need replacement. | Minor | $500–3,000 |
| Paint touch-up · Paint appears to be in good condition, but may need touch-up. | Minor | $500–3,000 |
| Landscaping · Landscaping could benefit from some updates to enhance curb appeal. | Minor | $500–3,000 |
| Total estimated repair cost · 3 items | $1,500–9,000 |
Value-add ROI direction
- Resale Paint touch-up — Enhances the home's appearance and can be done quickly. ↑
- Rental Landscaping — Improves curb appeal and can attract tenants. ↑
- Both New kitchen appliances — Enhances the home's appeal and can be done in phases. ↑
ⓘ Cost ranges are severity-bucket heuristics (US national rule-of-thumb). Get contractor quotes + a written scope before underwriting a rehab budget.
Schools (NCES district)
- District
- Tucson Unified District (4403)
- NCES district ID
- 0408800
- Math proficiency
- 14% ▼ -17.00%
- Reading proficiency
- 23% ▼ -11.00%
- Median HH income
- $40,962
- Composite
- 15.78/100
- National rank
- #9270
- State rank
- #190 of 249 in AZ
Livability — Tucson
- Score
- 74/100
- State rank
- #17
- US rank
- #4502
Category grades
Schools grade is shown separately in the Schools card above.
Census & demographics
- Census place
- Tucson, AZ
- County
- Pima County · 1,012,107 people
- City population
- 839,336
- Metro
- Tucson, AZ
- Population (ZIP)
- 46,439
- Household income
- $53,152
- Rent vs Own
- Severe rent burden
- 1517.0
Population outlook (Pima County) Hauer SSP2
- Today (2025)
- 1,066,056 people
- By 2030
- 1,086,684 · +1.9%
- By 2040
- 1,117,160 · +4.8%
- By 2050
- 1,149,778 · +7.9%
- By 2075
- 1,271,480 · +19.3%
- By 2100
- 1,321,160 · +23.9%
Race, ethnicity, and origin ACS 2023
- Neighborhood character
- Predominantly Hispanic (70%)
- Race & ethnicity
- Hispanic / Latino 70% Two or more races 30% White 21% Native American 5% Black 3% Asian 1%
- Hispanic origin (detail)
- Mexican 67%
- Common ancestry
- Italian 1% Lithuanian 1% Portuguese 1%
- Foreign-born
- 19% · Canada, China
- Languages at home
- 49% English-only · Spanish 49%
Political lean MEDSL · Pima
- 2024 margin
- D (+15.2) · D 57.0% · R 41.8% · Other 1.2%
- 2008→2024 swing
- +9.1pp toward D · 2008: 6.1pp · 2024: 15.2pp
- All cycles
- 2024: D+15.2 2020: D+18.7 2016: D+13.5 2012: D+5.8 2008: D+6.1
Not yet ingested
- Civics
- —
Market trends
- HPI YoY
- ▼ -107.07%
- Current HPI
- 329.8338
- Rent YoY
- ▲ 0.21%
- Metro
- Tucson, AZ
- State GDP YoY
- ▲ 4.54%
- F500 in state
- 20
Industry mix (Fortune 500 HQ in AZ)
| Industry | F500 HQs | Revenue |
|---|---|---|
| Technology | 2 | $13B |
|
||
| Mining / Metals | 1 | $23B |
|
||
| Environmental Services | 1 | $16B |
|
||
| Metals / Steel | 1 | $14B |
|
||
| Technology Distribution | 1 | $9B |
|
||
| Homebuilding | 1 | $8B |
|
||
Price history
1 event — show timeline
- 2026-06-15 Listed $119,000 MLSSAZ
Cash-flow waterfall
monthlySold comps — $/sqft
last 12 mo · ≤1 miLoading sold comps…