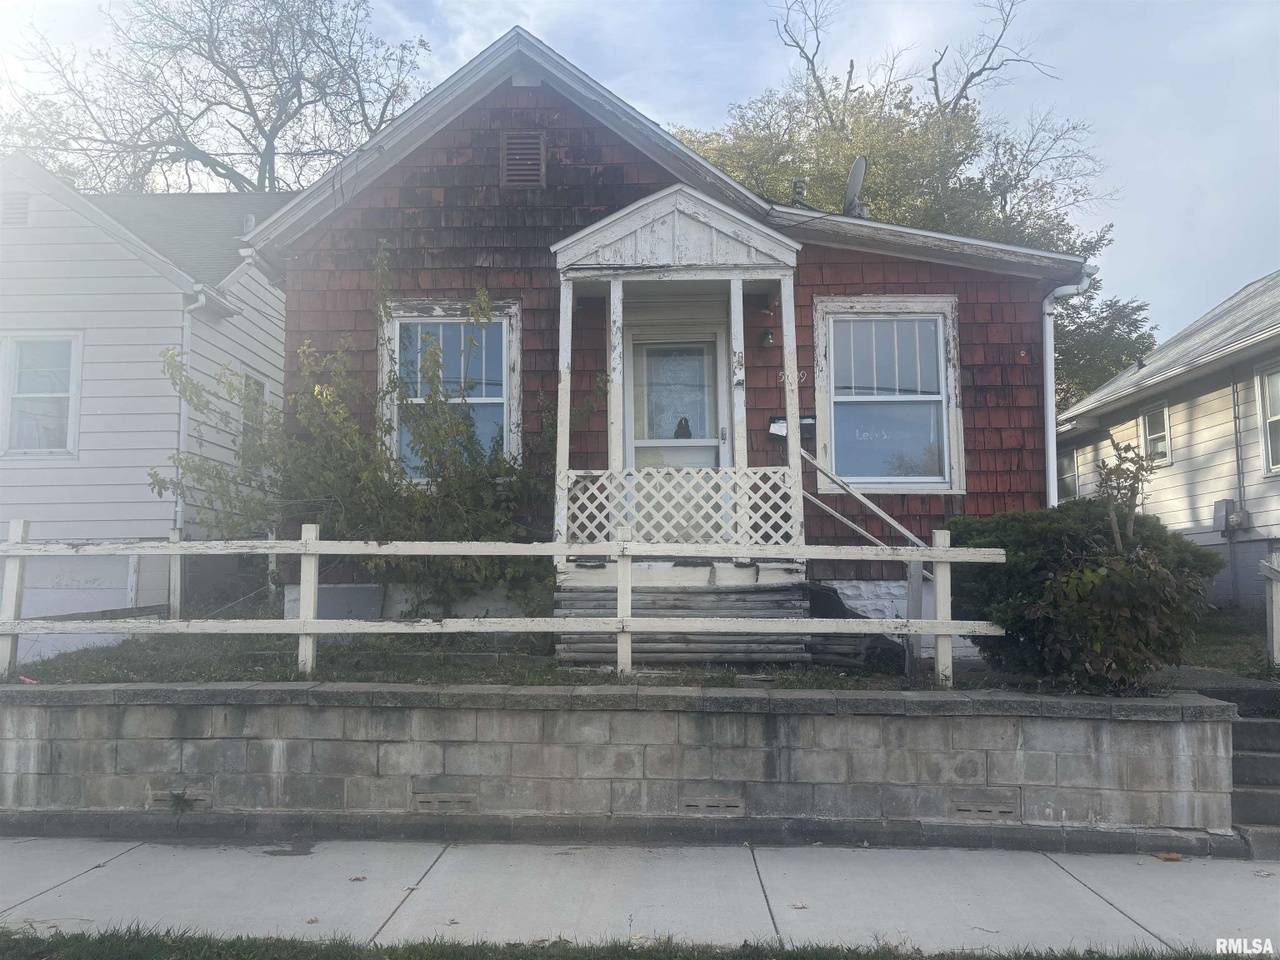
5809 S Adams St · Bartonville, IL
Flood risk 1/10 · Minimal
- FEMA flood zone
- X
- Chance of flooding over 30 yrs
- 0.0%
- Est. flood insurance / yr
- $473 – $860
Fire risk 1/10 · Minimal
- Est. fire insurance / yr
- $804 – $1,492
Heat risk 3/10 · Minor
- Hot days now (above 105°F)
- 7 days/yr
- Hot days in 30 yrs
- 18 days/yr
Wind risk 2/10 · Minimal
- Chance of severe wind over 30 yrs
- 1.0%
Air-quality risk 3/10 · Minor
- Unhealthy air days now
- 1 days/yr
- Unhealthy air days in 30 yrs
- 3 days/yr
Risk factors via First Street. Map © Google.
Why this score? — see what drove the B+ grade
The composite is a weighted blend of 9 inputs, each scored 0–100. Each bar is that input's sub-score; the figure is the points it added to the 100-point composite (weight × sub-score).
- Cash flow +30.0/30.0
- ARV discount +15.0/15.0
- 1% rule +10.0/10.0
- DSCR +10.0/10.0
- Livability +3.1/5.0
- Schools +2.9/10.0
- Rent growth +2.5/5.0
- Condition / age +2.5/5.0
- Appreciation +0.0/10.0
$43,900
🖨 Deal sheet 📄 Offer letter ✓ Due diligence
Listing remarks MLS
3 POSSIBLE 4 BEDROOM (2 NO CLOSETS), 1 BATH BUNGALOW FIXER UPPER SOLD "AS-IS" * APPLIANCES STOVE & REFRIDGE STAY, NOT WARRANTED * BACK ENTRANCE TO YARD ON HILLS STREET PLENTY ROOM FOR GARAGE OR OUTSIDE PARKING * HARDWOOD FLOORS UNDER CARPETS * 4TH BEDROOM COULD BE FAMILY ROOM *
Key facts
- 6,098 sq ft lot
- Built 1960
- Listed 221 days
Property features AI
Finance
- Other: Property located across the street from the post office; Subdivision: Hills
- HOA & community: No association fee
Exterior
- Parking: On-street parking (no garage)
- Utilities: Public water; Public sewer
- Home design: Single family residence; 1-story (includes additional, upper and lower levels and basement)
- Construction: Built in 1960
- Exterior features: Terraced/sloping lot; Other lot features; Shingle roof
Interior
- Kitchen: Kitchen (vinyl flooring)
- Bedrooms: 3 bedrooms (main level)
- Flooring: Carpet in bedrooms; Vinyl in kitchen
- Bathrooms: 1 full bathroom
- Heating & cooling: Forced air heating
- Interior features: Attic storage; Full unfinished basement
Neighborhood map
What this means for you Summary
Snapshot
- This is a 2-bed/1.0-bath single-family listed at $44k.
Deal economics
- At list price, monthly cash flow is $373 ($4k/yr) — positive.
- The deal already cash-flows at list — no discount required.
- Meets the 1% rule at list price ($951 rent vs $44k).
- Recommended offer: $39k (12.0% below list) — sets the bar for market timing.
- Cap rate 16.5% vs local median 3.6% in Bartonville — top-decile yield for the area; either an underpriced asset or a hidden risk that comps aren't pricing in. Stress-test before assuming the spread holds.
Location & tenants
- Location reads 62/100 on livability (#840 in IL) — a middle-class / working-renter tenant base. Strengths: cost of living A+, housing A+; Watch: crime D+, amenities F, commute F.
- Limestone Chsd 310 (rural): math 25% / reading 35% proficiency, ranked #486 of 919 in IL (top 53%) — families likely to look elsewhere, expect single-tenant / working-renter base with shorter leases.
- Zoned schools: Limestone Community High School (math 17% / reading 22%, grade F, #397 of 693 statewide, top 61%, 924 students, 0% FRL).
- Market conditions: 51 active listings in the ZIP; 4 comparable units currently listed for rent nearby; rentals at typical pace (median 21d on market — plan ~3-4 weeks tenant-placement turnaround); 73 units permitted in Peoria County in 2024 (0 in 5+ unit buildings).
Forward outlook
- Local home prices are declining (-3.0%/yr); year-one equity from $304 of loan paydown is wiped out by about $1k of value loss. Plan a longer hold.
- Peoria County population projected at -11% by 2050 — secular population decline; favor cash flow + early exit over multi-decade hold.
- At projected returns (-3.0% appreciation + 3.0% rent growth), your $12k cash investment doubles in ~4 years — after that, you're playing with house money.
Negotiation context
- It's been on market 221 days — a 12% lower offer ($39k) is reasonable based on typical stale-listing flexibility.
- 2 sale attempts since 27y ago; this cycle's ask has dropped $6k (12%) from the opening price — seller is motivated, your offer sets the floor, not the list.
- Current owner paid $34k; 29% above their basis — modest negotiation headroom, anchor on the comps not their cost.
Risks & watch-outs
- Watch-outs: property tax is 3.5% of price.
Questions for the listing agent
- It's been on market 221 days. Have you received any prior offers? Is the seller open to a 12% concession, seller financing, or rate buy-down credit?
- Built in 1960 — when were the roof, HVAC, electrical panel, plumbing, and water heater last replaced?
- Property tax is high relative to price — has the assessment been appealed recently, and will the sale trigger a re-assessment?
- Why hasn't it sold? Are there any deal-killer items the seller is aware of (foundation, flood, title, zoning, code violations)?
- Is there a deadline driving the sale (1031 exchange, divorce, estate, relocation)? That informs how much negotiation room exists.
- Schools are D-rated, which usually means shorter tenancies and higher turnover. Who's the typical renter profile here, and what's been the actual vacancy rate?
- Crime grade is D in this area — have there been break-ins, vandalism, or insurance claims at this property in the last 3 years? What carrier currently insures it and at what premium?
- What's the average days-on-market for RENTAL listings here right now (not sales)? A rising rental-DOM trend means longer vacancies and softer asking-rent achievability than the comps imply.
- What's the recent tenant-quality profile in this submarket — average credit score on applications, eviction rate, late-payment / NSF rate, and stable-employment percentage? A property-management company in the area should have these aggregated.
- How much new for-sale + rental construction is in the pipeline within 1–3 miles? Heavy new supply typically softens prices + rents 12–24 months out; constrained supply supports both.
Investment metrics
- 1% rule
- 2.17% ✓
- Cap rate
- 16.50%
- Cash-on-cash
- 36.44%
- DSCR
- 2.62
- GRM
- 3.8
CMA / ARV
- ARV (on-the-fly)
- $54,240
- Comps found
- 12
Show comp detail 12 sales within ~0.75 mi
| Address | Dist | Beds/Ba | Sqft | Sold | Price | $/sf | Match |
|---|---|---|---|---|---|---|---|
| 601 W Franklin Ave | 0.47mi | 2/2.0 | 882 (-2%) | 1mo | $46,000 | $52 | 69 |
| 426 W Garfield Ave | 0.45mi | 2/1.0 | 908 (+0%) | 12mo | $80,000 | $88 | 68 |
| 104 Lawndale Ave | 0.55mi | 2/1.0 | 866 (-4%) | 2mo | $60,000 | $69 | 66 |
| 204 Harrison St | 0.30mi | 2/1.0 | 972 (+8%) | 11mo | $25,500 | $26 | 65 |
| 323 Buena Vista St | 0.39mi | 2/1.0 | 804 (-11%) | 2mo | $45,000 | $56 | 62 |
| 225 Collier Ave | 0.44mi | 2/1.0 | 980 (+8%) | 9mo | $96,000 | $98 | 58 |
| 118 W Mcclure Ave | 0.29mi | 2/1.5 | 836 (-8%) | 18mo | $50,000 | $60 | 57 |
| 504 W Franklin Ave | 0.46mi | 1/1.0 (-1) | 880 (-3%) | 15mo | $32,500 | $37 | 57 |
| 210 Anna St | 0.66mi | 2/1.0 | 910 (+1%) | 17mo | $83,500 | $92 | 54 |
| 6324 S Adams St | 0.45mi | 1/1.0 (-1) | 977 (+8%) | 8mo | $25,700 | $26 | 54 |
| 4 Alexander Ln | 0.48mi | 2/1.0 | 988 (+9%) | 11mo | $145,000 | $147 | 53 |
| 206 S Bellevue Ave | 0.33mi | 2/1.0 | 1,002 (+11%) | 20mo | $50,000 | $50 | 50 |
Match score weights: distance 35% · size 25% · config 20% · recency 20%. Top-matched comps best support the ARV.
Projected returns pro-forma
-3.0% appreciation · 3.0% rent growth · sell at horizon
- IRR
- 32.3%
- Equity multiple
- 2.36×
- Total profit
- $16,723
- Equity at exit
- $6,546
- IRR
- 39.4%
- Equity multiple
- 4.70×
- Total profit
- $45,422
- Equity at exit
- $3,796
Cash invested: $12,292 (down + closing). Projections, not guarantees.
Landlord ↔ Tenant lean methodology
- Overall (STATE)
- 43 Moderately Tenant-Leaning
- State Illinois
- 43 Moderately Tenant-Leaning · D+7
- County
- — inherits STATE
- City
- — inherits STATE
ZIP-level market 61607
- Home prices YoY
- -27.1%
- Active inventory
- 51
- Price-to-rent
- 3.8×
Monthly cashflow live
- Estimated rent
- $951 medium interval (Pro) →
- Mortgage (P&I)
- −$230
- Tax from tax record
- −$129 /mo · $1,551/yr
- Insurance
- −$18
- HOA
- −$0
- Vacancy / Maint / Mgmt
- −$200
- Net cashflow
- $373
Break-even live
UW: 25.0% down · 7.5% · 30yr · 1.5% tax · 5.0% vac · 8.0% maint · 8.0% mgmt
Financing live
Cash to close
- Down payment
- $10,975
- Closing costs
- $1,317
- Reserves months
- —
- Total cash needed
- —
Loan-product check · same deal, 3 products live
Conventional
25% down · 7.5% · 30yr
- Down + closing
- —
- Monthly P&I
- —
- Monthly cashflow
- —
- DSCR
- —
- Eligible?
- —
Personal DTI + credit; lowest rate.
DSCR
20% down · 8.5% · 30yr
- Down + closing
- —
- Monthly P&I
- —
- Monthly cashflow
- —
- DSCR
- —
- Eligible?
- —
No personal income docs; deal must DSCR.
Hard money
10% down · 12.0% · 12mo
- Down + closing
- —
- Monthly P&I
- —
- Monthly cashflow
- —
- DSCR
- —
- Eligible?
- —
Short-term bridge; refi at stabilization.
Rent comps 4 comps
| Address | Beds | Baths | Sqft | Rent | $/sqft | DOM | Units | Dist |
|---|---|---|---|---|---|---|---|---|
| 5817 S Adams St Bartonville, IL | 2.0 | 1.0 | 768 | $975 | $1.27 | 13d | 1 | 0.04mi |
| 2807 W Nevada St Peoria, IL | 1.0 | 1.0 | 540 | $629 | $1.16 | 20d | 1 | 0.94mi |
| 2916 W Meidroth St Peoria, IL | 2.0 | 1.0 | 1125 | $1,049 | $0.93 | 20d | 1 | 1.04mi |
| 1825 S Kneer Ave Peoria, IL | 2.0 | 1.0 | 858 | $858 | $1.00 | 13d | 1 | 1.14mi |
Listing history 18 events
-
2026-06-15days on market $43,900 Active 221 DOM
-
2026-06-14days on market $43,900 Active 219 DOM
-
2026-06-13days on market $43,900 Active 218 DOM
-
2026-06-10days on market $43,900 Active 216 DOM
-
2026-06-09days on market $43,900 Active 215 DOM
-
2026-06-08days on market $43,900 Active 214 DOM
-
2026-06-07days on market $43,900 Active 213 DOM
-
2026-06-03days on market $43,900 Active 209 DOM
-
2026-06-02days on market $43,900 Active 208 DOM
-
2026-06-01days on market $43,900 Active 207 DOM
-
2026-05-31days on market $43,900 Active 206 DOM
-
2026-05-30days on market $43,900 Active 205 DOM
-
2026-03-23price $43,900
-
2025-11-06$50,000 Active
-
2007-10-12soldstatus $34,000
-
2000-02-14soldstatus $30,000
-
2000-02-11soldstatus $30,000 292-char remark
Show marketing remark (292 chars)
3 POSSIBLE 4 BEDROOM (2 NO CLOSETS), 1 BATH BUNGALOW FIXER UPPER SOLD "AS-IS" * APPLIANCES STOVE & REFRIDGE STAY, NOT WARRANTED * BACK ENTRANCE TO YARD ON HILLS STREET PLENTY ROOM FOR GARAGE OR OUTSIDE PARKING * HARDWOOD FLOORS UNDER CARPETS * 4TH BEDROOM COULD BE FAMILY ROOM *
-
1999-07-16$35,000 292-char remark
Show marketing remark (292 chars)
3 POSSIBLE 4 BEDROOM (2 NO CLOSETS), 1 BATH BUNGALOW FIXER UPPER SOLD "AS-IS" * APPLIANCES STOVE & REFRIDGE STAY, NOT WARRANTED * BACK ENTRANCE TO YARD ON HILLS STREET PLENTY ROOM FOR GARAGE OR OUTSIDE PARKING * HARDWOOD FLOORS UNDER CARPETS * 4TH BEDROOM COULD BE FAMILY ROOM *
ⓘ Source: listings_history table (triggers on properties + properties_extension) + one-shot
backfill from property_details.listing_events for pre-trigger history.
Tax reassessment forecast IL · Partial reset (capped growth)
- Current annual tax
- $1,551 · $129/mo
- Projected year-2 tax
- $1,551 · $129/mo
- Expected delta
- $0/yr ($0/mo · 0.0%)
ⓘ Screening estimate from a state-policy table — verify with the county assessor before closing.
Climate risk First Street
- Flood 1/10 Low FEMA zone X · 0% chance over 30 yrs
- Wildfire 1/10 Low
- Heat 3/10 Moderate 7 d/yr ≥105°F today · 18 d/yr by 30 yrs out
- Wind 2/10 Low 100% chance of damaging wind over 30 yrs
- Air quality 3/10 Moderate 1 unhealthy d/yr today · 3 by 30 yrs out
Nearby sold comps map
Loading sold comps map…
Walkable amenities ~0.75 mi
Loading nearby amenities…
Taxation est. · year 1
- Rental income
- $11,409
- − Mortgage interest
- −$2,459
- − Property taxes
- −$1,551
- − Insurance
- −$220
- − Repairs & maintenance
- −$913
- − Management
- −$913
- − Depreciation
- −$1,277
- Taxable income
- $4,077
- Est. tax owed @ 24.0%
- −$978
- After-tax cash flow
- $3,501/yr
For passive investors: Depreciation is non-cash, so a rental often shows a tax loss while cash-flowing — sheltering income. Rental losses are passive: they offset passive income freely, and up to $25,000/yr can offset ordinary (W-2) income if you actively participate and your MAGI is under $100k (phasing out to $0 by $150k); unused losses carry forward. On sale, claimed depreciation is recaptured at up to 25%, and gains may owe capital-gains tax (a 1031 exchange can defer both). Figures are a year-1 estimate at your 24.0% rate — not tax advice; consult a CPA.
Schools (NCES district)
- District
- Limestone Chsd 310
- NCES district ID
- 1722950
- Math proficiency
- 25% ▲ 5.00%
- Reading proficiency
- 35% ▲ 4.00%
- Median HH income
- $49,759
- Composite
- 28.99/100
- National rank
- #11932
- State rank
- #486 of 919 in IL
Livability — Bartonville
- Score
- 62/100
- State rank
- #840
- US rank
- #16553
Category grades
Schools grade is shown separately in the Schools card above.
Census & demographics
- Census place
- Bartonville, IL
- Population (ZIP)
- 10,734
Population outlook (Peoria County) Hauer SSP2
- Today (2025)
- 183,007 people
- By 2030
- 179,643 · -1.8%
- By 2040
- 171,782 · -6.1%
- By 2050
- 163,508 · -10.7%
- By 2075
- 140,178 · -23.4%
- By 2100
- 114,493 · -37.4%
Race, ethnicity, and origin ACS 2023
- Neighborhood character
- Predominantly White (91%)
- Race & ethnicity
- White 91% Two or more races 4% Black 2% Hispanic / Latino 2% Asian 2%
- Common ancestry
- Romanian 2% Italian 2% Portuguese 2%
- Foreign-born
- 1%
- Languages at home
- 98% English-only · Vietnamese 1% Tagalog/Filipino 1%
Political lean MEDSL · Peoria
- 2024 margin
- Toss-up / Even · D 51.5% · R 46.9% · Other 1.6%
- 2008→2024 swing
- -9.2pp toward R · 2008: 13.9pp · 2024: 4.7pp
- All cycles
- 2024: D+4.7 2020: D+6.3 2016: D+2.8 2012: D+4.4 2008: D+13.9
Not yet ingested
- Civics
- —
Market trends
- HPI YoY
- ▼ -71.81%
- Current HPI
- 193.6234
- Rent YoY
- —
- Metro
- —
- State GDP YoY
- ▲ 1.59%
- F500 in state
- 60
Industry mix (Fortune 500 HQ in IL)
| Industry | F500 HQs | Revenue |
|---|---|---|
| Insurance | 4 | $201B |
|
||
| Consumer Goods | 4 | $87B |
|
||
| Industrial Machinery | 3 | $64B |
|
||
| Healthcare | 2 | $55B |
|
||
| Retail / Pharmacy | 1 | $148B |
|
||
| Agriculture / Food | 1 | $86B |
|
||
Price history
+25.4% since first listed6 events — show timeline
- 2026-03-23 Price Changed $43,900 RMLSA as Distributed by MLS Grid
- 2025-11-06 Listed $50,000 RMLSA as Distributed by MLS Grid
- 2007-10-12 Sold (Public Records) $34,000 Public Records
- 2000-02-14 Sold (Public Records) $30,000 Public Records
- 2000-02-11 Sold (MLS) $30,000 RMLSA as Distributed by MLS Grid
- 1999-07-16 Listed $35,000 RMLSA as Distributed by MLS Grid
Property tax history
+7.5%/yrLatest (2024): $1,551 · +81.8% YoY. Source: county tax records.
Cash-flow waterfall
monthlySold comps — $/sqft
last 12 mo · ≤1 miLoading sold comps…