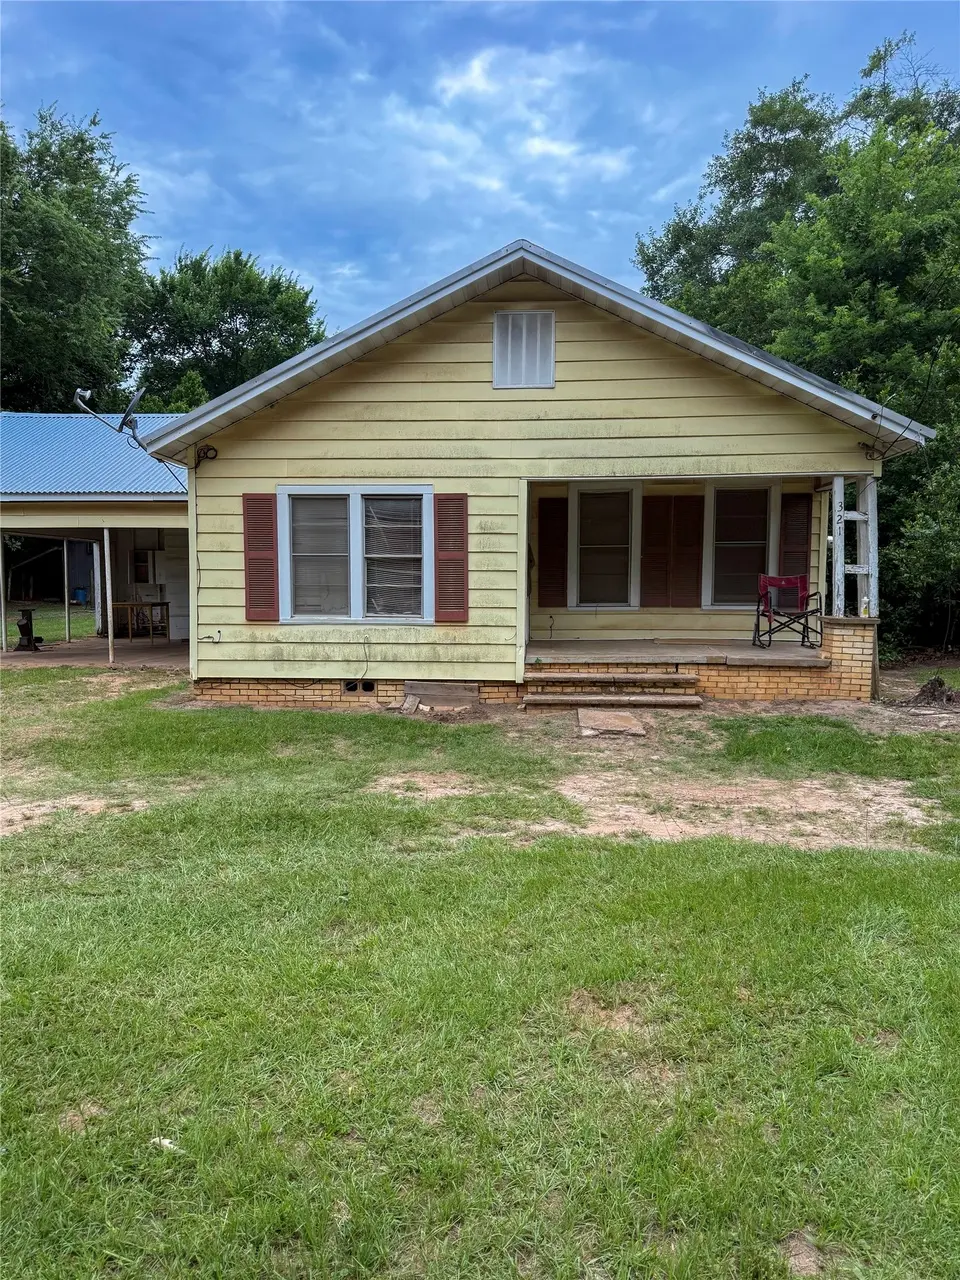
321 Sycamore St · Grapeland, TX
Flood risk 1/10 · Minimal
- FEMA flood zone
- X (unshaded)
- Chance of flooding over 30 yrs
- 0.0%
- Est. flood insurance / yr
- $507 – $1,088
Fire risk 5/10 · Moderate
- Est. fire insurance / yr
- $1,222 – $2,270
Heat risk 7/10 · Major
- Hot days now (above 110°F)
- 7 days/yr
- Hot days in 30 yrs
- 26 days/yr
Wind risk 8/10 · Major
- Chance of severe wind over 30 yrs
- 80.0%
Air-quality risk 1/10 · Minimal
- Unhealthy air days now
- 0 days/yr
- Unhealthy air days in 30 yrs
- 0 days/yr
Risk factors via First Street. Map © Google.
Why this score? — see what drove the B grade
The composite is a weighted blend of 9 inputs, each scored 0–100. Each bar is that input's sub-score; the figure is the points it added to the 100-point composite (weight × sub-score).
- Cash flow +30.0/30.0
- DSCR +10.0/10.0
- 1% rule +8.8/10.0
- ARV discount +7.5/15.0
- Appreciation +6.9/10.0
- Livability +3.5/5.0
- Schools +2.6/10.0
- Rent growth +2.5/5.0
- Condition / age +2.5/5.0
$62,000
🖨 Deal sheet 📄 Offer letter ✓ Due diligence
Listing remarks
A charming property in the heart of Grapeland, Texas, offering a wonderful opportunity for anyone looking to enjoy small-town living with room to grow. This inviting 2-bedroom, 1-bath home sits on approximately 0.344-acre lot, providing mature trees, and plenty of outdoor space to make your own. Whether you’re a first-time buyer, someone looking to downsize, or an investor seeking a property with long-term potential, this home delivers a foundation with endless possibilities. This property is being offered as-is, giving you the freedom to shape it exactly the way you want. With its spacious lot, welcoming layout, and excellent location, this Grapeland home is full of promise and ready
Key facts
- Spacious lot
- Outdoor space
- Excellent location
Tags
Property features AI
Exterior
- Parking: Garage (1 car)
- Utilities: Public water; Public sewer
- Home design: Residential property; One-story; Built in 1940; Pier/pillar/post foundation
- Construction: Wood siding; Composition roof
- Exterior features: Lot features: Other
Interior
- Kitchen: Gas cooktop
- Bedrooms: 2 bedrooms (both on the first floor)
- Bathrooms: 1 full bathroom
- Interior features: Gas cooktop
Neighborhood map
What this means for you Summary
Snapshot
- This is a 2-bed/1.0-bath single-family listed at $62k.
Deal economics
- At list price, monthly cash flow is $245 ($3k/yr) — positive.
- The deal already cash-flows at list — no discount required.
- Meets the 1% rule at list price ($853 rent vs $62k).
- Recommended offer: $61k (1.5% below list) — sets the bar for market timing.
- Cap rate 11.0% vs local median 1.1% in Grapeland — top-decile yield for the area; either an underpriced asset or a hidden risk that comps aren't pricing in. Stress-test before assuming the spread holds.
Location & tenants
- Location reads 69/100 on livability (#427 in TX) — a middle-class / working-renter tenant base. Strengths: crime A+, cost of living A+, housing A+; Watch: amenities F, commute F, employment D-.
- Grapeland ISD (rural): math 28% / reading 35% proficiency, ranked #613 of 826 in TX (top 74%) — families likely to look elsewhere, expect single-tenant / working-renter base with shorter leases.
- Zoned schools: Grapeland El (math 32% / reading 32%, grade F, #2,268 of 4,322 statewide, top 55%, 310 students, 63% FRL); Grapeland H S (math 15% / reading 54%, grade F, #959 of 1,632 statewide, top 59%, 168 students, 62% FRL) — zoned schools at 63% FRL track the district average.
- Market conditions: 133 active listings in the ZIP; 3 units permitted in Houston County in 2024 (0 in 5+ unit buildings).
Forward outlook
- In year one you build about $3k of equity ($429 loan paydown + $2k appreciation (3.8% local appreciation)).
- Houston County population projected at -16% by 2050 — secular population decline; favor cash flow + early exit over multi-decade hold.
- At projected returns (3.8% appreciation + 3.0% rent growth), your $17k cash investment doubles in ~3 years — after that, you're playing with house money.
Negotiation context
- It's been on market 23 days — a 2% lower offer ($61k) is reasonable based on typical stale-listing flexibility.
Risks & watch-outs
- Watch-outs: built in 1940 — expect roof / HVAC / electrical / plumbing capex.
- Climate carrying-cost: severe wind risk, 80% chance of damaging wind over 30y; moderate wildfire risk; extreme-heat days projected 7→26/yr by 2055 (HVAC capex compounding) — expect insurance premiums to compound above CPI over the hold.
Questions for the listing agent
- Built in 1940 — when were the roof, HVAC, electrical panel, plumbing, and water heater last replaced?
- Is there a deadline driving the sale (1031 exchange, divorce, estate, relocation)? That informs how much negotiation room exists.
- Schools are D-rated, which usually means shorter tenancies and higher turnover. Who's the typical renter profile here, and what's been the actual vacancy rate?
- What's the average days-on-market for RENTAL listings here right now (not sales)? A rising rental-DOM trend means longer vacancies and softer asking-rent achievability than the comps imply.
- What's the recent tenant-quality profile in this submarket — average credit score on applications, eviction rate, late-payment / NSF rate, and stable-employment percentage? A property-management company in the area should have these aggregated.
- How much new for-sale + rental construction is in the pipeline within 1–3 miles? Heavy new supply typically softens prices + rents 12–24 months out; constrained supply supports both.
Investment metrics
- 1% rule
- 1.38% ✓
- Cap rate
- 11.03%
- Cash-on-cash
- 16.92%
- DSCR
- 1.75
- GRM
- 6.1
CMA / ARV
No comps found within radius.
Projected returns pro-forma
3.77% appreciation · 3.0% rent growth · sell at horizon
- IRR
- 25.0%
- Equity multiple
- 2.48×
- Total profit
- $25,652
- Equity at exit
- $30,621
- IRR
- 25.1%
- Equity multiple
- 4.83×
- Total profit
- $66,409
- Equity at exit
- $49,446
Cash invested: $17,360 (down + closing). Projections, not guarantees.
Landlord ↔ Tenant lean methodology
- Overall (STATE)
- 87 Strongly Landlord-Friendly
- State Texas
- 87 Strongly Landlord-Friendly · R+5
- County
- — inherits STATE
- City
- — inherits STATE
ZIP-level market 75844
- Home prices YoY
- 2.2%
- Active inventory
- 133
- Price-to-rent
- 6.1×
Monthly cashflow live
- Estimated rent
- $853 medium interval (Pro) →
- Mortgage (P&I)
- −$325
- Tax from tax record
- −$78 /mo · $937/yr
- Insurance
- −$26
- HOA
- −$0
- Vacancy / Maint / Mgmt
- −$179
- Net cashflow
- $245
Break-even live
UW: 25.0% down · 7.5% · 30yr · 1.5% tax · 5.0% vac · 8.0% maint · 8.0% mgmt
Financing live
Cash to close
- Down payment
- $15,500
- Closing costs
- $1,860
- Reserves months
- —
- Total cash needed
- —
Loan-product check · same deal, 3 products live
Conventional
25% down · 7.5% · 30yr
- Down + closing
- —
- Monthly P&I
- —
- Monthly cashflow
- —
- DSCR
- —
- Eligible?
- —
Personal DTI + credit; lowest rate.
DSCR
20% down · 8.5% · 30yr
- Down + closing
- —
- Monthly P&I
- —
- Monthly cashflow
- —
- DSCR
- —
- Eligible?
- —
No personal income docs; deal must DSCR.
Hard money
10% down · 12.0% · 12mo
- Down + closing
- —
- Monthly P&I
- —
- Monthly cashflow
- —
- DSCR
- —
- Eligible?
- —
Short-term bridge; refi at stabilization.
Listing history 16 events
-
2026-06-18days on market $62,000 Active 23 DOM
-
2026-06-17days on market $62,000 Active 22 DOM
-
2026-06-16days on market $62,000 Active 21 DOM
-
2026-06-15days on market $62,000 Active 20 DOM
-
2026-06-13days on market $62,000 Active 18 DOM
-
2026-06-12days on market $62,000 Active 17 DOM
-
2026-06-09days on market $62,000 Active 14 DOM
-
2026-06-08days on market $62,000 Active 13 DOM
-
2026-06-08days on market $62,000 Active 12 DOM
-
2026-06-07statusdays on market $62,000 Active 11 DOM
-
2026-06-03statusdays on market $62,000 Pending 8 DOM
-
2026-06-02days on market $62,000 Active 7 DOM
-
2026-06-01days on market $62,000 Active 6 DOM
-
2026-05-31days on market $62,000 Active 5 DOM
-
2026-05-26$62,000 Active
-
2014-08-15soldstatus
ⓘ Source: listings_history table (triggers on properties + properties_extension) + one-shot
backfill from property_details.listing_events for pre-trigger history.
Tax reassessment forecast TX · Resets to sale price
- Current annual tax
- $937 · $78/mo
- Projected year-2 tax
- $1,135 · $95/mo
- Expected delta
- +$198/yr (+$16/mo · 21.1%)
ⓘ Screening estimate from a state-policy table — verify with the county assessor before closing.
Climate risk First Street
- Flood 1/10 Low FEMA zone X (unshaded) · 0% chance over 30 yrs
- Wildfire 5/10 Major
- Heat 7/10 Severe 7 d/yr ≥110°F today · 26 d/yr by 30 yrs out
- Wind 8/10 Severe 80% chance of damaging wind over 30 yrs
- Air quality 1/10 Low 0 unhealthy d/yr today · 0 by 30 yrs out
Nearby sold comps map
Loading sold comps map…
Walkable amenities ~0.75 mi
Loading nearby amenities…
Taxation est. · year 1
- Rental income
- $10,235
- − Mortgage interest
- −$3,473
- − Property taxes
- −$937
- − Insurance
- −$310
- − Repairs & maintenance
- −$819
- − Management
- −$819
- − Depreciation
- −$1,804
- Taxable income
- $2,074
- Est. tax owed @ 24.0%
- −$498
- After-tax cash flow
- $2,440/yr
For passive investors: Depreciation is non-cash, so a rental often shows a tax loss while cash-flowing — sheltering income. Rental losses are passive: they offset passive income freely, and up to $25,000/yr can offset ordinary (W-2) income if you actively participate and your MAGI is under $100k (phasing out to $0 by $150k); unused losses carry forward. On sale, claimed depreciation is recaptured at up to 25%, and gains may owe capital-gains tax (a 1031 exchange can defer both). Figures are a year-1 estimate at your 24.0% rate — not tax advice; consult a CPA.
Schools (NCES district)
- District
- Grapeland ISD
- NCES district ID
- 4821630
- Math proficiency
- 28% ▼ -8.00%
- Reading proficiency
- 35% ▼ -2.00%
- Median HH income
- $36,370
- Composite
- 26.12/100
- National rank
- #7285
- State rank
- #613 of 826 in TX
Livability — Grapeland
- Score
- 69/100
- State rank
- #427
- US rank
- #8834
Category grades
Schools grade is shown separately in the Schools card above.
Census & demographics
- Census place
- Grapeland, TX
- Population (ZIP)
- 5,004
Population outlook (Houston County) Hauer SSP2
- Today (2025)
- 21,269 people
- By 2030
- 20,568 · -3.3%
- By 2040
- 19,255 · -9.5%
- By 2050
- 17,980 · -15.5%
- By 2075
- 15,214 · -28.5%
- By 2100
- 11,720 · -44.9%
Race, ethnicity, and origin ACS 2023
- Neighborhood character
- Predominantly White (72%)
- Race & ethnicity
- White 72% Black 16% Hispanic / Latino 6% Two or more races 4% Native American 1%
- Hispanic origin (detail)
- Mexican 5%
- Common ancestry
- Serbian 4% Slovak 3% Romanian 2%
- Foreign-born
- 2% · Canada
- Languages at home
- 98% English-only · Spanish 2%
Political lean MEDSL · Houston
- 2024 margin
- Solid R (+55.4) · D 22.1% · R 77.4%
- 2008→2024 swing
- -18.1pp toward R · 2008: -37.3pp · 2024: -55.4pp
- All cycles
- 2024: R+55.4 2020: R+50.3 2016: R+50.9 2012: R+44.3 2008: R+37.3
Not yet ingested
- Civics
- —
Market trends
- HPI YoY
- ▲ 3.77%
- Current HPI
- 174.906
- Rent YoY
- —
- Metro
- —
- State GDP YoY
- ▲ 3.95%
- F500 in state
- 110
Industry mix (Fortune 500 HQ in TX)
| Industry | F500 HQs | Revenue |
|---|---|---|
| Energy | 16 | $1,198B |
|
||
| Technology | 5 | $198B |
|
||
| Engineering / Construction | 4 | $72B |
|
||
| Energy Services | 3 | $60B |
|
||
| Utilities | 3 | $41B |
|
||
| Healthcare | 2 | $330B |
|
||
Price history
2 events — show timeline
- 2026-05-26 Listed $62,000 HARMLS
- 2014-08-15 Sold (Public Records) — Public Records
Property tax history
+1.9%/yrLatest (2025): $937 · +2.5% YoY. Source: county tax records.
Cash-flow waterfall
monthlySold comps — $/sqft
last 12 mo · ≤1 miLoading sold comps…