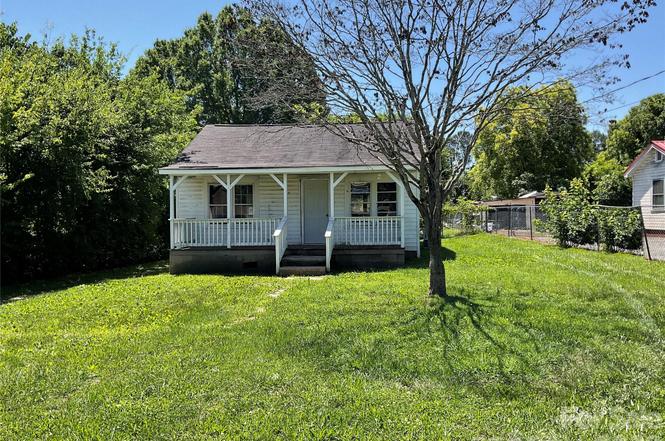
1024 Catawba St · Lincolnton, NC
Flood risk 1/10 · Minimal
- FEMA flood zone
- X (unshaded)
- Chance of flooding over 30 yrs
- 0.0%
- Est. flood insurance / yr
- $507 – $1,088
Fire risk 2/10 · Minimal
- Est. fire insurance / yr
- $906 – $1,684
Heat risk 6/10 · Moderate
- Hot days now (above 103°F)
- 7 days/yr
- Hot days in 30 yrs
- 17 days/yr
Wind risk 4/10 · Minor
- Chance of severe wind over 30 yrs
- 7.0%
Air-quality risk 3/10 · Minor
- Unhealthy air days now
- 4 days/yr
- Unhealthy air days in 30 yrs
- 4 days/yr
Risk factors via First Street. Map © Google.
Why this score? — see what drove the B grade
The composite is a weighted blend of 9 inputs, each scored 0–100. Each bar is that input's sub-score; the figure is the points it added to the 100-point composite (weight × sub-score).
- Cash flow +30.0/30.0
- DSCR +10.0/10.0
- 1% rule +9.8/10.0
- ARV discount +7.5/15.0
- Schools +4.8/10.0
- Livability +3.5/5.0
- Condition / age +2.5/5.0
- Rent growth +2.4/5.0
- Appreciation +0.0/10.0
$82,500
🖨 Deal sheet 📄 Offer letter ✓ Due diligence
Listing remarks
Two bedroom one bath open floor plan located on . 48 acre lot.
Key facts
- 0.48 acre lot
- Built 1940
Property features AI
Finance
- HOA & community: No HOA
Exterior
- Parking: Driveway
- Utilities: Water: Other (see remarks); Sewer: Other (see remarks)
- Home design: Single-family residential property; One story
- Construction: Site-built construction; Vinyl exterior; Crawl space foundation
- Exterior features: Lot approximately 0.48 acres; Lot dimensions: 26 x 76 x 204 x 103 x 208; Road surfaces include dirt and concrete; Publicly maintained road access
Interior
- Kitchen: No appliances included
- Bedrooms: Two bedrooms on the main level
- Bathrooms: One full bathroom on the main level
- Heating & cooling: Heating: Other (see remarks); Cooling: Other (see remarks)
- Interior features: Seven total rooms; Appliances: None
- Laundry & utility: Laundry located in the bathroom
Neighborhood map
What this means for you Summary
Snapshot
- This is a 2-bed/1.0-bath single-family listed at $82k.
Deal economics
- At list price, monthly cash flow is $415 ($5k/yr) — positive.
- The deal already cash-flows at list — no discount required.
- Meets the 1% rule at list price ($1k rent vs $82k).
- Cap rate 12.3% vs local median 2.8% in Lincolnton — top-decile yield for the area; either an underpriced asset or a hidden risk that comps aren't pricing in. Stress-test before assuming the spread holds.
Location & tenants
- Location reads 69/100 on livability (#148 in NC) — a middle-class / working-renter tenant base. Strengths: cost of living A+, health & safety A+, housing A; Watch: crime D+, amenities F, commute F.
- Lincoln County Schools (rural): math 57% / reading 55% proficiency, ranked #42 of 178 in NC (top 24%) — acceptable for families but not a draw, mixed tenant base, ~2y average lease.
- Zoned schools: Lincolnton High (math 62% / reading 57%, grade C+, #216 of 535 statewide, top 43%, 813 students, 65% FRL) — zoned schools average 65% FRL vs 41% district-wide (24 pts higher); higher-poverty schools than district average — tighter screening recommended.
- Market conditions: Rents soft (-0.6%/yr); 290 active listings in the ZIP; 7 comparable units currently listed for rent nearby; rentals at typical pace (median 24d on market — plan ~3-4 weeks tenant-placement turnaround); 697 units permitted in Lincoln County in 2024 (0 in 5+ unit buildings).
Forward outlook
- Local home prices are declining (-3.0%/yr); year-one equity from $570 of loan paydown is wiped out by about $2k of value loss. Plan a longer hold.
- Lincoln County population projected at +8% by 2050 — modest demand growth; plan on rents tracking national, not racing it.
- At projected returns (-3.0% appreciation + 0.0% rent growth), your $23k cash investment doubles in ~7 years — after that, you're playing with house money.
Negotiation context
- Only 1 days on market — expect competitive offers; lowballing is unlikely to land.
- 4 sale attempts since 2y ago with the ask held roughly flat each time — persistent listings suggest the price (not the market) is what's stuck; bring a comps-based counter.
Risks & watch-outs
- Watch-outs: built in 1940 — expect roof / HVAC / electrical / plumbing capex.
- Climate carrying-cost: extreme-heat days projected 7→17/yr by 2055 (HVAC capex compounding) — expect insurance premiums to compound above CPI over the hold.
Questions for the listing agent
- Built in 1940 — when were the roof, HVAC, electrical panel, plumbing, and water heater last replaced?
- Is there a deadline driving the sale (1031 exchange, divorce, estate, relocation)? That informs how much negotiation room exists.
- Schools are D-rated, which usually means shorter tenancies and higher turnover. Who's the typical renter profile here, and what's been the actual vacancy rate?
- Crime grade is D in this area — have there been break-ins, vandalism, or insurance claims at this property in the last 3 years? What carrier currently insures it and at what premium?
- What's the average days-on-market for RENTAL listings here right now (not sales)? A rising rental-DOM trend means longer vacancies and softer asking-rent achievability than the comps imply.
- What's the recent tenant-quality profile in this submarket — average credit score on applications, eviction rate, late-payment / NSF rate, and stable-employment percentage? A property-management company in the area should have these aggregated.
- How much new for-sale + rental construction is in the pipeline within 1–3 miles? Heavy new supply typically softens prices + rents 12–24 months out; constrained supply supports both.
Investment metrics
- 1% rule
- 1.48% ✓
- Cap rate
- 12.33%
- Cash-on-cash
- 21.58%
- DSCR
- 1.96
- GRM
- 5.6
CMA / ARV
- ARV (on-the-fly)
- $184,000
- Comps found
- 1
Show comp detail 1 sale within ~0.75 mi
| Address | Dist | Beds/Ba | Sqft | Sold | Price | $/sf | Match |
|---|---|---|---|---|---|---|---|
| 826 E Alexander St | 0.64mi | 2/1.0 | 870 (+9%) | 6mo | $200,000 | $230 | 50 |
Match score weights: distance 35% · size 25% · config 20% · recency 20%. Top-matched comps best support the ARV.
Projected returns pro-forma
-3.0% appreciation · 0.0% rent growth · sell at horizon
- IRR
- 10.8%
- Equity multiple
- 1.41×
- Total profit
- $9,524
- Equity at exit
- $12,301
- IRR
- 17.3%
- Equity multiple
- 2.24×
- Total profit
- $28,591
- Equity at exit
- $7,133
Cash invested: $23,100 (down + closing). Projections, not guarantees.
Landlord ↔ Tenant lean methodology
- Overall (STATE)
- 85 Strongly Landlord-Friendly
- State North Carolina
- 85 Strongly Landlord-Friendly · R+3
- County
- — inherits STATE
- City
- — inherits STATE
ZIP-level market 28092
- Home prices YoY
- -23.3%
- Rents YoY
- -0.6%
- Active inventory
- 290
- Price-to-rent
- 5.6×
Monthly cashflow live
- Estimated rent
- $1,217 high interval (Pro) →
- Mortgage (P&I)
- −$433
- Tax from tax record
- −$79 /mo · $948/yr
- Insurance
- −$34
- HOA
- −$0
- Vacancy / Maint / Mgmt
- −$256
- Net cashflow
- $415
Break-even live
UW: 25.0% down · 7.5% · 30yr · 1.5% tax · 5.0% vac · 8.0% maint · 8.0% mgmt
Financing live
Cash to close
- Down payment
- $20,625
- Closing costs
- $2,475
- Reserves months
- —
- Total cash needed
- —
Loan-product check · same deal, 3 products live
Conventional
25% down · 7.5% · 30yr
- Down + closing
- —
- Monthly P&I
- —
- Monthly cashflow
- —
- DSCR
- —
- Eligible?
- —
Personal DTI + credit; lowest rate.
DSCR
20% down · 8.5% · 30yr
- Down + closing
- —
- Monthly P&I
- —
- Monthly cashflow
- —
- DSCR
- —
- Eligible?
- —
No personal income docs; deal must DSCR.
Hard money
10% down · 12.0% · 12mo
- Down + closing
- —
- Monthly P&I
- —
- Monthly cashflow
- —
- DSCR
- —
- Eligible?
- —
Short-term bridge; refi at stabilization.
Rent comps 7 comps
| Address | Beds | Baths | Sqft | Rent | $/sqft | DOM | Units | Dist |
|---|---|---|---|---|---|---|---|---|
| 508 S Laurel St Lincolnton, NC | 2.0 | 1.0 | 857 | $1,200 | $1.40 | 23d | 1 | 0.39mi |
| 720 E Pine St Lincolnton, NC | 1.0 | 1.0 | 600 | $950 | $1.58 | 23d | 1 | 0.42mi |
| 1114 S Aspen St Lincolnton, NC | 2.0 | 1.0 | 1111 | $1,175 | $1.06 | 17d | 1 | 1.01mi |
| 909 N Flint St Apt 919 Lincolnton, NC | 2.0 | 1.0 | 850 | $1,149 | $1.35 | 23d | 1 | 1.01mi |
| 1114 S Aspen St Unit 3 Lincolnton, NC | 2.0 | 1.0 | 914 | $1,150 | $1.26 | 23d | 1 | 1.01mi |
| 103 Neighborhood St Lincolnton, NC | 2.0 | 1.0 | 781 | $1,195 | $1.53 | 20d | 1 | 1.25mi |
| 171 Donaldson Dr Lincolnton, NC | 1.0–2.0 | 1.0–2.0 | 911 | $1,400 | $1.54 | 2d | 14 | 1.47mi |
Listing history 2 events
-
2026-06-17remarks 62-char remark
-
2026-06-17$82,500 Active 1 DOM
ⓘ Source: listings_history table (triggers on properties + properties_extension) + one-shot
backfill from property_details.listing_events for pre-trigger history.
Tax reassessment forecast NC · Resets to sale price
- Current annual tax
- $948 · $79/mo
- Projected year-2 tax
- $948 · $79/mo
- Expected delta
- $0/yr ($0/mo · 0.0%)
ⓘ Screening estimate from a state-policy table — verify with the county assessor before closing.
Climate risk First Street
- Flood 1/10 Low FEMA zone X (unshaded) · 0% chance over 30 yrs
- Wildfire 2/10 Low
- Heat 6/10 Major 7 d/yr ≥103°F today · 17 d/yr by 30 yrs out
- Wind 4/10 Moderate 7% chance of damaging wind over 30 yrs
- Air quality 3/10 Moderate 4 unhealthy d/yr today · 4 by 30 yrs out
Nearby sold comps map
Loading sold comps map…
Walkable amenities ~0.75 mi
Loading nearby amenities…
Taxation est. · year 1
- Rental income
- $14,604
- − Mortgage interest
- −$4,621
- − Property taxes
- −$948
- − Insurance
- −$412
- − Repairs & maintenance
- −$1,168
- − Management
- −$1,168
- − Depreciation
- −$2,400
- Taxable income
- $3,885
- Est. tax owed @ 24.0%
- −$932
- After-tax cash flow
- $4,052/yr
For passive investors: Depreciation is non-cash, so a rental often shows a tax loss while cash-flowing — sheltering income. Rental losses are passive: they offset passive income freely, and up to $25,000/yr can offset ordinary (W-2) income if you actively participate and your MAGI is under $100k (phasing out to $0 by $150k); unused losses carry forward. On sale, claimed depreciation is recaptured at up to 25%, and gains may owe capital-gains tax (a 1031 exchange can defer both). Figures are a year-1 estimate at your 24.0% rate — not tax advice; consult a CPA.
Schools (NCES district)
- District
- Lincoln County Schools
- NCES district ID
- 3702680
- Math proficiency
- 57% ▲ 7.00%
- Reading proficiency
- 55% ▲ 1.00%
- Median HH income
- $49,203
- Composite
- 47.7/100
- National rank
- #2242
- State rank
- #42 of 178 in NC
Livability — Lincolnton
- Score
- 69/100
- State rank
- #148
- US rank
- #8217
Category grades
Schools grade is shown separately in the Schools card above.
Census & demographics
- Census place
- Lincolnton, NC
- County
- Lincoln County · 69,118 people
- City population
- 40,350
- Metro
- Charlotte-Concord-Gastonia, NC-SC
- Population (ZIP)
- 40,350
- Household income
- $60,984
- Rent vs Own
- Severe rent burden
- 1134.0
Population outlook (Lincoln County) Hauer SSP2
- Today (2025)
- 86,972 people
- By 2030
- 89,467 · +2.9%
- By 2040
- 93,107 · +7.1%
- By 2050
- 94,304 · +8.4%
- By 2075
- 95,190 · +9.4%
- By 2100
- 90,096 · +3.6%
Race, ethnicity, and origin ACS 2023
- Neighborhood character
- Predominantly White (76%)
- Race & ethnicity
- White 76% Hispanic / Latino 11% Black 9% Two or more races 7%
- Hispanic origin (detail)
- Mexican 5%
- Common ancestry
- Italian 2% Serbian 1% Slovak 1%
- Foreign-born
- 6% · Canada, Guatemala
- Languages at home
- 90% English-only · Spanish 8% Russian/Polish/Slavic 1%
Political lean MEDSL · Lincoln
- 2024 margin
- Solid R (+45.7) · D 26.8% · R 72.5%
- 2008→2024 swing
- -12.4pp toward R · 2008: -33.3pp · 2024: -45.7pp
- All cycles
- 2024: R+45.7 2020: R+45.9 2016: R+47.7 2012: R+38.9 2008: R+33.3
Not yet ingested
- Civics
- —
Market trends
- HPI YoY
- ▼ -92.94%
- Current HPI
- 306.3997
- Rent YoY
- ▼ -0.58%
- Metro
- Charlotte-Concord-Gastonia, NC-SC
- State GDP YoY
- ▲ 3.28%
- F500 in state
- 26
Industry mix (Fortune 500 HQ in NC)
| Industry | F500 HQs | Revenue |
|---|---|---|
| Financial Services | 2 | $213B |
|
||
| Retail | 2 | $95B |
|
||
| Industrial Conglomerate | 1 | $38B |
|
||
| Metals / Steel | 1 | $35B |
|
||
| Utilities | 1 | $30B |
|
||
| Industrial Machinery | 1 | $19B |
|
||
Price history
+275.0% since first listed11 events — show timeline
- 2026-06-17 Listed $82,500 CANOPYMLS as Distributed by MLS Grid
- 2025-10-28 Listed $140,000 CANOPYMLS as Distributed by MLS Grid
- 2025-06-24 Listed $140,000 CANOPYMLS as Distributed by MLS Grid
- 2024-05-02 Listed $125,000 CANOPYMLS as Distributed by MLS Grid
- 2024-04-25 Coming Soon — CANOPYMLS as Distributed by MLS Grid
- 2021-10-26 Sold (Public Records) $100,000 Public Records
- 2021-08-12 Price Changed $110,000 CANOPYMLS as Distributed by MLS Grid
- 2021-07-30 Price Changed $97,000 CANOPYMLS as Distributed by MLS Grid
- 2021-04-15 Price Changed $85,000 CANOPYMLS as Distributed by MLS Grid
- 2021-03-17 Sold (Public Records) $60,000 Public Records
- 2012-12-17 Sold (MLS) $22,000 CANOPYMLS as Distributed by MLS Grid
Property tax history
+3.9%/yrLatest (2025): $948 · +0.0% YoY. Source: county tax records.
Cash-flow waterfall
monthlySold comps — $/sqft
last 12 mo · ≤1 miLoading sold comps…