 7-Plex
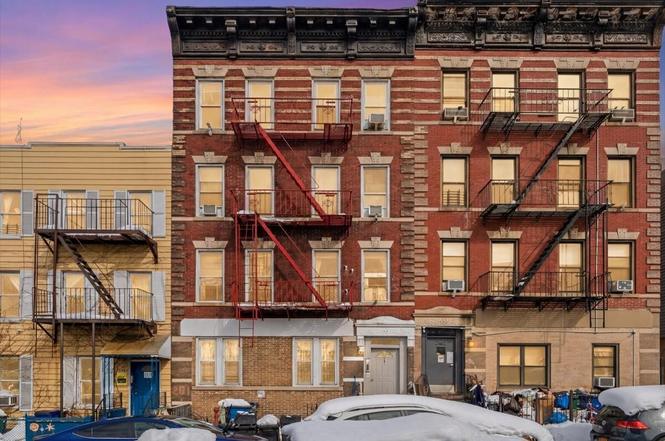
281 23rd St · New York, NY
Flood risk 1/10 · Minimal
- FEMA flood zone
- X (unshaded)
- Chance of flooding over 30 yrs
- 0.0%
- Est. flood insurance / yr
- $507 – $1,088
Fire risk 1/10 · Minimal
- Est. fire insurance / yr
- $691 – $1,283
Heat risk 6/10 · Moderate
- Hot days now (above 99°F)
- 7 days/yr
- Hot days in 30 yrs
- 15 days/yr
Wind risk 6/10 · Moderate
- Chance of severe wind over 30 yrs
- 62.0%
Air-quality risk 4/10 · Minor
- Unhealthy air days now
- 5 days/yr
- Unhealthy air days in 30 yrs
- 7 days/yr
Risk factors via First Street. Map © Google.
Why this score? — see what drove the B- grade
The composite is a weighted blend of 9 inputs, each scored 0–100. Each bar is that input's sub-score; the figure is the points it added to the 100-point composite (weight × sub-score).
- Cash flow +20.4/30.0
- Appreciation +10.0/10.0
- 1% rule +7.5/10.0
- ARV discount +7.5/15.0
- DSCR +6.5/10.0
- Schools +5.0/10.0
- Rent growth +3.9/5.0
- Livability +3.8/5.0
- Condition / age +2.5/5.0
$1,849,999
🖨 Deal sheet (PDF) 📄 Offer letter ✓ Due diligence
Multi-family units
County records classify this as Multi-Family (5+ Unit). Listing-text estimate: 7 units. confirmed
5+ unit building — per-unit beds/baths from public records are typically unavailable; the breakdown below (if shown) is an estimate from the listing text.
Listing remarks MLS
Turnkey multifamily investment - 281 23rd Street is a beautifully-maintained masonry pre-war building spanning approximately 8,492 square feet above-grade. The building hosts 12 apartments, eight of which are configured as 2 BR, while the remaining four are 1 BR. The building is being offered for sale for the first time in almost 40 years. Current ownership has taken long-term care of the property, offering new ownership a turn-key cash flowing asset. Core asset with consistent cash flow and future upside - All apartments are rent-stabilized and leased. The asset currently generates over $270,000 gross annually. Average AGI/NSF is $34.61, equating to an average monthly rent of $1837 per apartment, this is approximately 75% of market rents of comparable rentals in area. This allows future investors to take advantage of immediate rental income on day one with virtually no work, while retaining substantial long-term upside as units are brought to market rate over time. Ideal location with multiple amenities - R subway station at the 25th Street station & the Prospect Avenue station (D, N, R, W trains). There are several markets, banks and convenience stores along with dozens of cafes and restaurants in the immediate area along 5th Avenue retail corridor. The location provides direct commutes to Manhattan and Brooklyn via these lines. Ideally positioned for quick access to the major highway interchange of I-278 (Gowanus Expressway) and NY-27 (Prospect Expressway).
Key facts
- Multiple amenities
- Ideal location
- Rent-stabilized
Tags
Property features AI
Finance
- Other: Utility expense listed (value reported for reference)
- Financial info: Current reported annual rent income: $270,552; Financing options considered: exchange, bank mortgage, or cash; Example unit rents reported (current and projected for some units): $1,800 (current) / $2,463 (projected), $1,150, $2,111 (current) / $2,174 (projected), $1,316, $1,904 (current) / $3,394 (projected), $2,420, $1,963, $1,600 (current) / $2,325 (projected), $2,328, $2,011 (current) / $2,046 (projected)
- HOA & community: No HOA details provided
Exterior
- Parking: Street parking
- Security: No specific security features listed
- Utilities: 220V electrical service with circuit breakers; Gas hot water and heating; Steam/radiator heat delivery
- Home design: Residential multi-unit building; Building footprint approximately 89 x 25 feet
- Construction: Brick construction; Poured concrete foundation
- Exterior features: Semi-detached building; Brick exterior; Flat/asphalt tar roof; Property zoned R6B; Lot number 49
Interior
- Kitchen: No specific built-in kitchen appliance list provided
- Bedrooms: Twelve residential units: mix of 1- and 2-bedroom apartments (examples: multiple 2-bedroom units and multiple 1-bedroom units)
- Flooring: Carpeting; Ceramic floors; Hardwood floors; Linoleum floors
- Bathrooms: Eight full bathrooms and eight half bathrooms in the building (unit-level bathrooms vary; some 1-bed units show 2 baths including half baths)
- Heating & cooling: Steam/radiator heat; Gas-fired hot water; Wall and window A/C units
- Interior features: Wall and window air-conditioning units (5+ AC units); Cellar with semi-finished space and separate entrance; Storage rooms; Carpeting, ceramic tile, hardwood and linoleum flooring
- Laundry & utility: No specific washer/dryer or in-unit laundry details provided
Neighborhood map
What this means for you Summary
Snapshot
- This is a 7 × 3-bed/?-bath units multifamily listed at $1.85M.
Deal economics
- At list price, monthly cash flow is $2k ($29k/yr) — positive. Per door: $344/mo.
- The deal already cash-flows at list — no discount required.
- Meets the 1% rule at list price ($23k rent vs $1.85M).
- Recommended offer: $1.68M (9.0% below list) — sets the bar for market timing.
- Cap rate 7.9% vs local median 2.6% in New York — top-decile yield for the area; either an underpriced asset or a hidden risk that comps aren't pricing in. Stress-test before assuming the spread holds.
Location & tenants
- Location reads 75/100 on livability (#268 in NY, #4,188 nationally) — a middle-class / working-renter tenant base. Strengths: amenities A+, commute A+, health & safety A; Watch: crime F, cost of living F.
- Market conditions: Rents rising fast (+5.7%/yr); 248 active listings in the ZIP; high-income renter base; 10,063 units permitted in Kings County in 2024 (9,789 in 5+ unit buildings).
- At $23,087/mo this rent would consume 149% of the median local household income ($186k/yr) (locally 2372% of renters already pay >50% of income on rent) — very limited rent-growth headroom before tenants either downsize or default.
Forward outlook
- In year one you build about $198k of equity ($13k loan paydown + $185k appreciation (10.0% local appreciation)).
- Kings County population projected at +13% by 2050 — modest demand growth; plan on rents tracking national, not racing it.
- At projected returns (10.0% appreciation + 5.7% rent growth), your $518k cash investment doubles in ~3 years — after that, you're playing with house money.
- By year 2, paydown + projected appreciation supports a ~$318k cash-out refi (75% LTV) — recoverable capital for the next deal without selling this one.
Negotiation context
- It's been on market 106 days — a 9% lower offer ($1.68M) is reasonable based on typical stale-listing flexibility.
- 3 sale attempts since 3y ago; this cycle's ask has dropped $100k (5%) from the opening price — seller is motivated, your offer sets the floor, not the list.
- Current owner paid $225k; list at $1.85M implies a 722% gain — meaningful room to come down on a strong offer.
Risks & watch-outs
- Watch-outs: property tax is 3.5% of price; built in 1931 — expect roof / HVAC / electrical / plumbing capex.
- Climate carrying-cost: major wind risk, 62% chance of damaging wind over 30y; extreme-heat days projected 7→15/yr by 2055 (HVAC capex compounding) — expect insurance premiums to compound above CPI over the hold.
Questions for the listing agent
- It's been on market 106 days. Have you received any prior offers? Is the seller open to a 9% concession, seller financing, or rate buy-down credit?
- Can we see the unit-by-unit rent roll, current vacancy, and any below-market leases? What's the average tenancy length?
- What capital expenditures (roof, boiler, parking lot, exteriors) have been made in the last 5 years, and what's planned in the next 2?
- Built in 1931 — when were the roof, HVAC, electrical panel, plumbing, and water heater last replaced?
- Property tax is high relative to price — has the assessment been appealed recently, and will the sale trigger a re-assessment?
- Why hasn't it sold? Are there any deal-killer items the seller is aware of (foundation, flood, title, zoning, code violations)?
- Is there a deadline driving the sale (1031 exchange, divorce, estate, relocation)? That informs how much negotiation room exists.
- Schools are B-rated — typically a magnet for longer-tenancy family renters. What's the average tenant stay here, and is there a school-zone premium baked into asking?
- Crime grade is F in this area — have there been break-ins, vandalism, or insurance claims at this property in the last 3 years? What carrier currently insures it and at what premium?
- What's the average days-on-market for RENTAL listings here right now (not sales)? A rising rental-DOM trend means longer vacancies and softer asking-rent achievability than the comps imply.
- What's the recent tenant-quality profile in this submarket — average credit score on applications, eviction rate, late-payment / NSF rate, and stable-employment percentage? A property-management company in the area should have these aggregated.
- How much new apartment / multifamily construction is in the pipeline within 1–3 miles? Heavy new supply (>2% of stock underway) typically softens rents 12–24 months out; light construction supports rent growth.
Investment metrics
- 1% rule
- 1.25% ✓
- Cap rate
- 7.85%
- Cash-on-cash
- 5.57%
- DSCR
- 1.25
- GRM
- 6.7
CMA / ARV
No comps found within radius.
Projected returns pro-forma
10.0% appreciation · 5.67% rent growth · sell at horizon
- IRR
- 29.6%
- Equity multiple
- 3.37×
- Total profit
- $1,226,637
- Equity at exit
- $1,666,626
- IRR
- 26.7%
- Equity multiple
- 8.03×
- Total profit
- $3,640,140
- Equity at exit
- $3,594,141
Cash invested: $518,000 (down + closing). Projections, not guarantees.
Landlord ↔ Tenant lean methodology
- Overall (CITY)
- 0 Strongly Tenant-Friendly
- State New York
- 15 Strongly Tenant-Friendly · D+10
- County
- — inherits STATE
- City New York
- 0 Strongly Tenant-Friendly · D+34
ZIP-level market 11215
- Home prices YoY
- 2.7%
- Rents YoY
- 5.7%
- Active inventory
- 248
- Price-to-rent
- 46.7×
Monthly cashflow live
- Estimated rent
- $23,087 medium interval (Pro) →
- Mortgage (P&I)
- −$9,702
- Tax from tax record
- −$5,361 /mo · $64,335/yr
- Insurance
- −$771
- HOA
- −$0
- Vacancy / Maint / Mgmt
- −$4,848
- Net cashflow
- $2,405
Break-even live
Sensitivity live
| Price | -10% $3,452 | -5% $2,929 | +0% $2,405 | +5% $1,881 | +10% $1,358 |
|---|---|---|---|---|---|
| Rent | -10% $581 | -5% $1,493 | +0% $2,405 | +5% $3,317 | +10% $4,229 |
| Rate | -1.0pp $3,337 | -0.5pp $2,876 | base $2,405 | +0.5pp $1,926 | +1.0pp $1,438 |
7-unit breakdown (identical units grouped — click to expand)
| Units | Beds | Baths | Est. rent |
|---|---|---|---|
| 7× units | 3 | — | $23,086 |
| #1 | 3 | — | $3,298 |
| #2 | 3 | — | $3,298 |
| #3 | 3 | — | $3,298 |
| #4 | 3 | — | $3,298 |
| #5 | 3 | — | $3,298 |
| #6 | 3 | — | $3,298 |
| #7 | 3 | — | $3,298 |
| Total (7 units) | $23,087 | ||
UW: 25.0% down · 7.5% · 30yr · 1.5% tax · 5.0% vac · 8.0% maint · 8.0% mgmt
Financing live
Cash to close
- Down payment
- $462,500
- Closing costs
- $55,500
- Reserves months
- —
- Total cash needed
- —
Loan-product check · same deal, 3 products live
Conventional
25% down · 7.5% · 30yr
- Down + closing
- —
- Monthly P&I
- —
- Monthly cashflow
- —
- DSCR
- —
- Eligible?
- —
Personal DTI + credit; lowest rate.
DSCR
20% down · 8.5% · 30yr
- Down + closing
- —
- Monthly P&I
- —
- Monthly cashflow
- —
- DSCR
- —
- Eligible?
- —
No personal income docs; deal must DSCR.
Hard money
10% down · 12.0% · 12mo
- Down + closing
- —
- Monthly P&I
- —
- Monthly cashflow
- —
- DSCR
- —
- Eligible?
- —
Short-term bridge; refi at stabilization.
Listing history 20 events
-
2026-06-18days on market $1,849,999 Active 106 DOM
-
2026-06-17days on market $1,849,999 Active 105 DOM
-
2026-06-15days on market $1,849,999 Active 103 DOM
-
2026-06-13days on market $1,849,999 Active 101 DOM
-
2026-06-10days on market $1,849,999 Active 97 DOM
-
2026-06-08days on market $1,849,999 Active 96 DOM
-
2026-06-08days on market $1,849,999 Active 95 DOM
-
2026-06-04days on market $1,849,999 Active 92 DOM
-
2026-06-03days on market $1,849,999 Active 91 DOM
-
2026-06-01days on market $1,849,999 Active 89 DOM
-
2026-05-31days on market $1,849,999 Active 88 DOM
-
2026-04-23price $1,849,999
Show marketing remark (1490 chars)
Turnkey multifamily investment - 281 23rd Street is a beautifully-maintained masonry pre-war building spanning approximately 8,492 square feet above-grade. The building hosts 12 apartments, eight of which are configured as 2 BR, while the remaining four are 1 BR. The building is being offered for sale for the first time in almost 40 years. Current ownership has taken long-term care of the property, offering new ownership a turn-key cash flowing asset. Core asset with consistent cash flow and future upside - All apartments are rent-stabilized and leased. The asset currently generates over $270,000 gross annually. Average AGI/NSF is $34.61, equating to an average monthly rent of $1837 per apartment, this is approximately 75% of market rents of comparable rentals in area. This allows future investors to take advantage of immediate rental income on day one with virtually no work, while retaining substantial long-term upside as units are brought to market rate over time. Ideal location with multiple amenities - R subway station at the 25th Street station & the Prospect Avenue station (D, N, R, W trains). There are several markets, banks and convenience stores along with dozens of cafes and restaurants in the immediate area along 5th Avenue retail corridor. The location provides direct commutes to Manhattan and Brooklyn via these lines. Ideally positioned for quick access to the major highway interchange of I-278 (Gowanus Expressway) and NY-27 (Prospect Expressway).
-
2026-04-23price $1,849,999 1490-char remark
Show marketing remark (1490 chars)
Turnkey multifamily investment - 281 23rd Street is a beautifully-maintained masonry pre-war building spanning approximately 8,492 square feet above-grade. The building hosts 12 apartments, eight of which are configured as 2 BR, while the remaining four are 1 BR. The building is being offered for sale for the first time in almost 40 years. Current ownership has taken long-term care of the property, offering new ownership a turn-key cash flowing asset. Core asset with consistent cash flow and future upside - All apartments are rent-stabilized and leased. The asset currently generates over $270,000 gross annually. Average AGI/NSF is $34.61, equating to an average monthly rent of $1837 per apartment, this is approximately 75% of market rents of comparable rentals in area. This allows future investors to take advantage of immediate rental income on day one with virtually no work, while retaining substantial long-term upside as units are brought to market rate over time. Ideal location with multiple amenities - R subway station at the 25th Street station & the Prospect Avenue station (D, N, R, W trains). There are several markets, banks and convenience stores along with dozens of cafes and restaurants in the immediate area along 5th Avenue retail corridor. The location provides direct commutes to Manhattan and Brooklyn via these lines. Ideally positioned for quick access to the major highway interchange of I-278 (Gowanus Expressway) and NY-27 (Prospect Expressway).
-
2026-03-06$1,950,000 Active 1490-char remark
Show marketing remark (1490 chars)
Turnkey multifamily investment - 281 23rd Street is a beautifully-maintained masonry pre-war building spanning approximately 8,492 square feet above-grade. The building hosts 12 apartments, eight of which are configured as 2 BR, while the remaining four are 1 BR. The building is being offered for sale for the first time in almost 40 years. Current ownership has taken long-term care of the property, offering new ownership a turn-key cash flowing asset. Core asset with consistent cash flow and future upside - All apartments are rent-stabilized and leased. The asset currently generates over $270,000 gross annually. Average AGI/NSF is $34.61, equating to an average monthly rent of $1837 per apartment, this is approximately 75% of market rents of comparable rentals in area. This allows future investors to take advantage of immediate rental income on day one with virtually no work, while retaining substantial long-term upside as units are brought to market rate over time. Ideal location with multiple amenities - R subway station at the 25th Street station & the Prospect Avenue station (D, N, R, W trains). There are several markets, banks and convenience stores along with dozens of cafes and restaurants in the immediate area along 5th Avenue retail corridor. The location provides direct commutes to Manhattan and Brooklyn via these lines. Ideally positioned for quick access to the major highway interchange of I-278 (Gowanus Expressway) and NY-27 (Prospect Expressway).
-
2026-03-04$1,950,000 Active
-
2023-12-20historical
-
2023-09-13$2,700,000 Active
-
2019-12-06price $2,999,000
-
2019-08-26price $3,299,000
-
1987-11-30soldstatus $225,000
ⓘ Source: listings_history table (triggers on properties + properties_extension) + one-shot
backfill from property_details.listing_events for pre-trigger history.
Tax reassessment forecast NY · Partial reset (capped growth)
- Current annual tax
- $64,335 · $5,361/mo
- Projected year-2 tax
- $64,335 · $5,361/mo
- Expected delta
- $0/yr ($0/mo · -0.0%)
ⓘ Screening estimate from a state-policy table — verify with the county assessor before closing.
Climate risk First Street
- Flood 1/10 Low FEMA zone X (unshaded) · 0% chance over 30 yrs
- Wildfire 1/10 Low
- Heat 6/10 Major 7 d/yr ≥99°F today · 15 d/yr by 30 yrs out
- Wind 6/10 Major 62% chance of damaging wind over 30 yrs
- Air quality 4/10 Moderate 5 unhealthy d/yr today · 7 by 30 yrs out
Nearby sold comps map
Loading sold comps map…
Walkable amenities ~0.75 mi
Loading nearby amenities…
Taxation est. · year 1
- Rental income
- $277,044
- − Mortgage interest
- −$103,629
- − Property taxes
- −$64,335
- − Insurance
- −$9,250
- − Repairs & maintenance
- −$22,164
- − Management
- −$22,164
- − Depreciation
- −$53,818
- Taxable income
- $1,685
- Est. tax owed @ 24.0%
- −$405
- After-tax cash flow
- $28,456/yr
For passive investors: Depreciation is non-cash, so a rental often shows a tax loss while cash-flowing — sheltering income. Rental losses are passive: they offset passive income freely, and up to $25,000/yr can offset ordinary (W-2) income if you actively participate and your MAGI is under $100k (phasing out to $0 by $150k); unused losses carry forward. On sale, claimed depreciation is recaptured at up to 25%, and gains may owe capital-gains tax (a 1031 exchange can defer both). Figures are a year-1 estimate at your 24.0% rate — not tax advice; consult a CPA.
Schools (NCES district)
No district data.
Livability — New York
- Score
- 75/100
- State rank
- #268
- US rank
- #4188
Category grades
Schools grade is shown separately in the Schools card above.
Census & demographics
- Census place
- New York, NY
- County
- Kings County · 2,614,986 people
- City population
- 7,731,280
- Metro
- New York-Newark-Jersey City, NY-NJ-PA
- Population (ZIP)
- 70,441
- Household income
- $185,865
- Rent vs Own
- Severe rent burden
- 2372.0
Population outlook (Kings County) Hauer SSP2
- Today (2025)
- 2,847,441 people
- By 2030
- 2,937,006 · +3.1%
- By 2040
- 3,095,491 · +8.7%
- By 2050
- 3,228,968 · +13.4%
- By 2075
- 3,321,723 · +16.7%
- By 2100
- 3,111,387 · +9.3%
Race, ethnicity, and origin ACS 2023
- Neighborhood character
- Predominantly White (67%)
- Race & ethnicity
- White 67% Hispanic / Latino 15% Two or more races 11% Asian 9% Black 3%
- Hispanic origin (detail)
- Mexican 3% Puerto Rican 3%
- Common ancestry
- Romanian 5% Scotch-Irish 5% Italian 3%
- Foreign-born
- 18% · Canada, China, Jamaica
- Languages at home
- 76% English-only · Spanish 9% Other Indo-European 4% Chinese 2%
Political lean MEDSL · Kings
- 2024 margin
- Solid D (+44.0) · D 72.0% · R 28.0%
- 2008→2024 swing
- -15.5pp toward R · 2008: 59.4pp · 2024: 44.0pp
- All cycles
- 2024: D+44.0 2020: D+54.8 2016: D+61.8 2012: D+63.9 2008: D+59.4
Not yet ingested
- Civics
- —
Market trends
- HPI YoY
- ▲ 11.03%
- Current HPI
- 417.4151
- Rent YoY
- ▲ 5.67%
- Metro
- New York-Newark-Jersey City, NY-NJ-PA
- State GDP YoY
- ▲ 2.60%
- F500 in state
- 92
Industry mix (Fortune 500 HQ in NY)
| Industry | F500 HQs | Revenue |
|---|---|---|
| Financial Services | 10 | $950B |
|
||
| Consumer Goods | 9 | $162B |
|
||
| Insurance | 4 | $225B |
|
||
| Telecommunications | 2 | $144B |
|
||
| Pharmaceuticals | 2 | $112B |
|
||
| Media / Entertainment | 2 | $69B |
|
||
Price history
+722.2% since first listed9 events — show timeline
- 2026-04-23 Price Changed $1,849,999 BNYMLS
- 2026-04-23 Price Changed $1,849,999 RLS at REBNY
- 2026-03-06 Listed $1,950,000 RLS at REBNY
- 2026-03-04 Listed $1,950,000 BNYMLS
- 2023-12-20 Listing Removed — OneKey® MLS as Distributed by MLS Grid
- 2023-09-13 Listed $2,700,000 OneKey® MLS as Distributed by MLS Grid
- 2019-12-06 Price Changed $2,999,000 BNYMLS
- 2019-08-26 Price Changed $3,299,000 BNYMLS
- 1987-11-30 Sold (Public Records) $225,000 Public Records
Property tax history
+5.7%/yrLatest (2025): $64,335 · +8.0% YoY. Source: county tax records.
Cash-flow waterfall
monthlySold comps — $/sqft
last 12 mo · ≤1 miLoading sold comps…