31 Mantua Rd · Mount Royal, NJ
Flood risk 1/10 · Minimal
- FEMA flood zone
- X (unshaded)
- Chance of flooding over 30 yrs
- 0.0%
- Est. flood insurance / yr
- $507 – $1,088
Fire risk 1/10 · Minimal
- Est. fire insurance / yr
- $526 – $976
Heat risk 6/10 · Moderate
- Hot days now (above 104°F)
- 7 days/yr
- Hot days in 30 yrs
- 14 days/yr
Wind risk 6/10 · Moderate
- Chance of severe wind over 30 yrs
- 27.0%
Air-quality risk 3/10 · Minor
- Unhealthy air days now
- 2 days/yr
- Unhealthy air days in 30 yrs
- 5 days/yr
Risk factors via First Street. Map © Google.
Why this score? — see what drove the C grade
The composite is a weighted blend of 9 inputs, each scored 0–100. Each bar is that input's sub-score; the figure is the points it added to the 100-point composite (weight × sub-score).
- ARV discount +14.0/15.0
- Cash flow +13.4/30.0
- Appreciation +10.0/10.0
- Schools +4.7/10.0
- DSCR +4.1/10.0
- 1% rule +3.9/10.0
- Rent growth +2.5/5.0
- Livability +2.5/5.0
- Condition / age +2.5/5.0
$230,000
🖨 Deal sheet 📄 Offer letter ✓ Due diligence
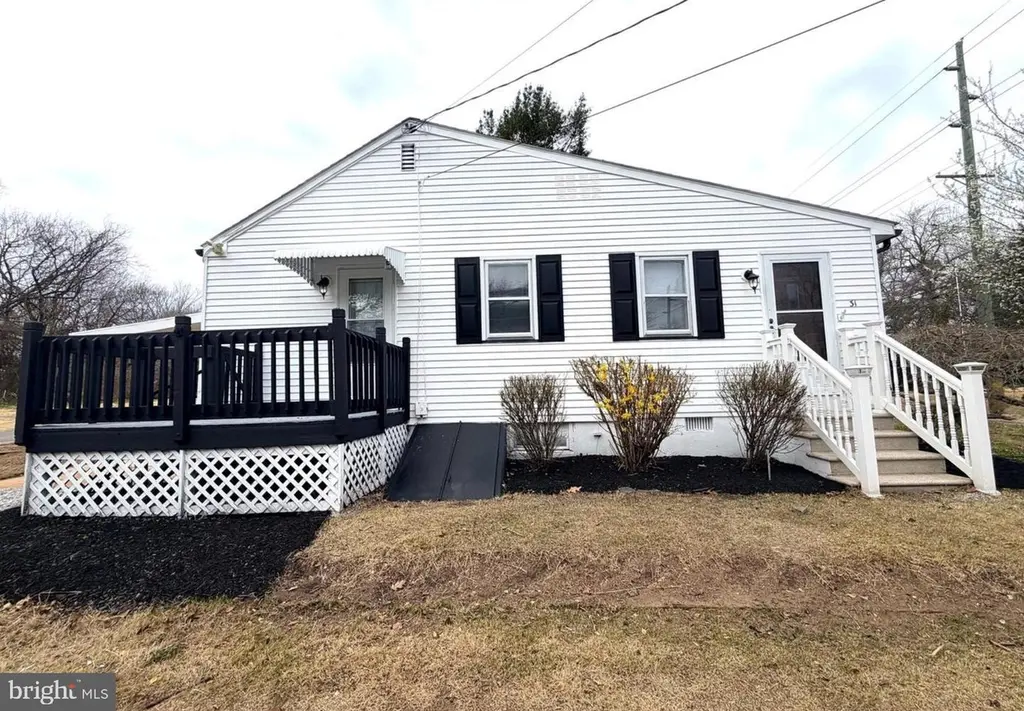
Listing remarks
Rancher featuring complete renovation with updated flooring, fresh custom paint job & upgraded lighting and fixtures throughout! Charming living room with brick fireplace flows into a beautifully appointed kitchen offering new LVP flooring, white shaker cabinets, quartz countertops, timeless subway tiled backsplash & stainless steel appliances. Generously sized bedroom is located next to a fully remodeled bathroom boasting tasteful tiled tub surround, contemporary vanity & lighting as well as an upgraded toilet. Carport and detached shed in the backyard offer additional storage space. Inviting front deck provides the perfect place to entertain or relax. Property is situate
Key facts
- Brick fireplace
- Complete renovation
- Updated flooring
Tags
Property features AI
Exterior
- Parking: Attached carport (1 space); Total 1 garage/parking space
- Utilities: Public water; On-site septic; Electric service
- Home design: Detached property; Single-story entry level
- Construction: Vinyl siding; Block foundation; Built year per assessor
- Exterior features: Deck(s); Shed; Level entry to main
Interior
- Kitchen: Stainless steel appliances
- Bedrooms: One bedroom on the main level
- Bathrooms: One full bathroom on the main level
- Heating & cooling: Forced air heating (oil); Central A/C (electric)
- Interior features: Living room; Dining room; Kitchen; Brick fireplace (1)
- Laundry & utility: Unfinished basement; Electric hot water
Neighborhood map
What this means for you Summary
Snapshot
- This is a 1-bed/1.0-bath single-family listed at $230k.
Deal economics
- At list price, monthly cash flow is $6 ($74/yr) — positive.
- The deal already cash-flows at list — no discount required.
- To meet the 1% rule (rent ≥ 1% of price), the offer needs to be $204k (11.2% below list).
- Recommended offer: $204k (11.2% below list) — sets the bar for 1% rule.
Location & tenants
- Location reads: area grade C — affects rentability + tenant quality, not the cash-flow math above.
- East Greenwich Township School District (suburban): math 38% / reading 59% proficiency, ranked #119 of 472 in NJ (top 25%) — families likely to look elsewhere, expect single-tenant / working-renter base with shorter leases; only 7% free/reduced lunch — higher-income household profile.
- Market conditions: 20 active listings in the ZIP; 1,047 units permitted in Gloucester County in 2024 (183 in 5+ unit buildings).
Forward outlook
- In year one you build about $25k of equity ($2k loan paydown + $23k appreciation (10.0% local appreciation)).
- Gloucester County population projected to shrink 5% by 2050 — rents likely to lag national; underwrite the cash flow, not the appreciation.
- At projected returns (10.0% appreciation + 3.0% rent growth), your $64k cash investment doubles in ~3 years — after that, you're playing with house money.
- By year 2, paydown + projected appreciation supports a ~$40k cash-out refi (75% LTV) — recoverable capital for the next deal without selling this one.
Negotiation context
- It's been on market 23 days — a 2% lower offer ($227k) is reasonable based on typical stale-listing flexibility.
- 5 sale attempts since 22y ago with the ask held roughly flat each time — persistent listings suggest the price (not the market) is what's stuck; bring a comps-based counter.
- Current owner paid $114k; list at $230k implies a 102% gain — meaningful room to come down on a strong offer.
Risks & watch-outs
- Watch-outs: built in 1920 — expect roof / HVAC / electrical / plumbing capex.
- Climate carrying-cost: major wind risk, 27% chance of damaging wind over 30y; extreme-heat days projected 7→14/yr by 2055 (HVAC capex compounding) — expect insurance premiums to compound above CPI over the hold.
Questions for the listing agent
- Built in 1920 — when were the roof, HVAC, electrical panel, plumbing, and water heater last replaced?
- Is there a deadline driving the sale (1031 exchange, divorce, estate, relocation)? That informs how much negotiation room exists.
- What's the average days-on-market for RENTAL listings here right now (not sales)? A rising rental-DOM trend means longer vacancies and softer asking-rent achievability than the comps imply.
- What's the recent tenant-quality profile in this submarket — average credit score on applications, eviction rate, late-payment / NSF rate, and stable-employment percentage? A property-management company in the area should have these aggregated.
- How much new for-sale + rental construction is in the pipeline within 1–3 miles? Heavy new supply typically softens prices + rents 12–24 months out; constrained supply supports both.
Investment metrics
- 1% rule
- 0.89% ✗
- Cap rate
- 6.33%
- Cash-on-cash
- 0.11%
- DSCR
- 1.01
- GRM
- 9.4
CMA / ARV
- ARV (on-the-fly)
- $268,644
- Comps found
- 1
Show comp detail 1 sale within ~0.75 mi
| Address | Dist | Beds/Ba | Sqft | Sold | Price | $/sf | Match |
|---|---|---|---|---|---|---|---|
| 43 Berkley Rd | 0.49mi | 2/1.0 (+1) | 784 (+7%) | 12mo | $288,000 | $367 | 50 |
Match score weights: distance 35% · size 25% · config 20% · recency 20%. Top-matched comps best support the ARV.
Projected returns pro-forma
10.0% appreciation · 3.0% rent growth · sell at horizon
- IRR
- 24.4%
- Equity multiple
- 2.95×
- Total profit
- $125,698
- Equity at exit
- $207,202
- IRR
- 21.6%
- Equity multiple
- 6.74×
- Total profit
- $369,933
- Equity at exit
- $446,839
Cash invested: $64,400 (down + closing). Projections, not guarantees.
Landlord ↔ Tenant lean methodology
- Overall (STATE)
- 21 Tenant-Leaning
- State New Jersey
- 21 Tenant-Leaning · D+6
- County
- — inherits STATE
- City
- — inherits STATE
ZIP-level market 08061
- Home prices YoY
- 4.5%
- Active inventory
- 20
- Price-to-rent
- 9.4×
Monthly cashflow live
- Estimated rent
- $2,041 medium interval (Pro) →
- Mortgage (P&I)
- −$1,206
- Tax from tax record
- −$305 /mo · $3,655/yr
- Insurance
- −$96
- HOA
- −$0
- Vacancy / Maint / Mgmt
- −$429
- Net cashflow
- $6
Break-even live
UW: 25.0% down · 7.5% · 30yr · 1.5% tax · 5.0% vac · 8.0% maint · 8.0% mgmt
Financing live
Cash to close
- Down payment
- $57,500
- Closing costs
- $6,900
- Reserves months
- —
- Total cash needed
- —
Loan-product check · same deal, 3 products live
Conventional
25% down · 7.5% · 30yr
- Down + closing
- —
- Monthly P&I
- —
- Monthly cashflow
- —
- DSCR
- —
- Eligible?
- —
Personal DTI + credit; lowest rate.
DSCR
20% down · 8.5% · 30yr
- Down + closing
- —
- Monthly P&I
- —
- Monthly cashflow
- —
- DSCR
- —
- Eligible?
- —
No personal income docs; deal must DSCR.
Hard money
10% down · 12.0% · 12mo
- Down + closing
- —
- Monthly P&I
- —
- Monthly cashflow
- —
- DSCR
- —
- Eligible?
- —
Short-term bridge; refi at stabilization.
Listing history 31 events
-
2026-06-18days on market $230,000 Active 23 DOM
-
2026-06-17days on market $230,000 Active 22 DOM
-
2026-06-16days on market $230,000 Active 21 DOM
-
2026-06-15days on market $230,000 Active 20 DOM
-
2026-06-13days on market $230,000 Active 18 DOM
-
2026-06-13days on market $230,000 Active 17 DOM
-
2026-06-09days on market $230,000 Active 14 DOM
-
2026-06-08days on market $230,000 Active 13 DOM
-
2026-06-07days on market $230,000 Active 12 DOM
-
2026-06-04days on market $230,000 Active 9 DOM
-
2026-06-03days on market $230,000 Active 8 DOM
-
2026-06-02days on market $230,000 Active 7 DOM
-
2026-06-01days on market $230,000 Active 6 DOM
-
2026-05-31days on market $230,000 Active 5 DOM
-
2026-05-26$230,000 Active
-
2026-04-23status Pending
-
2026-04-22historical
-
2026-03-31$229,900 Active
-
2024-02-26historical
-
2024-02-20price $115,000
-
2024-02-13price $129,000
-
2024-02-09price $129,900
-
2024-01-30$130,000 Active
-
2006-04-19soldstatus $114,000
-
2006-03-31soldstatus $114,000
-
2006-01-27historical
-
2006-01-21$114,000
-
2005-03-16soldstatus $100,000
-
2005-03-11soldstatus $100,000
-
2005-02-05historical
-
2004-07-02$100,000
ⓘ Source: listings_history table (triggers on properties + properties_extension) + one-shot
backfill from property_details.listing_events for pre-trigger history.
Tax reassessment forecast NJ · Partial reset (capped growth)
- Current annual tax
- $3,655 · $305/mo
- Projected year-2 tax
- $4,691 · $391/mo
- Expected delta
- +$1,036/yr (+$86/mo · 28.3%)
ⓘ Screening estimate from a state-policy table — verify with the county assessor before closing.
Climate risk First Street
- Flood 1/10 Low FEMA zone X (unshaded) · 0% chance over 30 yrs
- Wildfire 1/10 Low
- Heat 6/10 Major 7 d/yr ≥104°F today · 14 d/yr by 30 yrs out
- Wind 6/10 Major 27% chance of damaging wind over 30 yrs
- Air quality 3/10 Moderate 2 unhealthy d/yr today · 5 by 30 yrs out
Nearby sold comps map
Loading sold comps map…
Walkable amenities ~0.75 mi
Loading nearby amenities…
Taxation est. · year 1
- Rental income
- $24,498
- − Mortgage interest
- −$12,884
- − Property taxes
- −$3,655
- − Insurance
- −$1,150
- − Repairs & maintenance
- −$1,960
- − Management
- −$1,960
- − Depreciation
- −$6,691
- Taxable loss
- −$3,802
- Est. tax savings @ 24.0%
- +$912
- After-tax cash flow
- $986/yr
For passive investors: Depreciation is non-cash, so a rental often shows a tax loss while cash-flowing — sheltering income. Rental losses are passive: they offset passive income freely, and up to $25,000/yr can offset ordinary (W-2) income if you actively participate and your MAGI is under $100k (phasing out to $0 by $150k); unused losses carry forward. On sale, claimed depreciation is recaptured at up to 25%, and gains may owe capital-gains tax (a 1031 exchange can defer both). Figures are a year-1 estimate at your 24.0% rate — not tax advice; consult a CPA.
Schools (NCES district)
- District
- East Greenwich Township School District
- NCES district ID
- 3404140
- Math proficiency
- 38% ▼ -27.00%
- Reading proficiency
- 59% ▼ -12.00%
- Median HH income
- $106,820
- Composite
- 46.89/100
- National rank
- #2367
- State rank
- #119 of 472 in NJ
Livability — Mount Royal
No livability data for this city. (Only ~50 U.S. cities are tracked.)
Census & demographics
- Census place
- Mount Royal, NJ
- Population (ZIP)
- 4,411
Population outlook (Gloucester County) Hauer SSP2
- Today (2025)
- 298,895 people
- By 2030
- 299,031 · +0.0%
- By 2040
- 294,020 · -1.6%
- By 2050
- 284,188 · -4.9%
- By 2075
- 260,720 · -12.8%
- By 2100
- 229,565 · -23.2%
Race, ethnicity, and origin ACS 2023
- Neighborhood character
- Predominantly White (84%)
- Race & ethnicity
- White 84% Black 9% Two or more races 5% Hispanic / Latino 4% Asian 1%
- Common ancestry
- Romanian 7% English 2% Scotch-Irish 2%
- Foreign-born
- 8%
- Languages at home
- 84% English-only · Arabic 8% Spanish 3% Other Asian/Pacific 2%
Political lean MEDSL · Gloucester
- 2024 margin
- Toss-up / Even · D 47.8% · R 50.6% · Other 1.6%
- 2008→2024 swing
- -15.0pp toward R · 2008: 12.2pp · 2024: -2.8pp
- All cycles
- 2024: R+2.8 2020: D+1.9 2016: R+0.4 2012: D+10.5 2008: D+12.2
Not yet ingested
- Civics
- —
Market trends
- HPI YoY
- ▲ 12.30%
- Current HPI
- 283.4103
- Rent YoY
- —
- Metro
- —
- State GDP YoY
- ▲ 2.05%
- F500 in state
- 34
Industry mix (Fortune 500 HQ in NJ)
| Industry | F500 HQs | Revenue |
|---|---|---|
| Consumer Goods | 3 | $31B |
|
||
| Pharmaceuticals | 2 | $153B |
|
||
| Technology | 2 | $21B |
|
||
| Insurance | 2 | $20B |
|
||
| Healthcare | 2 | $19B |
|
||
| Financial Services | 1 | $70B |
|
||
Price history
+130.0% since first listed17 events — show timeline
- 2026-05-26 Listed $230,000 BRIGHT MLS
- 2026-04-23 Pending — BRIGHT MLS
- 2026-04-22 Listing Removed — BRIGHT MLS
- 2026-03-31 Listed $229,900 BRIGHT MLS
- 2024-02-26 Listing Removed — BRIGHT MLS
- 2024-02-20 Price Changed $115,000 BRIGHT MLS
- 2024-02-13 Price Changed $129,000 BRIGHT MLS
- 2024-02-09 Price Changed $129,900 BRIGHT MLS
- 2024-01-30 Listed $130,000 BRIGHT MLS
- 2006-04-19 Sold (Public Records) $114,000 Public Records
- 2006-03-31 Sold (MLS) $114,000 BRIGHT MLS
- 2006-01-27 Listing Removed — BRIGHT MLS
- 2006-01-21 Listed $114,000 BRIGHT MLS
- 2005-03-16 Sold (Public Records) $100,000 Public Records
- 2005-03-11 Sold (MLS) $100,000 BRIGHT MLS
- 2005-02-05 Listing Removed — BRIGHT MLS
- 2004-07-02 Listed $100,000 BRIGHT MLS
Property tax history
+2.3%/yrLatest (2025): $3,655 · +0.3% YoY. Source: county tax records.
Cash-flow waterfall
monthlySold comps — $/sqft
last 12 mo · ≤1 miLoading sold comps…