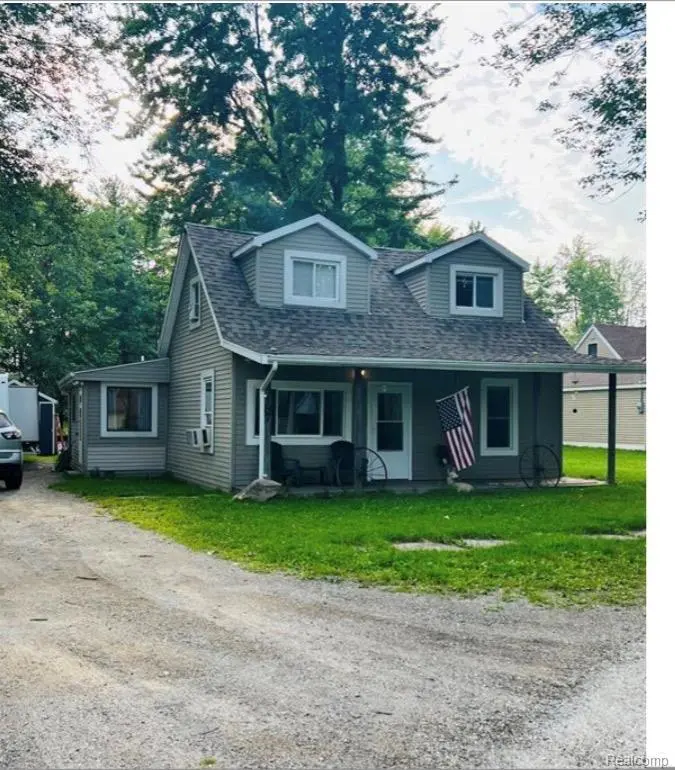
3187 2nd St · Emmett, MI
Flood risk 1/10 · Minimal
- FEMA flood zone
- X (unshaded)
- Chance of flooding over 30 yrs
- 0.0%
- Est. flood insurance / yr
- $507 – $1,088
Fire risk 1/10 · Minimal
- Est. fire insurance / yr
- $784 – $1,456
Heat risk 2/10 · Minimal
- Hot days now (above 97°F)
- 7 days/yr
- Hot days in 30 yrs
- 14 days/yr
Wind risk 1/10 · Minimal
- Chance of severe wind over 30 yrs
- —
Air-quality risk 3/10 · Minor
- Unhealthy air days now
- 2 days/yr
- Unhealthy air days in 30 yrs
- 4 days/yr
Risk factors via First Street. Map © Google.
Why this score? — see what drove the C- grade
The composite is a weighted blend of 9 inputs, each scored 0–100. Each bar is that input's sub-score; the figure is the points it added to the 100-point composite (weight × sub-score).
- Cash flow +16.5/30.0
- ARV discount +15.0/15.0
- DSCR +5.1/10.0
- Schools +4.4/10.0
- 1% rule +3.1/10.0
- Livability +3.1/5.0
- Rent growth +2.5/5.0
- Condition / age +2.5/5.0
- Appreciation +0.0/10.0
$150,000
🖨 Deal sheet 📄 Offer letter ✓ Due diligence
Listing remarks MLS
Welcome to this fixer upper situated on over an acre. Prefect for a small homestead. So much potential. High ceilings in family room. AS IS SALE
Key facts
- Small homestead
- Over an acre
- 1.26 acre lot
Tags
Neighborhood map
What this means for you Summary
Snapshot
- This is a 3-bed/1.5-bath single-family listed at $150k.
Deal economics
- At list price, monthly cash flow is $88 ($1k/yr) — positive.
- The deal already cash-flows at list — no discount required.
- To meet the 1% rule (rent ≥ 1% of price), the offer needs to be $122k (18.7% below list).
- Recommended offer: $122k (18.7% below list) — sets the bar for 1% rule.
Location & tenants
- Location reads 61/100 on livability (#561 in MI) — a middle-class / working-renter tenant base. Strengths: cost of living A+, housing A+, employment A-; Watch: crime C-, amenities F, commute F.
- Yale Public Schools (rural): math 40% / reading 62% proficiency, ranked #92 of 540 in MI (top 17%) — acceptable for families but not a draw, mixed tenant base, ~2y average lease.
- Market conditions: 14 active listings in the ZIP; 232 units permitted in St. Clair County in 2024 (0 in 5+ unit buildings).
Forward outlook
- Local home prices are declining (-3.0%/yr); year-one equity from $1k of loan paydown is wiped out by about $4k of value loss. Plan a longer hold.
- St. Clair County population projected at -20% by 2050 — secular population decline; favor cash flow + early exit over multi-decade hold.
Negotiation context
- It's been on market 79 days — a 6% lower offer ($141k) is reasonable based on typical stale-listing flexibility.
- 7 sale attempts since 21y ago with the ask held roughly flat each time — persistent listings suggest the price (not the market) is what's stuck; bring a comps-based counter.
Risks & watch-outs
- Watch-outs: built in 1940 — expect roof / HVAC / electrical / plumbing capex.
Questions for the listing agent
- It's been on market 79 days. Have you received any prior offers? Is the seller open to a 19% concession, seller financing, or rate buy-down credit?
- Built in 1940 — when were the roof, HVAC, electrical panel, plumbing, and water heater last replaced?
- Why hasn't it sold? Are there any deal-killer items the seller is aware of (foundation, flood, title, zoning, code violations)?
- Is there a deadline driving the sale (1031 exchange, divorce, estate, relocation)? That informs how much negotiation room exists.
- Schools are B-rated — typically a magnet for longer-tenancy family renters. What's the average tenant stay here, and is there a school-zone premium baked into asking?
- What's the average days-on-market for RENTAL listings here right now (not sales)? A rising rental-DOM trend means longer vacancies and softer asking-rent achievability than the comps imply.
- What's the recent tenant-quality profile in this submarket — average credit score on applications, eviction rate, late-payment / NSF rate, and stable-employment percentage? A property-management company in the area should have these aggregated.
- How much new for-sale + rental construction is in the pipeline within 1–3 miles? Heavy new supply typically softens prices + rents 12–24 months out; constrained supply supports both.
Investment metrics
- 1% rule
- 0.81% ✗
- Cap rate
- 7.00%
- Cash-on-cash
- 2.52%
- DSCR
- 1.11
- GRM
- 10.2
CMA / ARV
- ARV (median comp)
- $248,125
- List price
- $150,000
- Delta
- -39.55%
- Verdict
- UNDERPRICED
- Comps
- 6 within 1.0 mi
Show comp detail 3 sales within ~0.75 mi
| Address | Dist | Beds/Ba | Sqft | Sold | Price | $/sf | Match |
|---|---|---|---|---|---|---|---|
| 3195 2nd St | 0.02mi | 3/2.0 | 1,620 (+11%) | 23mo | $253,000 | $156 | 60 |
| 10676 Brandon Rd | 0.56mi | 3/1.0 | 1,296 (-11%) | 2mo | $228,000 | $176 | 52 |
| 11023 Brandon Rd | 0.25mi | 3/2.0 | 1,675 (+15%) | 14mo | $405,000 | $242 | 50 |
Match score weights: distance 35% · size 25% · config 20% · recency 20%. Top-matched comps best support the ARV.
Projected returns pro-forma
-3.0% appreciation · 3.0% rent growth · sell at horizon
- IRR
- -12.4%
- Equity multiple
- 0.55×
- Total profit
- $-18,772
- Equity at exit
- $22,365
- IRR
- -3.4%
- Equity multiple
- 0.78×
- Total profit
- $-9,443
- Equity at exit
- $12,969
Cash invested: $42,000 (down + closing). Projections, not guarantees.
Landlord ↔ Tenant lean methodology
- Overall (STATE)
- 62 Landlord-Friendly
- State Michigan
- 62 Landlord-Friendly · EVEN
- County
- — inherits STATE
- City
- — inherits STATE
ZIP-level market 48022
- Home prices YoY
- -8.3%
- Active inventory
- 14
- Price-to-rent
- 10.2×
Monthly cashflow live
- Estimated rent
- $1,220 medium interval (Pro) →
- Mortgage (P&I)
- −$787
- Tax from tax record
- −$27 /mo · $320/yr
- Insurance
- −$62
- HOA
- −$0
- Vacancy / Maint / Mgmt
- −$256
- Net cashflow
- $88
Break-even live
UW: 25.0% down · 7.5% · 30yr · 1.5% tax · 5.0% vac · 8.0% maint · 8.0% mgmt
Financing live
Cash to close
- Down payment
- $37,500
- Closing costs
- $4,500
- Reserves months
- —
- Total cash needed
- —
Loan-product check · same deal, 3 products live
Conventional
25% down · 7.5% · 30yr
- Down + closing
- —
- Monthly P&I
- —
- Monthly cashflow
- —
- DSCR
- —
- Eligible?
- —
Personal DTI + credit; lowest rate.
DSCR
20% down · 8.5% · 30yr
- Down + closing
- —
- Monthly P&I
- —
- Monthly cashflow
- —
- DSCR
- —
- Eligible?
- —
No personal income docs; deal must DSCR.
Hard money
10% down · 12.0% · 12mo
- Down + closing
- —
- Monthly P&I
- —
- Monthly cashflow
- —
- DSCR
- —
- Eligible?
- —
Short-term bridge; refi at stabilization.
Listing history 27 events
-
2026-06-18days on market $150,000 Active 79 DOM
-
2026-06-17days on market $150,000 Active 78 DOM
-
2026-06-16days on market $150,000 Active 77 DOM
-
2026-06-15days on market $150,000 Active 76 DOM
-
2026-06-13days on market $150,000 Active 74 DOM
-
2026-06-09days on market $150,000 Active 70 DOM
-
2026-06-08days on market $150,000 Active 69 DOM
-
2026-06-07days on market $150,000 Active 68 DOM
-
2026-06-04days on market $150,000 Active 65 DOM
-
2026-06-03days on market $150,000 Active 64 DOM
-
2026-06-02days on market $150,000 Active 63 DOM
-
2026-06-01days on market $150,000 Active 62 DOM
-
2026-05-31days on market $150,000 Active 61 DOM
-
2026-03-31$155,000 Active 144-char remark
Show marketing remark (144 chars)
Welcome to this fixer upper situated on over an acre. Prefect for a small homestead. So much potential. High ceilings in family room. AS IS SALE
-
2026-03-31$155,000 Active 144-char remark
Show marketing remark (144 chars)
Welcome to this fixer upper situated on over an acre. Prefect for a small homestead. So much potential. High ceilings in family room. AS IS SALE
-
2023-11-13historical
-
2023-11-13historical
-
2023-10-11price $139,900
-
2023-10-11price $139,900
-
2023-08-07$142,000 Active
-
2023-08-02$142,000 Active
-
2014-10-17historical
-
2014-10-17historical
-
2014-06-09$65,000
-
2014-06-09$65,000
-
2006-01-19historical
-
2005-09-25$119,900
ⓘ Source: listings_history table (triggers on properties + properties_extension) + one-shot
backfill from property_details.listing_events for pre-trigger history.
Tax reassessment forecast MI · Partial reset (capped growth)
- Current annual tax
- $320 · $27/mo
- Projected year-2 tax
- $1,315 · $110/mo
- Expected delta
- +$995/yr (+$83/mo · 310.8%)
ⓘ Screening estimate from a state-policy table — verify with the county assessor before closing.
Climate risk First Street
- Flood 1/10 Low FEMA zone X (unshaded) · 0% chance over 30 yrs
- Wildfire 1/10 Low
- Heat 2/10 Low 7 d/yr ≥97°F today · 14 d/yr by 30 yrs out
- Wind 1/10 Low
- Air quality 3/10 Moderate 2 unhealthy d/yr today · 4 by 30 yrs out
Nearby sold comps map
Loading sold comps map…
Walkable amenities ~0.75 mi
Loading nearby amenities…
Taxation est. · year 1
- Rental income
- $14,642
- − Mortgage interest
- −$8,402
- − Property taxes
- −$320
- − Insurance
- −$750
- − Repairs & maintenance
- −$1,171
- − Management
- −$1,171
- − Depreciation
- −$4,364
- Taxable loss
- −$1,537
- Est. tax savings @ 24.0%
- +$369
- After-tax cash flow
- $1,427/yr
For passive investors: Depreciation is non-cash, so a rental often shows a tax loss while cash-flowing — sheltering income. Rental losses are passive: they offset passive income freely, and up to $25,000/yr can offset ordinary (W-2) income if you actively participate and your MAGI is under $100k (phasing out to $0 by $150k); unused losses carry forward. On sale, claimed depreciation is recaptured at up to 25%, and gains may owe capital-gains tax (a 1031 exchange can defer both). Figures are a year-1 estimate at your 24.0% rate — not tax advice; consult a CPA.
Schools (NCES district)
- District
- Yale Public Schools
- NCES district ID
- 2636600
- Math proficiency
- 40% ▼ -11.00%
- Reading proficiency
- 62% ▼ -8.00%
- Median HH income
- $53,116
- Composite
- 43.83/100
- National rank
- #2926
- State rank
- #92 of 540 in MI
Livability — Emmett
- Score
- 61/100
- State rank
- #561
- US rank
- #17612
Category grades
Schools grade is shown separately in the Schools card above.
Census & demographics
- Census place
- Emmett, MI
- Population (ZIP)
- 2,517
Population outlook (St. Clair County) Hauer SSP2
- Today (2025)
- 154,587 people
- By 2030
- 150,031 · -2.9%
- By 2040
- 138,177 · -10.6%
- By 2050
- 124,390 · -19.5%
- By 2075
- 95,825 · -38.0%
- By 2100
- 68,672 · -55.6%
Race, ethnicity, and origin ACS 2023
- Neighborhood character
- Predominantly White (98%)
- Race & ethnicity
- White 98% Two or more races 2%
- Common ancestry
- Romanian 13% Lithuanian 7% English 4%
- Foreign-born
- 1%
Political lean MEDSL · St. Clair
- 2024 margin
- Solid R (+34.6) · D 32.0% · R 66.6% · Other 1.4%
- 2008→2024 swing
- -37.3pp toward R · 2008: 2.6pp · 2024: -34.6pp
- All cycles
- 2024: R+34.6 2020: R+30.2 2016: R+31.4 2012: R+7.1 2008: D+2.6
Not yet ingested
- Civics
- —
Market trends
- HPI YoY
- ▼ -23.76%
- Current HPI
- 262.9242
- Rent YoY
- —
- Metro
- —
- State GDP YoY
- ▲ 1.37%
- F500 in state
- 28
Industry mix (Fortune 500 HQ in MI)
| Industry | F500 HQs | Revenue |
|---|---|---|
| Automotive Parts | 3 | $48B |
|
||
| Automotive | 2 | $372B |
|
||
| Chemicals | 1 | $45B |
|
||
| Automotive Retail | 1 | $29B |
|
||
| Healthcare / Medical Devices | 1 | $23B |
|
||
| Automotive Technology | 1 | $20B |
|
||
Price history
+29.3% since first listed14 events — show timeline
- 2026-03-31 Listed $155,000 REALCOMP
- 2026-03-31 Listed $155,000 MiRealSource-MiMLS
- 2023-11-13 Listing Removed — MiRealSource-MiMLS
- 2023-11-13 Listing Removed — REALCOMP
- 2023-10-11 Price Changed $139,900 MiRealSource-MiMLS
- 2023-10-11 Price Changed $139,900 REALCOMP
- 2023-08-07 Listed $142,000 REALCOMP
- 2023-08-02 Listed $142,000 MiRealSource-MiMLS
- 2014-10-17 Listing Removed — MiRealSource-MiMLS
- 2014-10-17 Listing Removed — REALCOMP
- 2014-06-09 Listed $65,000 MiRealSource-MiMLS
- 2014-06-09 Listed $65,000 REALCOMP
- 2006-01-19 Listing Removed — MiRealSource-MiMLS
- 2005-09-25 Listed $119,900 MiRealSource-MiMLS
Property tax history
-17.6%/yrLatest (2025): $320 · -85.9% YoY. Source: county tax records.
Cash-flow waterfall
monthlySold comps — $/sqft
last 12 mo · ≤1 miLoading sold comps…