 🌊 Lakefront
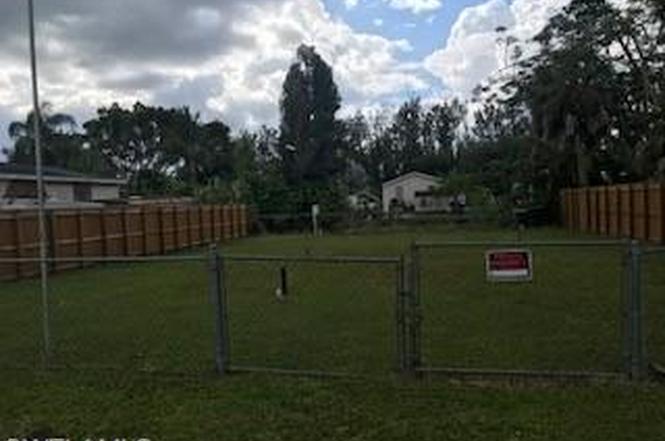
93 Isle Of Saint · Marco Shores-Hammock Bay, FL
Flood risk 9/10 · Severe
- FEMA flood zone
- AE
- Chance of flooding over 30 yrs
- 0.99%
- Est. flood insurance / yr
- $1,737 – $8,500
Fire risk 4/10 · Minor
- Est. fire insurance / yr
- $947 – $1,759
Heat risk 10/10 · Severe
- Hot days now (above 107°F)
- 6 days/yr
- Hot days in 30 yrs
- 24 days/yr
Wind risk 10/10 · Severe
- Chance of severe wind over 30 yrs
- 99.0%
Air-quality risk 3/10 · Minor
- Unhealthy air days now
- 3 days/yr
- Unhealthy air days in 30 yrs
- 3 days/yr
Risk factors via First Street. Map © Google.
Why this score? — see what drove the B+ grade
The composite is a weighted blend of 9 inputs, each scored 0–100. Each bar is that input's sub-score; the figure is the points it added to the 100-point composite (weight × sub-score).
- Cash flow +30.0/30.0
- 1% rule +10.0/10.0
- DSCR +10.0/10.0
- ARV discount +7.5/15.0
- Schools +5.0/10.0
- Appreciation +4.3/10.0
- Rent growth +3.3/5.0
- Livability +2.5/5.0
- Condition / age +2.5/5.0
$279,000
🖨 Deal sheet 📄 Offer letter ✓ Due diligence
Listing remarks MLS
Are you looking for the lot that already has Electric, Sewer and Water, private fence all with a water view and NO HOA fees? Look no further, ready for your new manufactured home with room to store your boat. Port Au Prince is centrally located giving you access to the local boat launch and community services. Just a short drive to Marco Island, beaches and more.
Key facts
- Newer house
- Outdoor
- Kitchen flows
Tags
Property features AI
Finance
- Other: Lot is approximately 0.14 acres; Regular lot with dimensions approximately 58 x 105 x 58 x 105; Lot/Unit number 93
- HOA & community: Non-gated community; No HOA maintenance; No community amenities
Exterior
- Parking: 1-floor property (single-story layout indicated)
- Utilities: Central water; Central sewer; Cable available
- Home design: Residential manufactured home; Split level; Built in 2020; Rear faces west; Located in Port Au Prince development
- Construction: Manufactured construction; Vinyl siding; Shingle roof; Double-hung windows
- Exterior features: Storage; Canal frontage / waterfront view; Canal width 1-30
Interior
- Kitchen: Dishwasher; Microwave; Range; Refrigerator
- Bedrooms: 3 bedrooms
- Flooring: Laminate
- Bathrooms: 2 full bathrooms; Master bath with dual sinks and separate tub and shower
- Heating & cooling: Central electric heat; Central electric cooling
- Interior features: Pantry; Dining area open to living space; Laundry in residence; Furnished; Split-bedroom floor plan
- Laundry & utility: Laundry in residence
Neighborhood map
What this means for you Summary
Snapshot
- This is a 3-bed/2.0-bath manufactured listed at $279k.
Deal economics
- At list price, monthly cash flow is $3k ($32k/yr) — positive.
- The deal already cash-flows at list — no discount required.
- Meets the 1% rule at list price ($6k rent vs $279k).
- Recommended offer: $246k (12.0% below list) — sets the bar for market timing.
Location & tenants
- Location reads: area grade B — affects rentability + tenant quality, not the cash-flow math above.
- Collier (suburban): math 60% / reading 56% proficiency, ranked #16 of 73 in FL (top 22%) — acceptable for families but not a draw, mixed tenant base, ~2y average lease.
- Market conditions: Rents rising (+3.2%/yr); 900 active listings in the ZIP; 19 comparable units currently listed for rent nearby; rentals at typical pace (median 24d on market — plan ~3-4 weeks tenant-placement turnaround); solid renter incomes; 3,520 units permitted in Collier County in 2024 (959 in 5+ unit buildings).
- At $6,076/mo this rent would consume 82% of the median local household income ($89k/yr) (locally 550% of renters already pay >50% of income on rent) — very limited rent-growth headroom before tenants either downsize or default.
Forward outlook
- Local home prices are declining (-1.5%/yr); year-one equity from $2k of loan paydown is wiped out by about $4k of value loss. Plan a longer hold.
- Collier County population projected at +30% by 2050 — long-run rental-demand tailwind backs the buy-and-hold thesis.
- At projected returns (-1.5% appreciation + 3.2% rent growth), your $78k cash investment doubles in ~3 years — after that, you're playing with house money.
Negotiation context
- It's been on market 162 days — a 12% lower offer ($246k) is reasonable based on typical stale-listing flexibility.
- 3 sale attempts since 7y ago; this cycle's ask has dropped $116k (29%) from the opening price — seller is motivated, your offer sets the floor, not the list.
- Current owner paid $58k; list at $279k implies a 381% gain — meaningful room to come down on a strong offer.
Risks & watch-outs
- Watch-outs: flood insurance adds $427/mo.
- Climate carrying-cost: in FEMA flood zone AE (mandatory federal flood insurance); severe wind risk, 99% chance of damaging wind over 30y; extreme-heat days projected 6→24/yr by 2055 (HVAC capex compounding) — expect insurance premiums to compound above CPI over the hold.
Questions for the listing agent
- It's been on market 162 days. Have you received any prior offers? Is the seller open to a 12% concession, seller financing, or rate buy-down credit?
- What's the actual annual flood-insurance premium (NFIP or private), and is the property in a SFHA with mandatory coverage?
- Why hasn't it sold? Are there any deal-killer items the seller is aware of (foundation, flood, title, zoning, code violations)?
- Is there a deadline driving the sale (1031 exchange, divorce, estate, relocation)? That informs how much negotiation room exists.
- This sits on a lake — are riparian / water-frontage rights deeded with the parcel? Any dock permits, shoreline easements, or HOA water-use restrictions?
- What's the documented flood / surge / shoreline-erosion history here (FEMA AND non-FEMA — e.g., storm surge, creek backup, septic-field saturation)?
- Any water-quality or seasonal algae-bloom issues that affect tenant satisfaction or short-term-rental demand?
- What's the average days-on-market for RENTAL listings here right now (not sales)? A rising rental-DOM trend means longer vacancies and softer asking-rent achievability than the comps imply.
- What's the recent tenant-quality profile in this submarket — average credit score on applications, eviction rate, late-payment / NSF rate, and stable-employment percentage? A property-management company in the area should have these aggregated.
- How much new for-sale + rental construction is in the pipeline within 1–3 miles? Heavy new supply typically softens prices + rents 12–24 months out; constrained supply supports both.
Investment metrics
- 1% rule
- 2.18% ✓
- Cap rate
- 19.66%
- Cash-on-cash
- 47.73%
- DSCR
- 3.12
- GRM
- 3.8
CMA / ARV
No comps found within radius.
Projected returns pro-forma
-1.48% appreciation · 3.21% rent growth · sell at horizon
- IRR
- 40.3%
- Equity multiple
- 2.86×
- Total profit
- $145,222
- Equity at exit
- $60,965
- IRR
- 45.1%
- Equity multiple
- 5.73×
- Total profit
- $369,130
- Equity at exit
- $58,726
Cash invested: $78,120 (down + closing). Projections, not guarantees.
Landlord ↔ Tenant lean methodology
- Overall (STATE)
- 87 Strongly Landlord-Friendly
- State Florida
- 87 Strongly Landlord-Friendly · R+3
- County
- — inherits STATE
- City
- — inherits STATE
ZIP-level market 34114
- Home prices YoY
- -0.6%
- Rents YoY
- 3.2%
- Active inventory
- 900
- Price-to-rent
- 3.8×
Monthly cashflow live
- Estimated rent
- $6,076 high interval (Pro) →
- Mortgage (P&I)
- −$1,463
- Tax from tax record
- −$113 /mo · $1,360/yr
- Insurance
- −$116
- Flood insurance flood zone
- −$427 /mo · $5,118/yr
- HOA
- −$0
- Vacancy / Maint / Mgmt
- −$1,276
- Net cashflow
- $2,681
Break-even live
UW: 25.0% down · 7.5% · 30yr · 1.5% tax · 5.0% vac · 8.0% maint · 8.0% mgmt
Financing live
Cash to close
- Down payment
- $69,750
- Closing costs
- $8,370
- Reserves months
- —
- Total cash needed
- —
Loan-product check · same deal, 3 products live
Conventional
25% down · 7.5% · 30yr
- Down + closing
- —
- Monthly P&I
- —
- Monthly cashflow
- —
- DSCR
- —
- Eligible?
- —
Personal DTI + credit; lowest rate.
DSCR
20% down · 8.5% · 30yr
- Down + closing
- —
- Monthly P&I
- —
- Monthly cashflow
- —
- DSCR
- —
- Eligible?
- —
No personal income docs; deal must DSCR.
Hard money
10% down · 12.0% · 12mo
- Down + closing
- —
- Monthly P&I
- —
- Monthly cashflow
- —
- DSCR
- —
- Eligible?
- —
Short-term bridge; refi at stabilization.
Rent comps 19 comps
| Address | Beds | Baths | Sqft | Rent | $/sqft | DOM | Units | Dist |
|---|---|---|---|---|---|---|---|---|
| 8365 Whisper Trace Way Unit L204 Naples, FL | 3.0 | 2.0 | 1752 | $6,500 | $3.71 | 14d | 1 | 0.17mi |
| 268 Indies Dr E #102 Naples, FL | 2.0 | 2.0 | 1537 | $7,500 | $4.88 | 23d | 1 | 0.19mi |
| 8355 Whisper Trace Way Unit K104 Naples, FL | 3.0 | 2.0 | 1674 | $6,500 | $3.88 | 14d | 1 | 0.19mi |
| 286 Indies Dr E Unit 202 Naples, FL | 3.0 | 2.0 | 1509 | $3,200 | $2.12 | 23d | 1 | 0.21mi |
| 262 Indies Dr E Unit 101 Naples, FL | 3.0 | 2.0 | 1537 | $7,500 | $4.88 | 23d | 1 | 0.21mi |
| 244 Indies Dr E #101 Naples, FL | 3.0 | 2.0 | 1537 | $7,500 | $4.88 | 21d | 1 | 0.23mi |
| 163 Indies Dr E #203 Naples, FL | 2.0 | 2.0 | 1448 | $7,200 | $4.97 | 23d | 1 | 0.24mi |
| 163 Indies Dr E #106 Naples, FL | 3.0 | 2.0 | 1698 | $7,500 | $4.42 | 23d | 1 | 0.24mi |
| 163 Indies Dr E #206 Naples, FL | 3.0 | 2.0 | 1698 | $6,000 | $3.53 | 23d | 1 | 0.24mi |
| 232 Indies Dr E #101 Naples, FL | 3.0 | 2.0 | 1537 | $7,500 | $4.88 | 23d | 1 | 0.26mi |
| 4650 Hawks Nest Way Unit M202 Naples, FL | 3.0 | 2.0 | 1840 | $9,600 | $5.22 | 14d | 1 | 0.56mi |
| 4529 Cardinal Cove Ln #7 Naples, FL | 2.0 | 2.0 | 1539 | $6,500 | $4.22 | 23d | 1 | 0.64mi |
| 4680 Hawks Nest Way Unit D-103 Naples, FL | 2.0 | 2.0 | 1414 | $3,000 | $2.12 | 14d | 1 | 0.65mi |
| 4685 Hawks Nest Way #103 Naples, FL | 2.0 | 2.0 | 1440 | $6,500 | $4.51 | 14d | 1 | 0.68mi |
| 3955 Deer Crossing Ct #103 Naples, FL | 3.0 | 2.0 | 1812 | $7,500 | $4.14 | 23d | 1 | 0.76mi |
| 1305 Mainsail Dr Naples, FL | 2.0 | 2.0 | 871 | $1,912 | $2.19 | 21d | 2 | 1.42mi |
| 1305 Mainsail Dr Naples, FL | 2.0 | 2.0 | 925 | $1,862 | $2.01 | 23d | 2 | 1.42mi |
| 847 Enbrook Loop Naples, FL | 2.0 | 2.0 | 1503 | $2,950 | $1.96 | 23d | 1 | 1.46mi |
| 842 Enbrook Loop Naples, FL | 2.0 | 2.0 | 1503 | $2,800 | $1.86 | 23d | 1 | 1.48mi |
Listing history 20 events
-
2026-06-10days on market $279,000 Active 162 DOM
-
2026-06-09days on market $279,000 Active 161 DOM
-
2026-06-08days on market $279,000 Active 160 DOM
-
2026-06-07days on market $279,000 Active 159 DOM
-
2026-06-03days on market $279,000 Active 155 DOM
-
2026-06-02days on market $279,000 Active 154 DOM
-
2026-06-01days on market $279,000 Active 153 DOM
-
2026-05-31days on market $279,000 Active 152 DOM
-
2026-05-30days on market $279,000 Active 151 DOM
-
2026-05-19price $279,000
-
2026-04-15price $279,900
-
2026-04-15status Active
-
2026-03-30historical
-
2026-03-05price $325,000
-
2026-02-25price $360,000
-
2025-12-14$395,000 Active
-
2020-07-20soldstatus $58,000 Closed 366-char remark
Show marketing remark (366 chars)
Are you looking for the lot that already has Electric, Sewer and Water, private fence all with a water view and NO HOA fees? Look no further, ready for your new manufactured home with room to store your boat. Port Au Prince is centrally located giving you access to the local boat launch and community services. Just a short drive to Marco Island, beaches and more.
-
2020-05-25status Pending 366-char remark
Show marketing remark (366 chars)
Are you looking for the lot that already has Electric, Sewer and Water, private fence all with a water view and NO HOA fees? Look no further, ready for your new manufactured home with room to store your boat. Port Au Prince is centrally located giving you access to the local boat launch and community services. Just a short drive to Marco Island, beaches and more.
-
2019-10-03$58,000 Active 366-char remark
Show marketing remark (366 chars)
Are you looking for the lot that already has Electric, Sewer and Water, private fence all with a water view and NO HOA fees? Look no further, ready for your new manufactured home with room to store your boat. Port Au Prince is centrally located giving you access to the local boat launch and community services. Just a short drive to Marco Island, beaches and more.
-
1996-01-03soldstatus $15,000
ⓘ Source: listings_history table (triggers on properties + properties_extension) + one-shot
backfill from property_details.listing_events for pre-trigger history.
Tax reassessment forecast FL · Resets to sale price
- Current annual tax
- $1,360 · $113/mo
- Projected year-2 tax
- $2,316 · $193/mo
- Expected delta
- +$956/yr (+$80/mo · 70.3%)
ⓘ Screening estimate from a state-policy table — verify with the county assessor before closing.
Climate risk First Street
- Flood 9/10 Extreme FEMA zone AE · 99% chance over 30 yrs
- Wildfire 4/10 Moderate
- Heat 10/10 Extreme 6 d/yr ≥107°F today · 24 d/yr by 30 yrs out
- Wind 10/10 Extreme 99% chance of damaging wind over 30 yrs
- Air quality 3/10 Moderate 3 unhealthy d/yr today · 3 by 30 yrs out
Nearby sold comps map
Loading sold comps map…
Walkable amenities ~0.75 mi
Loading nearby amenities…
Taxation est. · year 1
- Rental income
- $72,910
- − Mortgage interest
- −$15,628
- − Property taxes
- −$1,360
- − Insurance
- −$6,514
- − Repairs & maintenance
- −$5,833
- − Management
- −$5,833
- − Depreciation
- −$8,116
- Taxable income
- $29,626
- Est. tax owed @ 24.0%
- −$7,110
- After-tax cash flow
- $25,058/yr
For passive investors: Depreciation is non-cash, so a rental often shows a tax loss while cash-flowing — sheltering income. Rental losses are passive: they offset passive income freely, and up to $25,000/yr can offset ordinary (W-2) income if you actively participate and your MAGI is under $100k (phasing out to $0 by $150k); unused losses carry forward. On sale, claimed depreciation is recaptured at up to 25%, and gains may owe capital-gains tax (a 1031 exchange can defer both). Figures are a year-1 estimate at your 24.0% rate — not tax advice; consult a CPA.
Schools (NCES district)
- District
- Collier
- NCES district ID
- 1200330
- Math proficiency
- 60% ▼ -4.00%
- Reading proficiency
- 56% ▼ -2.00%
- Median HH income
- $58,275
- Composite
- 50.23/100
- National rank
- #1892
- State rank
- #16 of 73 in FL
Livability — Marco Shores-Hammock Bay
No livability data for this city. (Only ~50 U.S. cities are tracked.)
Census & demographics
- County
- Collier County · 396,295 people
- Metro
- Naples-Marco Island, FL
- Population (ZIP)
- 23,559
- Household income
- $89,334
- Rent vs Own
- Severe rent burden
- 550.0
Population outlook (Collier County) Hauer SSP2
- Today (2025)
- 420,858 people
- By 2030
- 450,054 · +6.9%
- By 2040
- 502,232 · +19.3%
- By 2050
- 544,932 · +29.5%
- By 2075
- 627,203 · +49.0%
- By 2100
- 659,015 · +56.6%
Race, ethnicity, and origin ACS 2023
- Neighborhood character
- Predominantly White (72%)
- Race & ethnicity
- White 72% Hispanic / Latino 17% Two or more races 13% Black 7%
- Hispanic origin (detail)
- Mexican 7% Puerto Rican 1% Cuban 3%
- Common ancestry
- Hispanic 5% Romanian 4% Lithuanian 1%
- Foreign-born
- 21% · Canada, Jamaica
- Languages at home
- 75% English-only · Spanish 15% French/Haitian/Cajun 5% Other Indo-European 4%
Political lean MEDSL · Collier
- 2024 margin
- Solid R (+33.1) · D 33.1% · R 66.2%
- 2008→2024 swing
- -10.6pp toward R · 2008: -22.5pp · 2024: -33.1pp
- All cycles
- 2024: R+33.1 2020: R+24.7 2016: R+26.0 2012: R+30.1 2008: R+22.5
Not yet ingested
- Civics
- —
Market trends
- HPI YoY
- ▼ -1.48%
- Current HPI
- 266.5545
- Rent YoY
- ▲ 3.21%
- Metro
- Naples-Marco Island, FL
- State GDP YoY
- ▲ 3.28%
- F500 in state
- 36
Industry mix (Fortune 500 HQ in FL)
| Industry | F500 HQs | Revenue |
|---|---|---|
| Industrial Technology | 2 | $29B |
|
||
| Insurance | 2 | $17B |
|
||
| Retail | 1 | $60B |
|
||
| Technology Distribution | 1 | $58B |
|
||
| Homebuilding | 1 | $35B |
|
||
| Technology Manufacturing | 1 | $35B |
|
||
Price history
+1760.0% since first listed11 events — show timeline
- 2026-05-19 Price Changed $279,000 NAPLESMLS
- 2026-04-15 Price Changed $279,900 NAPLESMLS
- 2026-04-15 Relisted — NAPLESMLS
- 2026-03-30 Listing Removed — NAPLESMLS
- 2026-03-05 Price Changed $325,000 NAPLESMLS
- 2026-02-25 Price Changed $360,000 NAPLESMLS
- 2025-12-14 Listed $395,000 NAPLESMLS
- 2020-07-20 Sold (MLS) $58,000 FORTMLS
- 2020-05-25 Pending — FORTMLS
- 2019-10-03 Listed $58,000 FORTMLS
- 1996-01-03 Sold (Public Records) $15,000 Public Records
Property tax history
+14.2%/yrLatest (2025): $1,360 · +6.5% YoY. Source: county tax records.
Cash-flow waterfall
monthlySold comps — $/sqft
last 12 mo · ≤1 miLoading sold comps…