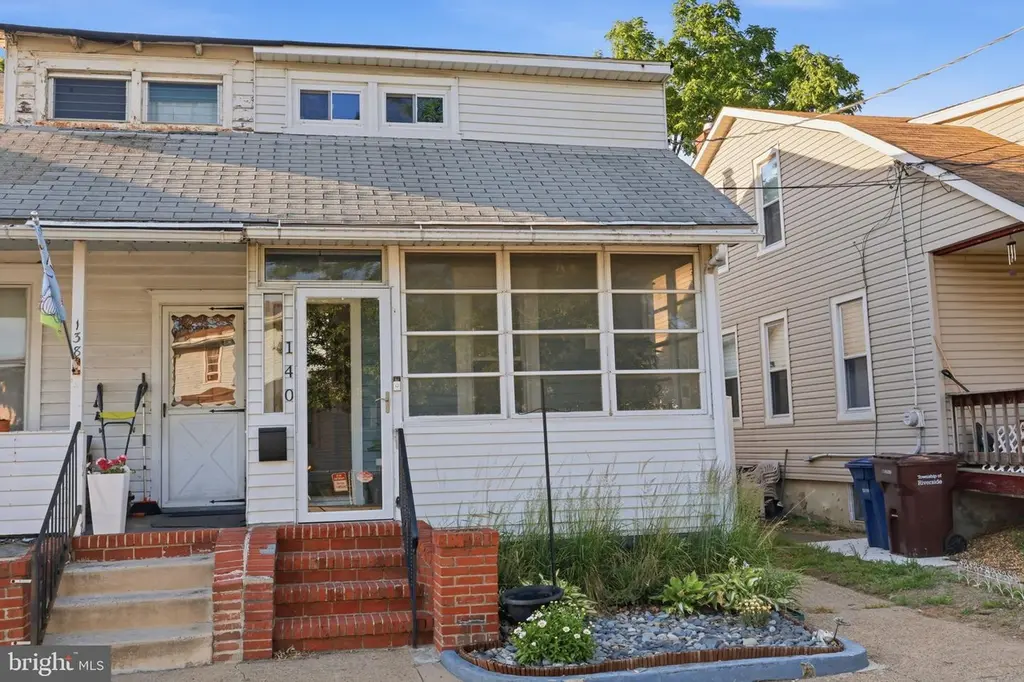
140 Paine St · Philadelphia, PA
Flood risk 1/10 · Minimal
- FEMA flood zone
- X (unshaded)
- Chance of flooding over 30 yrs
- 0.0%
- Est. flood insurance / yr
- $507 – $1,088
Fire risk 1/10 · Minimal
- Est. fire insurance / yr
- $526 – $976
Heat risk 6/10 · Moderate
- Hot days now (above 103°F)
- 7 days/yr
- Hot days in 30 yrs
- 15 days/yr
Wind risk 6/10 · Moderate
- Chance of severe wind over 30 yrs
- 27.0%
Air-quality risk 4/10 · Minor
- Unhealthy air days now
- 5 days/yr
- Unhealthy air days in 30 yrs
- 7 days/yr
Risk factors via First Street. Map © Google.
Why this score? — see what drove the D- grade
The composite is a weighted blend of 9 inputs, each scored 0–100. Each bar is that input's sub-score; the figure is the points it added to the 100-point composite (weight × sub-score).
- Cash flow +15.5/30.0
- DSCR +4.8/10.0
- ARV discount +4.5/15.0
- 1% rule +4.2/10.0
- Livability +3.9/5.0
- Rent growth +2.5/5.0
- Condition / age +2.5/5.0
- Schools +1.3/10.0
- Appreciation +0.0/10.0
$250,000
🖨 Deal sheet 📄 Offer letter ✓ Due diligence
Listing remarks MLS
0% NO MONEY DOWN USDA eligible. Welcome to Riverside and this fresh, NEWLY updated 3 Bedroom, 1 Bath lovely Twin home. This recently updated cozy home features 6 panel doors, moldings, lighting fixtures, recessed lights and has been freshly painted throughout. The home is located in the quaint town of Riverside nestled back in a quiet neighborhood and features great curb appeal with brick steps up to the front entry and a concrete walkway to the gate that encloses the back yard. Enter into a cozy three season room which leads to the living/dining room boasting recessed lighting and sleek laminate floors throughout. Make your way into the BRAND NEW kitchen boasting unbelievable finishes, including all new stainless steel appliances, maple cabinetry, granite countertops w/ large amount of counter space, recessed lighting and ceramic tile flooring is sure to bring out the chef in you. Access to the basement is also in the Kitchen. Located on the second floor are 3 bedrooms with ample closet space and an updated full bath, magnified with new vanity and anew tub w/ ceramic tile surround and floor tile. Head to the basement where you will find the new washer and dryer as well as ample storage space. Moving to the the backyard you will find a shed with plenty of space for hand and yard tools, Located in Riverside, this beautiful home has close access to Route 130. Make your appointment today and get ready to call this one "Home. "
Key facts
- Pool
- Built 1928
- Listed 10 days
Property features AI
Exterior
- Parking: On-street parking
- Utilities: Public water; Public sewer; Electric service
- Home design: Semi-detached property; Built year source: Assessor; Shingle roof
- Construction: Vinyl siding; Block foundation
- Exterior features: Above-ground personal pool; Lot dimensions approximately 20 x 100; Two or more access exits
Interior
- Bedrooms: One bedroom on the main level; Two bedrooms on the upper level
- Bathrooms: One full bathroom on the main level; One full bathroom total
- Heating & cooling: Forced air heating (natural gas); Central air conditioning (electric); Natural gas hot water
- Interior features: Cedar closets; Pantry; Drywall walls and ceilings; Partially finished basement; Entry-level bedroom
Neighborhood map
What this means for you Summary
Snapshot
- This is a 3-bed/1.0-bath townhouse listed at $250k.
Deal economics
- At list price, monthly cash flow is $100 ($1k/yr) — positive.
- The deal already cash-flows at list — no discount required.
- To meet the 1% rule (rent ≥ 1% of price), the offer needs to be $231k (7.8% below list).
- Recommended offer: $231k (7.8% below list) — sets the bar for 1% rule.
- Cap rate 6.8% vs local median 3.5% in Philadelphia — top-decile yield for the area; either an underpriced asset or a hidden risk that comps aren't pricing in. Stress-test before assuming the spread holds.
Location & tenants
- Location reads 77/100 on livability (#348 in PA, #3,054 nationally) — a middle-class / working-renter tenant base. Strengths: amenities A+, commute A+, cost of living A+; Watch: employment C-, schools D+, crime F.
- Riverside Township School District (suburban): math 5% / reading 23% proficiency, ranked #455 of 472 in NJ (top 96%) — low school quality limits family demand, transient renter base, plan for 1-2y turnover.
- Market conditions: 4 comparable units currently listed for rent nearby; rentals at typical pace (median 22d on market — plan ~3-4 weeks tenant-placement turnaround); solid renter incomes; 2,161 units permitted in Burlington County in 2024 (988 in 5+ unit buildings).
Forward outlook
- Local home prices are declining (-3.0%/yr); year-one equity from $2k of loan paydown is wiped out by about $8k of value loss. Plan a longer hold.
- Burlington County population projected to shrink 5% by 2050 — rents likely to lag national; underwrite the cash flow, not the appreciation.
Negotiation context
- Only 10 days on market — expect competitive offers; lowballing is unlikely to land.
- 2 sale attempts since 5y ago with the ask held roughly flat each time — persistent listings suggest the price (not the market) is what's stuck; bring a comps-based counter.
- Current owner paid $175k; 43% above their basis — modest negotiation headroom, anchor on the comps not their cost.
Risks & watch-outs
- Watch-outs: built in 1928 — expect roof / HVAC / electrical / plumbing capex.
- Climate carrying-cost: major wind risk, 27% chance of damaging wind over 30y; extreme-heat days projected 7→15/yr by 2055 (HVAC capex compounding) — expect insurance premiums to compound above CPI over the hold.
Questions for the listing agent
- Built in 1928 — when were the roof, HVAC, electrical panel, plumbing, and water heater last replaced?
- Is there a deadline driving the sale (1031 exchange, divorce, estate, relocation)? That informs how much negotiation room exists.
- Schools are D-rated, which usually means shorter tenancies and higher turnover. Who's the typical renter profile here, and what's been the actual vacancy rate?
- Crime grade is F in this area — have there been break-ins, vandalism, or insurance claims at this property in the last 3 years? What carrier currently insures it and at what premium?
- The area grade is low — what's the realistic commute time and amenity access for the typical tenant pool here? Any planned neighborhood developments (good or bad) we should know about?
- What's the average days-on-market for RENTAL listings here right now (not sales)? A rising rental-DOM trend means longer vacancies and softer asking-rent achievability than the comps imply.
- What's the recent tenant-quality profile in this submarket — average credit score on applications, eviction rate, late-payment / NSF rate, and stable-employment percentage? A property-management company in the area should have these aggregated.
- How much new for-sale + rental construction is in the pipeline within 1–3 miles? Heavy new supply typically softens prices + rents 12–24 months out; constrained supply supports both.
Investment metrics
- 1% rule
- 0.92% ✗
- Cap rate
- 6.77%
- Cash-on-cash
- 1.72%
- DSCR
- 1.08
- GRM
- 9.0
CMA / ARV
- ARV (on-the-fly)
- $234,252
- Comps found
- 12
Show comp detail 12 sales within ~0.75 mi
| Address | Dist | Beds/Ba | Sqft | Sold | Price | $/sf | Match |
|---|---|---|---|---|---|---|---|
| 500 Arndt Ave | 0.29mi | 2/1.0 (-1) | 974 (+0%) | 2mo | $235,000 | $241 | 80 |
| 506 Arndt Ave | 0.29mi | 2/1.0 (-1) | 974 (+0%) | 9mo | $256,000 | $263 | 73 |
| 36 Lee St | 0.18mi | 2/1.0 (-1) | 924 (-5%) | 13mo | $210,000 | $227 | 68 |
| 504 Arndt Ave | 0.29mi | 2/1.0 (-1) | 974 (+0%) | 19mo | $230,000 | $236 | 66 |
| 335 Middleton St | 0.07mi | 2/1.0 (-1) | 840 (-14%) | 11mo | $210,000 | $250 | 60 |
| 202 Filmore St | 0.29mi | 2/1.5 (-1) | 928 (-4%) | 21mo | $193,000 | $208 | 55 |
| 236 Filmore St | 0.27mi | 3/1.0 | 1,092 (+12%) | 18mo | $130,000 | $119 | 51 |
| 505 Delaware Ave | 0.33mi | 2/1.0 (-1) | 894 (-8%) | 19mo | $203,000 | $227 | 50 |
| 13 River Ln | 0.46mi | 2/2.0 (-1) | 1,080 (+11%) | 3mo | $262,000 | $243 | 49 |
| 323 Cleveland Ave | 0.35mi | 2/1.0 (-1) | 1,106 (+14%) | 9mo | $275,000 | $249 | 48 |
| 234 Kossuth St | 0.19mi | 2/2.0 (-1) | 1,091 (+12%) | 18mo | $221,660 | $203 | 47 |
| 206 W Washington St | 0.44mi | 2/1.0 (-1) | 864 (-11%) | 16mo | $230,000 | $266 | 43 |
Match score weights: distance 35% · size 25% · config 20% · recency 20%. Top-matched comps best support the ARV.
Projected returns pro-forma
-3.0% appreciation · 3.0% rent growth · sell at horizon
- IRR
- -13.5%
- Equity multiple
- 0.51×
- Total profit
- $-34,087
- Equity at exit
- $37,276
- IRR
- -4.6%
- Equity multiple
- 0.70×
- Total profit
- $-21,326
- Equity at exit
- $21,615
Cash invested: $70,000 (down + closing). Projections, not guarantees.
Monthly cashflow live
- Estimated rent
- $2,306 medium interval (Pro) →
- Mortgage (P&I)
- −$1,311
- Tax from tax record
- −$306 /mo · $3,675/yr
- Insurance
- −$104
- HOA
- −$0
- Vacancy / Maint / Mgmt
- −$484
- Net cashflow
- $100
Break-even live
UW: 25.0% down · 7.5% · 30yr · 1.5% tax · 5.0% vac · 8.0% maint · 8.0% mgmt
Financing live
Cash to close
- Down payment
- $62,500
- Closing costs
- $7,500
- Reserves months
- —
- Total cash needed
- —
Loan-product check · same deal, 3 products live
Conventional
25% down · 7.5% · 30yr
- Down + closing
- —
- Monthly P&I
- —
- Monthly cashflow
- —
- DSCR
- —
- Eligible?
- —
Personal DTI + credit; lowest rate.
DSCR
20% down · 8.5% · 30yr
- Down + closing
- —
- Monthly P&I
- —
- Monthly cashflow
- —
- DSCR
- —
- Eligible?
- —
No personal income docs; deal must DSCR.
Hard money
10% down · 12.0% · 12mo
- Down + closing
- —
- Monthly P&I
- —
- Monthly cashflow
- —
- DSCR
- —
- Eligible?
- —
Short-term bridge; refi at stabilization.
Rent comps 4 comps
| Address | Beds | Baths | Sqft | Rent | $/sqft | DOM | Units | Dist |
|---|---|---|---|---|---|---|---|---|
| 13 Polk St Riverside, NJ | 2.0 | 2.0 | 1080 | $2,000 | $1.85 | 22d | 1 | 0.48mi |
| 808 Delaware Ave Riverside, NJ | 3.0 | 2.0 | 948 | $2,600 | $2.74 | 1d | 1 | 0.52mi |
| 300 Washington St Unit 300B Delanco, NJ | 2.0 | 1.0 | 1000 | $1,750 | $1.75 | 43d | 1 | 0.79mi |
| 1901 Underwood Blvd Delran, NJ | 1.0–2.0 | 1.0–2.0 | 942 | $2,450 | $2.60 | 1d | 1 | 1.08mi |
Listing history 9 events
-
2026-06-17status $250,000 Pending 10 DOM
-
2026-06-16days on market $250,000 Active 10 DOM
-
2026-06-15days on market $250,000 Active 9 DOM
-
2026-06-13days on market $250,000 Active 7 DOM
-
2026-06-13days on market $250,000 Active 6 DOM
-
2026-06-09days on market $250,000 Active 3 DOM
-
2026-06-08days on market $250,000 Active 2 DOM
-
2026-06-07remarks 519-char remark
-
2026-06-07$250,000 Active 1 DOM
ⓘ Source: listings_history table (triggers on properties + properties_extension) + one-shot
backfill from property_details.listing_events for pre-trigger history.
Tax reassessment forecast PA · Partial reset (capped growth)
- Current annual tax
- $3,675 · $306/mo
- Projected year-2 tax
- $3,813 · $318/mo
- Expected delta
- +$137/yr (+$11/mo · 3.7%)
ⓘ Screening estimate from a state-policy table — verify with the county assessor before closing.
Climate risk First Street
- Flood 1/10 Low FEMA zone X (unshaded) · 0% chance over 30 yrs
- Wildfire 1/10 Low
- Heat 6/10 Major 7 d/yr ≥103°F today · 15 d/yr by 30 yrs out
- Wind 6/10 Major 27% chance of damaging wind over 30 yrs
- Air quality 4/10 Moderate 5 unhealthy d/yr today · 7 by 30 yrs out
Nearby sold comps map
Loading sold comps map…
Walkable amenities ~0.75 mi
Loading nearby amenities…
Taxation est. · year 1
- Rental income
- $27,674
- − Mortgage interest
- −$14,004
- − Property taxes
- −$3,675
- − Insurance
- −$1,250
- − Repairs & maintenance
- −$2,214
- − Management
- −$2,214
- − Depreciation
- −$7,273
- Taxable loss
- −$2,956
- Est. tax savings @ 24.0%
- +$709
- After-tax cash flow
- $1,914/yr
For passive investors: Depreciation is non-cash, so a rental often shows a tax loss while cash-flowing — sheltering income. Rental losses are passive: they offset passive income freely, and up to $25,000/yr can offset ordinary (W-2) income if you actively participate and your MAGI is under $100k (phasing out to $0 by $150k); unused losses carry forward. On sale, claimed depreciation is recaptured at up to 25%, and gains may owe capital-gains tax (a 1031 exchange can defer both). Figures are a year-1 estimate at your 24.0% rate — not tax advice; consult a CPA.
Schools (NCES district)
- District
- Riverside Township School District
- NCES district ID
- 3414010
- Math proficiency
- 5% ▼ -12.00%
- Reading proficiency
- 23% ▼ -5.00%
- Median HH income
- $56,244
- Composite
- 13.46/100
- National rank
- #9522
- State rank
- #455 of 472 in NJ
Livability — Philadelphia
- Score
- 77/100
- State rank
- #348
- US rank
- #3054
Category grades
Schools grade is shown separately in the Schools card above.
Census & demographics
- County
- Burlington County
- City population
- 1,559,001
- Metro
- Philadelphia-Camden-Wilmington, PA-NJ-DE-MD
- Population (ZIP)
- 30,615
- Household income
- $94,407
- Rent vs Own
- Severe rent burden
- 1103.0
Population outlook (Burlington County) Hauer SSP2
- Today (2025)
- 453,425 people
- By 2030
- 452,359 · -0.2%
- By 2040
- 445,033 · -1.9%
- By 2050
- 431,760 · -4.8%
- By 2075
- 406,277 · -10.4%
- By 2100
- 364,732 · -19.6%
Race, ethnicity, and origin ACS 2023
- Neighborhood character
- Predominantly White (70%)
- Race & ethnicity
- White 70% Black 10% Hispanic / Latino 9% Two or more races 9% Asian 3%
- Hispanic origin (detail)
- Puerto Rican 3%
- Common ancestry
- Romanian 8% Estonian 3% Russian 2%
- Foreign-born
- 13% · Canada, China
- Languages at home
- 82% English-only · Other Indo-European 8% Spanish 6% Other Asian/Pacific 2%
Political lean MEDSL · Burlington
- 2024 margin
- D (+16.6) · D 57.6% · R 41.0% · Other 1.3%
- 2008→2024 swing
- -2.0pp toward R · 2008: 18.6pp · 2024: 16.6pp
- All cycles
- 2024: D+16.6 2020: D+19.5 2016: D+14.8 2012: D+18.7 2008: D+18.6
Not yet ingested
- Civics
- —
Market trends
- HPI YoY
- ▼ -396.76%
- Current HPI
- 281.8091
- Rent YoY
- —
- Metro
- Philadelphia-Camden-Wilmington, PA-NJ-DE-MD
- State GDP YoY
- ▲ 1.68%
- F500 in state
- 34
Industry mix (Fortune 500 HQ in PA)
| Industry | F500 HQs | Revenue |
|---|---|---|
| Healthcare | 2 | $309B |
|
||
| Insurance | 2 | $27B |
|
||
| Telecommunications / Media | 1 | $124B |
|
||
| Industrial Distribution | 1 | $22B |
|
||
| Financial Services | 1 | $20B |
|
||
| Chemicals / Materials | 1 | $18B |
|
||
Price history
+31.6% since first listed9 events — show timeline
- 2026-06-07 Listed $250,000 BRIGHT MLS
- 2026-06-06 Coming Soon $250,000 BRIGHT MLS
- 2021-07-29 Sold (Public Records) $175,000 Public Records
- 2021-06-08 Sold (MLS) $175,000 BRIGHT MLS
- 2021-06-05 Pending — BRIGHT MLS
- 2021-05-01 Price Changed $190,000 BRIGHT MLS
- 2021-05-01 Contingent — BRIGHT MLS
- 2021-04-23 Price Changed $179,999 BRIGHT MLS
- 2021-04-09 Listed $190,000 BRIGHT MLS
Property tax history
+2.8%/yrLatest (2025): $3,675 · +3.5% YoY. Source: county tax records.
Cash-flow waterfall
monthlySold comps — $/sqft
last 12 mo · ≤1 miLoading sold comps…