 🏗️ New Construction
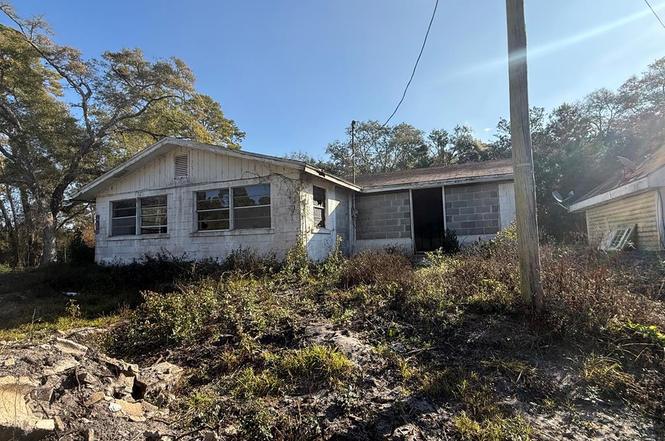
110 SE 10th St · Carrabelle, FL
Flood risk 1/10 · Minimal
- FEMA flood zone
- X (unshaded)
- Chance of flooding over 30 yrs
- 0.0%
- Est. flood insurance / yr
- $507 – $1,088
Fire risk 4/10 · Minor
- Est. fire insurance / yr
- $947 – $1,759
Heat risk 10/10 · Severe
- Hot days now (above 108°F)
- 7 days/yr
- Hot days in 30 yrs
- 21 days/yr
Wind risk 10/10 · Severe
- Chance of severe wind over 30 yrs
- 99.0%
Air-quality risk 1/10 · Minimal
- Unhealthy air days now
- 0 days/yr
- Unhealthy air days in 30 yrs
- 0 days/yr
Risk factors via First Street. Map © Google.
Why this score? — see what drove the D grade
The composite is a weighted blend of 9 inputs, each scored 0–100. Each bar is that input's sub-score; the figure is the points it added to the 100-point composite (weight × sub-score).
- Cash flow +16.1/30.0
- ARV discount +7.5/15.0
- DSCR +5.0/10.0
- Livability +3.5/5.0
- 1% rule +3.3/10.0
- Schools +3.0/10.0
- Rent growth +2.5/5.0
- Condition / age +2.5/5.0
- Appreciation +0.0/10.0
$99,000
🖨 Deal sheet 📄 Offer letter ✓ Due diligence
Listing remarks
NEW PRICE! Fixer-Upper Opportunity! Unique Entry into the Coastal Housing Market! The existing structure features block walls, a roof, and concrete floors, with electric meter and water connection already in place. Septic installation is needed. Situated on a high and dry quarter-acre lot in the heart of Carrabelle, this property is not located in a flood zone. The spacious lot offers excellent potential for an RV pad and/or a pole barn to store your coastal toys. The location is ideal, just one mile from the city dock, local restaurants, and shops. Carrabelle sits on the Carrabelle River with quick access to the Gulf of America, known for world-class sport fishing. Enjoy a short 20-minute
Key facts
- Electric meter
- Block walls
- Water connection
Tags
Property features AI
Finance
- Other: Lot dimensions approximately 100 x 120 (0.275 acres); Directions: Highway 98 East Side to 10th Street NE; house is second on the right
Exterior
- Parking: 2 total parking spaces; Parking features: see remarks
- Utilities: Electricity connected; Water connected; Water source: see remarks
- Home design: Single-family detached residence; 1 story; New construction; Zoned R-1 (Residential Single Family)
- Construction: Built with block construction
- Exterior features: Cleared, interior lot; Roof details: see remarks
Interior
- Bathrooms: 1 full bathroom
- Interior features: See remarks for interior features
Neighborhood map
What this means for you Summary
Snapshot
- This is a 2-bed/1.0-bath single-family listed at $99k.
Deal economics
- At list price, monthly cash flow is $113 ($1k/yr) — positive.
- The deal already cash-flows at list — no discount required.
- Meets the 1% rule at list price ($2k rent vs $99k).
- Recommended offer: $87k (12.0% below list) — sets the bar for market timing.
- Cap rate 6.9% vs local median 1.9% in Carrabelle — top-decile yield for the area; either an underpriced asset or a hidden risk that comps aren't pricing in. Stress-test before assuming the spread holds.
Location & tenants
- Location reads 69/100 on livability (#466 in FL) — a middle-class / working-renter tenant base. Strengths: cost of living A+, housing A+, health & safety A+; Watch: employment D, schools F, amenities F.
- Franklin (rural): math 33% / reading 38% proficiency, ranked #67 of 73 in FL (top 92%) — families likely to look elsewhere, expect single-tenant / working-renter base with shorter leases; 84% free/reduced lunch — lower-income household profile, screen leases tightly.
- Market conditions: 320 active listings in the ZIP; 113 units permitted in Franklin County in 2024 (0 in 5+ unit buildings).
Forward outlook
- Local home prices are declining (-3.0%/yr); year-one equity from $2k of loan paydown is wiped out by about $7k of value loss. Plan a longer hold.
- Franklin County population projected to shrink 5% by 2050 — rents likely to lag national; underwrite the cash flow, not the appreciation.
Negotiation context
- It's been on market 132 days — a 12% lower offer ($87k) is reasonable based on typical stale-listing flexibility.
Risks & watch-outs
- Climate carrying-cost: severe wind risk, 99% chance of damaging wind over 30y; extreme-heat days projected 7→21/yr by 2055 (HVAC capex compounding) — expect insurance premiums to compound above CPI over the hold.
Questions for the listing agent
- It's been on market 132 days. Have you received any prior offers? Is the seller open to a 12% concession, seller financing, or rate buy-down credit?
- Built in 1976 — when were the roof, HVAC, electrical panel, plumbing, and water heater last replaced?
- Why hasn't it sold? Are there any deal-killer items the seller is aware of (foundation, flood, title, zoning, code violations)?
- Is there a deadline driving the sale (1031 exchange, divorce, estate, relocation)? That informs how much negotiation room exists.
- Schools are F-rated, which usually means shorter tenancies and higher turnover. Who's the typical renter profile here, and what's been the actual vacancy rate?
- The area grade is low — what's the realistic commute time and amenity access for the typical tenant pool here? Any planned neighborhood developments (good or bad) we should know about?
- What's the average days-on-market for RENTAL listings here right now (not sales)? A rising rental-DOM trend means longer vacancies and softer asking-rent achievability than the comps imply.
- What's the recent tenant-quality profile in this submarket — average credit score on applications, eviction rate, late-payment / NSF rate, and stable-employment percentage? A property-management company in the area should have these aggregated.
- How much new for-sale + rental construction is in the pipeline within 1–3 miles? Heavy new supply typically softens prices + rents 12–24 months out; constrained supply supports both.
Investment metrics
- 1% rule
- 0.83% ✗
- Cap rate
- 6.90%
- Cash-on-cash
- 2.16%
- DSCR
- 1.10
- GRM
- 10.0
CMA / ARV
- ARV (on-the-fly)
- $223,816
- Comps found
- 2
Show comp detail 2 sales within ~0.75 mi
| Address | Dist | Beds/Ba | Sqft | Sold | Price | $/sf | Match |
|---|---|---|---|---|---|---|---|
| 303 E Meridian Ave | 0.45mi | 3/1.0 (+1) | 1,040 (-6%) | 6mo | $210,000 | $202 | 59 |
| 603 W 3rd St | 0.51mi | 3/2.0 (+1) | 1,132 (+2%) | 8mo | $225,000 | $199 | 56 |
Match score weights: distance 35% · size 25% · config 20% · recency 20%. Top-matched comps best support the ARV.
Projected returns pro-forma
-3.0% appreciation · 3.0% rent growth · sell at horizon
- IRR
- -12.9%
- Equity multiple
- 0.53×
- Total profit
- $-29,166
- Equity at exit
- $33,372
- IRR
- -4.0%
- Equity multiple
- 0.74×
- Total profit
- $-16,487
- Equity at exit
- $19,352
Cash invested: $62,668 (down + closing). Projections, not guarantees.
Landlord ↔ Tenant lean methodology
- Overall (STATE)
- 87 Strongly Landlord-Friendly
- State Florida
- 87 Strongly Landlord-Friendly · R+3
- County
- — inherits STATE
- City
- — inherits STATE
ZIP-level market 32322
- Home prices YoY
- -8.8%
- Active inventory
- 320
- Price-to-rent
- 4.4×
Monthly cashflow live
- Estimated rent
- $1,869 medium interval (Pro) →
- Mortgage (P&I)
- −$1,174
- Tax from tax record
- −$97 /mo · $1,159/yr
- Insurance
- −$93
- HOA
- −$0
- Vacancy / Maint / Mgmt
- −$392
- Net cashflow
- $113
Break-even live
UW: 25.0% down · 7.5% · 30yr · 1.5% tax · 5.0% vac · 8.0% maint · 8.0% mgmt
Financing live
Cash to close
- Down payment
- $55,954
- Closing costs
- $6,714
- Reserves months
- —
- Total cash needed
- —
Loan-product check · same deal, 3 products live
Conventional
25% down · 7.5% · 30yr
- Down + closing
- —
- Monthly P&I
- —
- Monthly cashflow
- —
- DSCR
- —
- Eligible?
- —
Personal DTI + credit; lowest rate.
DSCR
20% down · 8.5% · 30yr
- Down + closing
- —
- Monthly P&I
- —
- Monthly cashflow
- —
- DSCR
- —
- Eligible?
- —
No personal income docs; deal must DSCR.
Hard money
10% down · 12.0% · 12mo
- Down + closing
- —
- Monthly P&I
- —
- Monthly cashflow
- —
- DSCR
- —
- Eligible?
- —
Short-term bridge; refi at stabilization.
Listing history 22 events
-
2026-06-19days on market $99,000 Active 132 DOM
-
2026-06-18days on market $99,000 Active 131 DOM
-
2026-06-17days on market $99,000 Active 130 DOM
-
2026-06-16price $99,000 Active 129 DOM
-
2026-06-16days on market $109,000 Active 129 DOM
-
2026-06-15days on market $109,000 Active 128 DOM
-
2026-06-14days on market $109,000 Active 126 DOM
-
2026-06-13days on market $109,000 Active 125 DOM
-
2026-06-10days on market $109,000 Active 123 DOM
-
2026-06-09days on market $109,000 Active 122 DOM
-
2026-06-08days on market $109,000 Active 121 DOM
-
2026-06-07days on market $109,000 Active 120 DOM
-
2026-06-05days on market $109,000 Active 117 DOM
-
2026-06-03days on market $109,000 Active 116 DOM
-
2026-06-02days on market $109,000 Active 115 DOM
-
2026-06-01days on market $109,000 Active 114 DOM
-
2026-05-31days on market $109,000 Active 113 DOM
-
2026-05-30days on market $109,000 Active 112 DOM
-
2026-04-24price $109,000
-
2026-02-07$115,000 Active
-
2007-02-02soldstatus $125,000
-
1996-07-01soldstatus $25,000
ⓘ Source: listings_history table (triggers on properties + properties_extension) + one-shot
backfill from property_details.listing_events for pre-trigger history.
Tax reassessment forecast FL · Resets to sale price
- Current annual tax
- $1,159 · $97/mo
- Projected year-2 tax
- $1,159 · $97/mo
- Expected delta
- $0/yr ($0/mo · 0.0%)
ⓘ Screening estimate from a state-policy table — verify with the county assessor before closing.
Climate risk First Street
- Flood 1/10 Low FEMA zone X (unshaded) · 0% chance over 30 yrs
- Wildfire 4/10 Moderate
- Heat 10/10 Extreme 7 d/yr ≥108°F today · 21 d/yr by 30 yrs out
- Wind 10/10 Extreme 99% chance of damaging wind over 30 yrs
- Air quality 1/10 Low 0 unhealthy d/yr today · 0 by 30 yrs out
Nearby sold comps map
Loading sold comps map…
Walkable amenities ~0.75 mi
Loading nearby amenities…
Taxation est. · year 1
- Rental income
- $22,426
- − Mortgage interest
- −$12,537
- − Property taxes
- −$1,159
- − Insurance
- −$1,119
- − Repairs & maintenance
- −$1,794
- − Management
- −$1,794
- − Depreciation
- −$6,511
- Taxable loss
- −$2,488
- Est. tax savings @ 24.0%
- +$597
- After-tax cash flow
- $1,951/yr
For passive investors: Depreciation is non-cash, so a rental often shows a tax loss while cash-flowing — sheltering income. Rental losses are passive: they offset passive income freely, and up to $25,000/yr can offset ordinary (W-2) income if you actively participate and your MAGI is under $100k (phasing out to $0 by $150k); unused losses carry forward. On sale, claimed depreciation is recaptured at up to 25%, and gains may owe capital-gains tax (a 1031 exchange can defer both). Figures are a year-1 estimate at your 24.0% rate — not tax advice; consult a CPA.
Schools (NCES district)
- District
- Franklin
- NCES district ID
- 1200570
- Math proficiency
- 33% ▼ -9.00%
- Reading proficiency
- 38% ▼ -4.00%
- Median HH income
- $39,084
- Composite
- 29.7/100
- National rank
- #6454
- State rank
- #67 of 73 in FL
Livability — Carrabelle
- Score
- 69/100
- State rank
- #466
- US rank
- #8398
Category grades
Schools grade is shown separately in the Schools card above.
Census & demographics
- Census place
- Carrabelle, FL
- Population (ZIP)
- 4,348
Population outlook (Franklin County) Hauer SSP2
- Today (2025)
- 11,827 people
- By 2030
- 11,839 · +0.1%
- By 2040
- 11,707 · -1.0%
- By 2050
- 11,218 · -5.1%
- By 2075
- 9,849 · -16.7%
- By 2100
- 7,286 · -38.4%
Race, ethnicity, and origin ACS 2023
- Neighborhood character
- Predominantly White (70%)
- Race & ethnicity
- White 70% Black 15% Two or more races 10% Hispanic / Latino 9%
- Hispanic origin (detail)
- Mexican 2% Puerto Rican 4% Cuban 1%
- Common ancestry
- Slovak 2% Italian 2% Lithuanian 1%
- Foreign-born
- 6% · Canada
- Languages at home
- 89% English-only · Spanish 7% French/Haitian/Cajun 1%
Political lean MEDSL · Franklin
- 2024 margin
- Solid R (+43.8) · D 27.7% · R 71.5%
- 2008→2024 swing
- -15.9pp toward R · 2008: -27.9pp · 2024: -43.8pp
- All cycles
- 2024: R+43.8 2020: R+37.3 2016: R+39.7 2012: R+31.5 2008: R+27.9
Not yet ingested
- Civics
- —
Market trends
- HPI YoY
- ▼ -17.76%
- Current HPI
- 185.16
- Rent YoY
- —
- Metro
- —
- State GDP YoY
- ▲ 3.28%
- F500 in state
- 36
Industry mix (Fortune 500 HQ in FL)
| Industry | F500 HQs | Revenue |
|---|---|---|
| Industrial Technology | 2 | $29B |
|
||
| Insurance | 2 | $17B |
|
||
| Retail | 1 | $60B |
|
||
| Technology Distribution | 1 | $58B |
|
||
| Homebuilding | 1 | $35B |
|
||
| Technology Manufacturing | 1 | $35B |
|
||
Price history
+336.0% since first listed4 events — show timeline
- 2026-04-24 Price Changed $109,000 RAFGC
- 2026-02-07 Listed $115,000 RAFGC
- 2007-02-02 Sold (Public Records) $125,000 Public Records
- 1996-07-01 Sold (Public Records) $25,000 Public Records
Property tax history
+6.3%/yrLatest (2025): $1,159 · +6.9% YoY. Source: county tax records.
Cash-flow waterfall
monthlySold comps — $/sqft
last 12 mo · ≤1 miLoading sold comps…