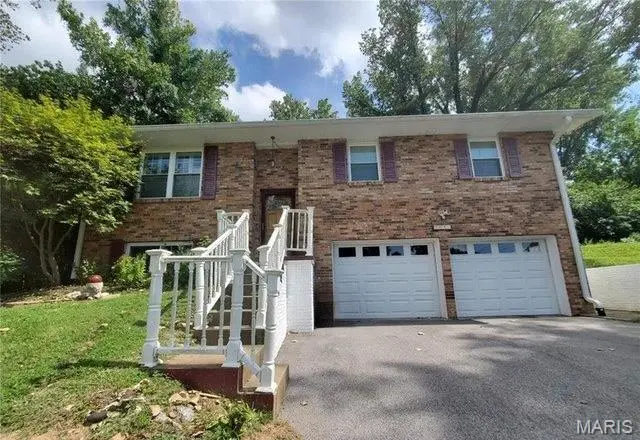
104 Pyramid Dr · Belleville, IL
Flood risk 1/10 · Minimal
- FEMA flood zone
- X
- Chance of flooding over 30 yrs
- 0.0%
- Est. flood insurance / yr
- $507 – $1,088
Fire risk 1/10 · Minimal
- Est. fire insurance / yr
- $804 – $1,492
Heat risk 5/10 · Moderate
- Hot days now (above 107°F)
- 7 days/yr
- Hot days in 30 yrs
- 21 days/yr
Wind risk 2/10 · Minimal
- Chance of severe wind over 30 yrs
- 1.0%
Air-quality risk 3/10 · Minor
- Unhealthy air days now
- 2 days/yr
- Unhealthy air days in 30 yrs
- 4 days/yr
Risk factors via First Street. Map © Google.
Why this score? — see what drove the F grade
The composite is a weighted blend of 9 inputs, each scored 0–100. Each bar is that input's sub-score; the figure is the points it added to the 100-point composite (weight × sub-score).
- Appreciation +9.8/10.0
- Cash flow +7.4/30.0
- Livability +3.9/5.0
- 1% rule +2.9/10.0
- Rent growth +2.5/5.0
- Condition / age +2.5/5.0
- Schools +2.2/10.0
- DSCR +1.5/10.0
- ARV discount +0.0/15.0
$190,000
🖨 Deal sheet 📄 Offer letter ✓ Due diligence
Listing remarks
Check out 104 Pyramid Drive! This beautifully updated brick home offers numerous improvements throughout, including fresh paint, newer garage doors, updated windows and doors, newer siding, and a roof replaced in 2018/2019. The HVAC system and furnace were updated around 2015 for added peace of mind. Inside, you’ll find hardwood flooring in the main living areas, newer carpet in the bedrooms, updated bathrooms, and a stylish kitchen featuring ceramic tile flooring, granite countertops, and stainless steel appliances. The finished lower level provides additional living space with a cozy wood-burning fireplace, half bath, and room perfect for entertaining, relaxing, or a home office se
Key facts
- 0.4 acre lot
- 2 garage spots
- Built 1979
Property features AI
Exterior
- Parking: 2-car garage
- Utilities: Public water; Public sewer; Electric service by Ameren
- Home design: Single-family residence; Multi/split levels; Residential property
- Construction: Brick and vinyl siding exterior
- Exterior features: Back yard; Adjoins wooded area; Near public transit
Interior
- Kitchen: Stainless steel appliances; Dishwasher; Microwave; Electric oven and range; Refrigerator; Garbage disposal
- Bedrooms: 3 bedrooms on the main level
- Bathrooms: 2 full bathrooms on the main level; 1 half bathroom in the lower level
- Heating & cooling: Forced air heating (natural gas); Central air conditioning
- Interior features: Fireplace in family room and recreation room (wood burning); Stainless steel appliances; Dishwasher; Garbage disposal; Microwave; Electric oven and range; Refrigerator; Gas water heater
- Laundry & utility: Washer; Dryer
Neighborhood map
What this means for you Summary
Snapshot
- This is a 3-bed/3.0-bath single-family listed at $190k.
Deal economics
- At list price, monthly cash flow is $-248 ($-3k/yr) — negative.
- To cash-flow at today's rent, offer at most $146k (23.1% below list).
- To meet the 1% rule (rent ≥ 1% of price), the offer needs to be $151k (20.6% below list).
- Recommended offer: $146k (23.1% below list) — sets the bar for cash-flow.
Location & tenants
- Location reads 78/100 on livability (#142 in IL, #2,604 nationally) — a middle-class / working-renter tenant base. Strengths: commute A+, cost of living A+, housing A+; Watch: crime F, amenities D-.
- Belleville Twp Hsd 201 (suburban): math 21% / reading 28% proficiency, ranked #308 of 620 in IL (top 50%) — low school quality limits family demand, transient renter base, plan for 1-2y turnover.
- Zoned schools: Belleville High School-West (math 19% / reading 26%, grade F, #317 of 693 statewide, top 46%, 2,234 students, 0% FRL).
- Market conditions: 103 active listings in the ZIP; 5 comparable units currently listed for rent nearby; rentals leasing fast (median 7d on market — plan ~1-2 weeks tenant-placement turnaround); 783 units permitted in St. Clair County in 2024 (378 in 5+ unit buildings).
Forward outlook
- In year one you build about $19k of equity ($1k loan paydown + $18k appreciation (9.5% local appreciation)).
- St. Clair County population projected at -23% by 2050 — secular population decline; favor cash flow + early exit over multi-decade hold.
- By year 2, paydown + projected appreciation supports a ~$31k cash-out refi (75% LTV) — recoverable capital for the next deal without selling this one.
Negotiation context
- It's been on market 38 days — a 3% lower offer ($184k) is reasonable based on typical stale-listing flexibility.
- 5 sale attempts since 4y ago with the ask held roughly flat each time — persistent listings suggest the price (not the market) is what's stuck; bring a comps-based counter.
Risks & watch-outs
- Climate carrying-cost: extreme-heat days projected 7→21/yr by 2055 (HVAC capex compounding) — expect insurance premiums to compound above CPI over the hold.
Questions for the listing agent
- What do current leases actually rent for vs. the listed asking? Can we see a recent rent roll and the last 12 months of T-12 income?
- It's been on market 38 days. Have you received any prior offers? Is the seller open to a 23% concession, seller financing, or rate buy-down credit?
- Built in 1979 — when were the roof, HVAC, electrical panel, plumbing, and water heater last replaced?
- Is there a deadline driving the sale (1031 exchange, divorce, estate, relocation)? That informs how much negotiation room exists.
- Crime grade is F in this area — have there been break-ins, vandalism, or insurance claims at this property in the last 3 years? What carrier currently insures it and at what premium?
- The area grade is low — what's the realistic commute time and amenity access for the typical tenant pool here? Any planned neighborhood developments (good or bad) we should know about?
- What's the average days-on-market for RENTAL listings here right now (not sales)? A rising rental-DOM trend means longer vacancies and softer asking-rent achievability than the comps imply.
- What's the recent tenant-quality profile in this submarket — average credit score on applications, eviction rate, late-payment / NSF rate, and stable-employment percentage? A property-management company in the area should have these aggregated.
- How much new for-sale + rental construction is in the pipeline within 1–3 miles? Heavy new supply typically softens prices + rents 12–24 months out; constrained supply supports both.
Investment metrics
- 1% rule
- 0.79% ✗
- Cap rate
- 4.72%
- Cash-on-cash
- -5.61%
- DSCR
- 0.75
- GRM
- 10.5
CMA / ARV
- ARV (on-the-fly)
- $147,360
- Comps found
- 9
Show comp detail 9 sales within ~0.75 mi
| Address | Dist | Beds/Ba | Sqft | Sold | Price | $/sf | Match |
|---|---|---|---|---|---|---|---|
| 116 Pamela Dr | 0.12mi | 3/1.0 | 1,352 (+10%) | 1mo | $162,000 | $120 | 69 |
| 17 Highwood Ln | 0.74mi | 3/2.0 | 1,176 (-4%) | 0mo | $174,900 | $149 | 54 |
| 23 Windsor Dr | 0.63mi | 2/1.0 (-1) | 1,198 (-2%) | 5mo | $155,000 | $129 | 49 |
| 117 Carson Dr | 0.46mi | 3/1.0 | 1,137 (-7%) | 18mo | $129,900 | $114 | 43 |
| 14 Carson Dr | 0.63mi | 2/1.0 (-1) | 1,188 (-3%) | 11mo | $199,500 | $168 | 42 |
| 49 Nottingham Ln | 0.36mi | 2/1.5 (-1) | 1,342 (+9%) | 19mo | $154,900 | $115 | 40 |
| 33 Lakewood Dr | 0.61mi | 2/1.0 (-1) | 1,337 (+9%) | 4mo | $160,000 | $120 | 40 |
| 23 Lakewood Dr | 0.69mi | 3/1.0 | 1,111 (-10%) | 17mo | $129,980 | $117 | 29 |
| 21 Lakewood Dr | 0.70mi | 3/1.0 | 1,053 (-14%) | 23mo | $30,000 | $28 | 16 |
Match score weights: distance 35% · size 25% · config 20% · recency 20%. Top-matched comps best support the ARV.
Projected returns pro-forma
9.5% appreciation · 3.0% rent growth · sell at horizon
- IRR
- 19.2%
- Equity multiple
- 2.53×
- Total profit
- $81,275
- Equity at exit
- $164,276
- IRR
- 17.8%
- Equity multiple
- 5.71×
- Total profit
- $250,436
- Equity at exit
- $347,180
Cash invested: $53,200 (down + closing). Projections, not guarantees.
Landlord ↔ Tenant lean methodology
- Overall (STATE)
- 43 Moderately Tenant-Leaning
- State Illinois
- 43 Moderately Tenant-Leaning · D+7
- County
- — inherits STATE
- City
- — inherits STATE
ZIP-level market 62223
- Home prices YoY
- 3.8%
- Active inventory
- 103
- Price-to-rent
- 10.5×
Monthly cashflow live
- Estimated rent
- $1,509 high interval (Pro) →
- Mortgage (P&I)
- −$996
- Tax from tax record
- −$365 /mo · $4,383/yr
- Insurance
- −$79
- HOA
- −$0
- Vacancy / Maint / Mgmt
- −$317
- Net cashflow
- $-248
Break-even live
UW: 25.0% down · 7.5% · 30yr · 1.5% tax · 5.0% vac · 8.0% maint · 8.0% mgmt
Financing live
Cash to close
- Down payment
- $47,500
- Closing costs
- $5,700
- Reserves months
- —
- Total cash needed
- —
Loan-product check · same deal, 3 products live
Conventional
25% down · 7.5% · 30yr
- Down + closing
- —
- Monthly P&I
- —
- Monthly cashflow
- —
- DSCR
- —
- Eligible?
- —
Personal DTI + credit; lowest rate.
DSCR
20% down · 8.5% · 30yr
- Down + closing
- —
- Monthly P&I
- —
- Monthly cashflow
- —
- DSCR
- —
- Eligible?
- —
No personal income docs; deal must DSCR.
Hard money
10% down · 12.0% · 12mo
- Down + closing
- —
- Monthly P&I
- —
- Monthly cashflow
- —
- DSCR
- —
- Eligible?
- —
Short-term bridge; refi at stabilization.
Rent comps 5 comps
| Address | Beds | Baths | Sqft | Rent | $/sqft | DOM | Units | Dist |
|---|---|---|---|---|---|---|---|---|
| 5784 Brett Michael Ln Belleville, IL | 1.0–2.0 | 1.0–2.0 | 801 | $1,195 | $1.49 | 7d | 7 | 0.70mi |
| 1856 Jewel Sisson Dr Belleville, IL | 1.0–3.0 | 1.0–2.0 | 1051 | $1,859 | $1.77 | 1d | 19 | 1.12mi |
| 4057 Gentry Ln Belleville, IL | 2.0 | 2.0 | 1148 | $1,650 | $1.44 | 23d | 1 | 1.15mi |
| 6105 W Washington St Belleville, IL | 3.0 | 1.5 | 1120 | $1,575 | $1.41 | 23d | 1 | 1.17mi |
| 4824 Bier St Belleville, IL | 4.0 | 1.0 | 1200 | $1,350 | $1.12 | 2d | 1 | 1.47mi |
Listing history 27 events
-
2026-06-18days on market $190,000 Active 38 DOM
-
2026-06-17days on market $190,000 Active 37 DOM
-
2026-06-16days on market $190,000 Active 36 DOM
-
2026-06-15days on market $190,000 Active 35 DOM
-
2026-06-13days on market $190,000 Active 33 DOM
-
2026-06-09days on market $190,000 Active 29 DOM
-
2026-06-08days on market $190,000 Active 28 DOM
-
2026-06-07days on market $190,000 Active 27 DOM
-
2026-06-03days on market $190,000 Active 23 DOM
-
2026-06-02days on market $190,000 Active 22 DOM
-
2026-06-01days on market $190,000 Active 21 DOM
-
2026-05-31days on market $190,000 Active 20 DOM
-
2026-05-12$190,000 Active
-
2026-05-11historical $190,000
-
2026-04-03historical Active Under Contract
-
2026-04-02status Active
-
2026-01-14status Active
-
2026-01-14price $190,000
-
2025-08-25$200,000 Active
-
2025-08-23historical
-
2022-12-30historical
-
2022-10-10price $215,000
-
2022-09-20status Active
-
2022-09-13historical
-
2022-08-25historical
-
1993-12-16soldstatus $800,000
-
1993-12-16soldstatus $800,000
ⓘ Source: listings_history table (triggers on properties + properties_extension) + one-shot
backfill from property_details.listing_events for pre-trigger history.
Tax reassessment forecast IL · Partial reset (capped growth)
- Current annual tax
- $4,383 · $365/mo
- Projected year-2 tax
- $4,383 · $365/mo
- Expected delta
- $0/yr ($0/mo · 0.0%)
ⓘ Screening estimate from a state-policy table — verify with the county assessor before closing.
Climate risk First Street
- Flood 1/10 Low FEMA zone X · 0% chance over 30 yrs
- Wildfire 1/10 Low
- Heat 5/10 Major 7 d/yr ≥107°F today · 21 d/yr by 30 yrs out
- Wind 2/10 Low 100% chance of damaging wind over 30 yrs
- Air quality 3/10 Moderate 2 unhealthy d/yr today · 4 by 30 yrs out
Nearby sold comps map
Loading sold comps map…
Walkable amenities ~0.75 mi
Loading nearby amenities…
Taxation est. · year 1
- Rental income
- $18,111
- − Mortgage interest
- −$10,643
- − Property taxes
- −$4,383
- − Insurance
- −$950
- − Repairs & maintenance
- −$1,449
- − Management
- −$1,449
- − Depreciation
- −$5,527
- Taxable loss
- −$6,290
- Est. tax savings @ 24.0%
- +$1,510
- After-tax cash flow
- $-1,472/yr
For passive investors: Depreciation is non-cash, so a rental often shows a tax loss while cash-flowing — sheltering income. Rental losses are passive: they offset passive income freely, and up to $25,000/yr can offset ordinary (W-2) income if you actively participate and your MAGI is under $100k (phasing out to $0 by $150k); unused losses carry forward. On sale, claimed depreciation is recaptured at up to 25%, and gains may owe capital-gains tax (a 1031 exchange can defer both). Figures are a year-1 estimate at your 24.0% rate — not tax advice; consult a CPA.
Schools (NCES district)
- District
- Belleville Twp Hsd 201
- NCES district ID
- 1705640
- Math proficiency
- 21% ▼ -8.00%
- Reading proficiency
- 28% ▼ -3.00%
- Median HH income
- $58,064
- Composite
- 22.39/100
- National rank
- #8115
- State rank
- #308 of 620 in IL
Livability — Belleville
- Score
- 78/100
- State rank
- #142
- US rank
- #2604
Category grades
Schools grade is shown separately in the Schools card above.
Census & demographics
- Census place
- Belleville, IL
- County
- Saint Clair County · 169,691 people
- City population
- 47,407
- Metro
- St. Louis, MO-IL
- Population (ZIP)
- 16,269
- Household income
- $73,700
- Rent vs Own
- Severe rent burden
- 656.0
Population outlook (St. Clair County) Hauer SSP2
- Today (2025)
- 250,366 people
- By 2030
- 240,511 · -3.9%
- By 2040
- 217,391 · -13.2%
- By 2050
- 192,699 · -23.0%
- By 2075
- 140,637 · -43.8%
- By 2100
- 100,499 · -59.9%
Race, ethnicity, and origin ACS 2023
- Neighborhood character
- Majority White (62%)
- Race & ethnicity
- White 62% Black 27% Two or more races 9% Hispanic / Latino 4%
- Common ancestry
- Romanian 3% Lithuanian 3% Slovak 2%
- Foreign-born
- 2% · Canada, Guatemala
- Languages at home
- 96% English-only · Spanish 2%
Political lean MEDSL · St. Clair
- 2024 margin
- Lean D (+7.9) · D 53.0% · R 45.1% · Other 1.8%
- 2008→2024 swing
- -14.6pp toward R · 2008: 22.4pp · 2024: 7.9pp
- All cycles
- 2024: D+7.9 2020: D+8.7 2016: D+5.6 2012: D+14.5 2008: D+22.4
Not yet ingested
- Civics
- —
Market trends
- HPI YoY
- ▲ 9.50%
- Current HPI
- 259.15
- Rent YoY
- —
- Metro
- St. Louis, MO-IL
- State GDP YoY
- ▲ 1.59%
- F500 in state
- 60
Industry mix (Fortune 500 HQ in IL)
| Industry | F500 HQs | Revenue |
|---|---|---|
| Insurance | 4 | $201B |
|
||
| Consumer Goods | 4 | $87B |
|
||
| Industrial Machinery | 3 | $64B |
|
||
| Healthcare | 2 | $55B |
|
||
| Retail / Pharmacy | 1 | $148B |
|
||
| Agriculture / Food | 1 | $86B |
|
||
Price history
-76.2% since first listed15 events — show timeline
- 2026-05-12 Listed $190,000 MARIS as Distributed by MLS Grid
- 2026-05-11 Coming Soon $190,000 MARIS as Distributed by MLS Grid
- 2026-04-03 Contingent — MARIS as Distributed by MLS Grid
- 2026-04-02 Relisted — MARIS as Distributed by MLS Grid
- 2026-01-14 Relisted — MARIS as Distributed by MLS Grid
- 2026-01-14 Price Changed $190,000 MARIS as Distributed by MLS Grid
- 2025-08-25 Listed $200,000 MARIS as Distributed by MLS Grid
- 2025-08-23 Coming Soon — MARIS as Distributed by MLS Grid
- 2022-12-30 Delisted — MARIS as Distributed by MLS Grid
- 2022-10-10 Price Changed $215,000 MARIS as Distributed by MLS Grid
- 2022-09-20 Relisted — MARIS as Distributed by MLS Grid
- 2022-09-13 Delisted — MARIS as Distributed by MLS Grid
- 2022-08-25 Coming Soon — MARIS as Distributed by MLS Grid
- 1993-12-16 Sold (Public Records) $800,000 Public Records
- 1993-12-16 Sold (Public Records) $800,000 Public Records
Property tax history
+5.5%/yrLatest (2024): $4,383 · +3.5% YoY. Source: county tax records.
Cash-flow waterfall
monthlySold comps — $/sqft
last 12 mo · ≤1 miLoading sold comps…