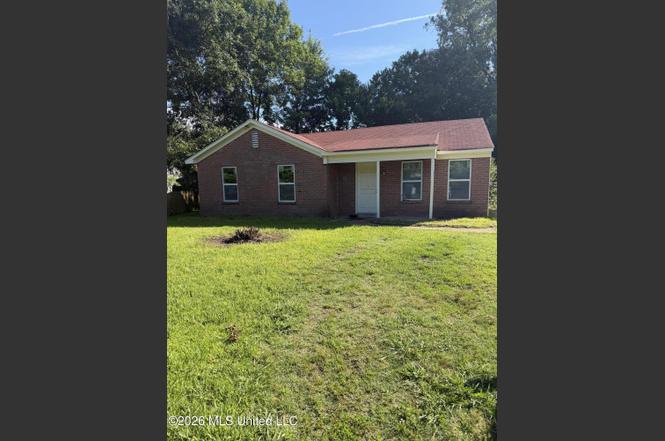
42 Stonebrook Cv · Southaven, MS
Flood risk 5/10 · Moderate
- FEMA flood zone
- X (unshaded)
- Chance of flooding over 30 yrs
- 0.66%
- Est. flood insurance / yr
- $507 – $1,088
Fire risk 3/10 · Minor
- Est. fire insurance / yr
- $1,241 – $2,305
Heat risk 6/10 · Moderate
- Hot days now (above 109°F)
- 7 days/yr
- Hot days in 30 yrs
- 21 days/yr
Wind risk 4/10 · Minor
- Chance of severe wind over 30 yrs
- 17.0%
Air-quality risk 2/10 · Minimal
- Unhealthy air days now
- 2 days/yr
- Unhealthy air days in 30 yrs
- 2 days/yr
Risk factors via First Street. Map © Google.
Why this score? — see what drove the C+ grade
The composite is a weighted blend of 9 inputs, each scored 0–100. Each bar is that input's sub-score; the figure is the points it added to the 100-point composite (weight × sub-score).
- Cash flow +23.6/30.0
- ARV discount +12.5/15.0
- DSCR +7.6/10.0
- 1% rule +5.4/10.0
- Schools +4.0/10.0
- Rent growth +3.3/5.0
- Livability +3.2/5.0
- Condition / age +2.5/5.0
- Appreciation +0.0/10.0
$140,000
🖨 Deal sheet 📄 Offer letter ✓ Due diligence
Listing remarks MLS
START PACKING !! AT THIS PRICE MONTHLY PAYMENTS WILL LIKELY BE LESS THAN YOUR RENT !! THIS ADORABLE 3BR/1BA HOME IS A COVE LOT AND CONVENIENT TO SCHOOLS AND SHOPPING. HUGE EAT-IN KITCHEN THAT COULD HAVE A SMALL DEN OR OFFICE. SEPARATE LAUNDRY ROOM.
Key facts
- Spacious backyard
- Easy access to parks
- 7,405 sq ft lot
Tags
Property features AI
Finance
- Other: Located on a cul-de-sac lot that is level; Lot dimensions approximately 60 x 126 (0.17 acre)
Exterior
- Parking: 2-car garage; Driveway; Parking pad; Concrete surfaces
- Utilities: Public water; Public sewer; Electricity connected; Natural gas connected; Cable available; Sewer connected; Water connected
- Home design: Single-family house; One story; Move-in ready
- Construction: Brick veneer and siding exterior; Asphalt shingle roof; Slab foundation; Built in public-record year
- Exterior features: Private yard; Porch; Portable building
Interior
- Kitchen: Dishwasher; Electric cooktop; Electric range; Refrigerator
- Flooring: Laminate flooring; Linoleum flooring
- Bathrooms: 1 full bathroom
- Heating & cooling: Forced air heating (natural gas); Central air conditioning
- Interior features: Ceiling fans; Eat-in kitchen; ENERGY STAR qualified windows with screens
Neighborhood map
What this means for you Summary
Snapshot
- This is a 2-bed/1.0-bath single-family listed at $140k.
Deal economics
- At list price, monthly cash flow is $263 ($3k/yr) — positive.
- The deal already cash-flows at list — no discount required.
- Meets the 1% rule at list price ($1k rent vs $140k).
- Cap rate 8.5% vs local median 5.2% in Southaven — top-decile yield for the area; either an underpriced asset or a hidden risk that comps aren't pricing in. Stress-test before assuming the spread holds.
Location & tenants
- Location reads 65/100 on livability (#107 in MS) — a middle-class / working-renter tenant base. Strengths: cost of living A+, housing A+; Watch: amenities F, commute F, health & safety F.
- Desoto County School District (suburban): math 48% / reading 42% proficiency, ranked #20 of 130 in MS (top 15%) — families likely to look elsewhere, expect single-tenant / working-renter base with shorter leases.
- Zoned schools: Southaven Elementary (math 20% / reading 23%, grade F, #239 of 375 statewide, top 64%, 684 students, 100% FRL); Southaven Middle School (math 33% / reading 25%, grade F, #90 of 179 statewide, top 52%, 1,456 students, 100% FRL); Southaven High School (math 26% / reading 35%, grade F, #88 of 197 statewide, top 45%, 1,850 students, 100% FRL) — zoned schools average 100% FRL vs 43% district-wide (56 pts higher); higher-poverty schools than district average — tighter screening recommended.
- Zoned-school proficiency averages 27% at this address vs 45% district-wide (-18 pts) — the specific schools serving this property underperform the Desoto County School District average; the district grade overstates school quality for this exact location.
- Market conditions: Rents rising (+3.2%/yr); 193 active listings in the ZIP; 12 comparable units currently listed for rent nearby; rentals at typical pace (median 24d on market — plan ~3-4 weeks tenant-placement turnaround); 1,155 units permitted in DeSoto County in 2024 (0 in 5+ unit buildings).
Forward outlook
- Local home prices are declining (-3.0%/yr); year-one equity from $968 of loan paydown is wiped out by about $4k of value loss. Plan a longer hold.
- DeSoto County population projected at +33% by 2050 — long-run rental-demand tailwind backs the buy-and-hold thesis.
Negotiation context
- Only 1 days on market — expect competitive offers; lowballing is unlikely to land.
- 4 sale attempts since 22y ago with the ask held roughly flat each time — persistent listings suggest the price (not the market) is what's stuck; bring a comps-based counter.
Risks & watch-outs
- Climate carrying-cost: moderate flood risk; extreme-heat days projected 7→21/yr by 2055 (HVAC capex compounding) — expect insurance premiums to compound above CPI over the hold.
Questions for the listing agent
- Built in 1976 — when were the roof, HVAC, electrical panel, plumbing, and water heater last replaced?
- Is there a deadline driving the sale (1031 exchange, divorce, estate, relocation)? That informs how much negotiation room exists.
- Schools are D-rated, which usually means shorter tenancies and higher turnover. Who's the typical renter profile here, and what's been the actual vacancy rate?
- What's the average days-on-market for RENTAL listings here right now (not sales)? A rising rental-DOM trend means longer vacancies and softer asking-rent achievability than the comps imply.
- What's the recent tenant-quality profile in this submarket — average credit score on applications, eviction rate, late-payment / NSF rate, and stable-employment percentage? A property-management company in the area should have these aggregated.
- How much new for-sale + rental construction is in the pipeline within 1–3 miles? Heavy new supply typically softens prices + rents 12–24 months out; constrained supply supports both.
Investment metrics
- 1% rule
- 1.04% ✓
- Cap rate
- 8.55%
- Cash-on-cash
- 8.05%
- DSCR
- 1.36
- GRM
- 8.0
CMA / ARV
- ARV (on-the-fly)
- $157,410
- Comps found
- 3
Show comp detail 3 sales within ~0.75 mi
| Address | Dist | Beds/Ba | Sqft | Sold | Price | $/sf | Match |
|---|---|---|---|---|---|---|---|
| 213 Hillbrook Dr | 0.22mi | 3/1.0 (+1) | 1,000 (+5%) | 12mo | $160,000 | $160 | 67 |
| 8182 Cedarbrook Dr | 0.31mi | 3/1.0 (+1) | 1,075 (+13%) | 2mo | $176,900 | $165 | 58 |
| 7594 Lilly Dr | 0.63mi | 2/2.0 | 1,091 (+14%) | 12mo | $210,000 | $192 | 32 |
Match score weights: distance 35% · size 25% · config 20% · recency 20%. Top-matched comps best support the ARV.
Projected returns pro-forma
-3.0% appreciation · 3.2% rent growth · sell at horizon
- IRR
- -3.9%
- Equity multiple
- 0.86×
- Total profit
- $-5,672
- Equity at exit
- $20,874
- IRR
- 6.0%
- Equity multiple
- 1.45×
- Total profit
- $17,737
- Equity at exit
- $12,105
Cash invested: $39,200 (down + closing). Projections, not guarantees.
Landlord ↔ Tenant lean methodology
- Overall (STATE)
- 90 Strongly Landlord-Friendly
- State Mississippi
- 90 Strongly Landlord-Friendly · R+11
- County
- — inherits STATE
- City
- — inherits STATE
ZIP-level market 38671
- Home prices YoY
- -18.2%
- Rents YoY
- 3.2%
- Active inventory
- 193
- Price-to-rent
- 8.0×
Monthly cashflow live
- Estimated rent
- $1,462 high interval (Pro) →
- Mortgage (P&I)
- −$734
- Tax from tax record
- −$99 /mo · $1,194/yr
- Insurance
- −$58
- HOA
- −$0
- Vacancy / Maint / Mgmt
- −$307
- Net cashflow
- $263
Break-even live
UW: 25.0% down · 7.5% · 30yr · 1.5% tax · 5.0% vac · 8.0% maint · 8.0% mgmt
Financing live
Cash to close
- Down payment
- $35,000
- Closing costs
- $4,200
- Reserves months
- —
- Total cash needed
- —
Loan-product check · same deal, 3 products live
Conventional
25% down · 7.5% · 30yr
- Down + closing
- —
- Monthly P&I
- —
- Monthly cashflow
- —
- DSCR
- —
- Eligible?
- —
Personal DTI + credit; lowest rate.
DSCR
20% down · 8.5% · 30yr
- Down + closing
- —
- Monthly P&I
- —
- Monthly cashflow
- —
- DSCR
- —
- Eligible?
- —
No personal income docs; deal must DSCR.
Hard money
10% down · 12.0% · 12mo
- Down + closing
- —
- Monthly P&I
- —
- Monthly cashflow
- —
- DSCR
- —
- Eligible?
- —
Short-term bridge; refi at stabilization.
Rent comps 12 comps
| Address | Beds | Baths | Sqft | Rent | $/sqft | DOM | Units | Dist |
|---|---|---|---|---|---|---|---|---|
| 8082 Whitebrook Dr Southaven, MS | 3.0 | 1.0 | 1100 | $1,495 | $1.36 | 23d | 1 | 0.17mi |
| 8254 Pinebrook Dr Southaven, MS | 3.0 | 1.0 | 1095 | $1,385 | $1.26 | 44d | 1 | 0.47mi |
| 8085 Creekwood Cir E Southaven, MS | 2.0 | 2.0 | 1000 | $1,600 | $1.60 | 44d | 1 | 0.58mi |
| 8375 Old Forge Rd Southaven, MS | 3.0 | 2.0 | 1080 | $1,295 | $1.20 | 4d | 1 | 0.70mi |
| 769 Barrington Woods Cv Unit 6 Southaven, MS | 2.0 | 2.0 | 1100 | $1,345 | $1.22 | 23d | 1 | 0.79mi |
| 818 Barrington Woods Cv Unit 769-6 Southaven, MS | 2.0 | 2.0 | 1100 | $1,345 | $1.22 | 23d | 1 | 0.84mi |
| 7187 Gazebo Dr Southaven, MS | 2.0 | 2.0 | 1026 | $1,450 | $1.41 | 14d | 1 | 0.85mi |
| 7560 Chesteridge Ave Southaven, MS | 1.0–3.0 | 1.0–2.0 | 887 | $1,312 | $1.48 | 1d | 7 | 1.17mi |
| 1000 Sutton Pl Horn Lake, MS | 1.0 | 1.0 | 900 | $1,336 | $1.48 | 44d | 1 | 1.31mi |
| 1000 Sutton Pl Horn Lake, MS | 1.0 | 1.0 | 900 | $1,328 | $1.48 | 3d | 1 | 1.31mi |
| 1000 Sutton Pl Horn Lake, MS | 1.0 | 1.0 | 900 | $1,454 | $1.62 | 12d | 1 | 1.31mi |
| 1000 Sutton Pl Horn Lake, MS | 2.0 | 2.0 | 1100 | $1,540 | $1.40 | 44d | 1 | 1.31mi |
Listing history 2 events
-
2026-06-18remarks 668-char remark
-
2026-06-18$140,000 Active 1 DOM
ⓘ Source: listings_history table (triggers on properties + properties_extension) + one-shot
backfill from property_details.listing_events for pre-trigger history.
Tax reassessment forecast MS · Resets to sale price
- Current annual tax
- $1,194 · $99/mo
- Projected year-2 tax
- $1,194 · $99/mo
- Expected delta
- $0/yr ($0/mo · 0.0%)
ⓘ Screening estimate from a state-policy table — verify with the county assessor before closing.
Climate risk First Street
- Flood 5/10 Major FEMA zone X (unshaded) · 66% chance over 30 yrs
- Wildfire 3/10 Moderate
- Heat 6/10 Major 7 d/yr ≥109°F today · 21 d/yr by 30 yrs out
- Wind 4/10 Moderate 17% chance of damaging wind over 30 yrs
- Air quality 2/10 Low 2 unhealthy d/yr today · 2 by 30 yrs out
Nearby sold comps map
Loading sold comps map…
Walkable amenities ~0.75 mi
Loading nearby amenities…
Taxation est. · year 1
- Rental income
- $17,543
- − Mortgage interest
- −$7,842
- − Property taxes
- −$1,194
- − Insurance
- −$700
- − Repairs & maintenance
- −$1,403
- − Management
- −$1,403
- − Depreciation
- −$4,073
- Taxable income
- $927
- Est. tax owed @ 24.0%
- −$222
- After-tax cash flow
- $2,932/yr
For passive investors: Depreciation is non-cash, so a rental often shows a tax loss while cash-flowing — sheltering income. Rental losses are passive: they offset passive income freely, and up to $25,000/yr can offset ordinary (W-2) income if you actively participate and your MAGI is under $100k (phasing out to $0 by $150k); unused losses carry forward. On sale, claimed depreciation is recaptured at up to 25%, and gains may owe capital-gains tax (a 1031 exchange can defer both). Figures are a year-1 estimate at your 24.0% rate — not tax advice; consult a CPA.
Schools (NCES district)
- District
- Desoto County School District
- NCES district ID
- 2801320
- Math proficiency
- 48% ▼ -13.00%
- Reading proficiency
- 42% ▼ -6.00%
- Median HH income
- $59,272
- Composite
- 39.56/100
- National rank
- #3933
- State rank
- #20 of 130 in MS
Livability — Southaven
- Score
- 65/100
- State rank
- #107
- US rank
- #12584
Category grades
Schools grade is shown separately in the Schools card above.
Census & demographics
- Census place
- Southaven, MS
- County
- DeSoto County · 176,513 people
- City population
- 53,755
- Metro
- Memphis, TN-MS-AR
- Population (ZIP)
- 37,319
- Household income
- $61,843
- Rent vs Own
- Severe rent burden
- 1583.0
Population outlook (DeSoto County) Hauer SSP2
- Today (2025)
- 203,338 people
- By 2030
- 217,692 · +7.1%
- By 2040
- 245,320 · +20.6%
- By 2050
- 270,133 · +32.8%
- By 2075
- 323,341 · +59.0%
- By 2100
- 348,742 · +71.5%
Race, ethnicity, and origin ACS 2023
- Neighborhood character
- Diverse neighborhood (Simpson 0.58)
- Race & ethnicity
- White 49% Black 42% Hispanic / Latino 6% Two or more races 4%
- Hispanic origin (detail)
- Mexican 3%
- Common ancestry
- Italian 1% Lithuanian 1% Serbian 1%
- Foreign-born
- 3% · Canada
- Languages at home
- 95% English-only · Spanish 4%
Political lean MEDSL · DeSoto
- 2024 margin
- Strong R (+24.1) · D 36.7% · R 60.8% · Other 2.5%
- 2008→2024 swing
- +14.2pp toward D · 2008: -38.2pp · 2024: -24.1pp
- All cycles
- 2024: R+24.1 2020: R+23.9 2016: R+34.8 2012: R+33.5 2008: R+38.2
Not yet ingested
- Civics
- —
Market trends
- HPI YoY
- ▼ -49.08%
- Current HPI
- 220.7875
- Rent YoY
- ▲ 3.20%
- Metro
- Memphis, TN-MS-AR
- State GDP YoY
- —
- F500 in state
- 0
Price history
+133.7% since first listed9 events — show timeline
- 2026-06-17 Listed $140,000 MLSU
- 2021-10-11 Listing Removed — MLSU
- 2019-11-12 Sold (Public Records) — Public Records
- 2006-10-16 Sold (Public Records) — Public Records
- 2006-09-30 Sold (MLS) — MLSU
- 2006-06-16 Listed $65,900 MLSU
- 2005-04-20 Listing Removed — MLSU
- 2005-02-09 Listed $59,900 MLSU
- 2004-08-08 Listed $59,900 MLSU
Property tax history
+4.8%/yrLatest (2025): $1,194 · +7.8% YoY. Source: county tax records.
Cash-flow waterfall
monthlySold comps — $/sqft
last 12 mo · ≤1 miLoading sold comps…