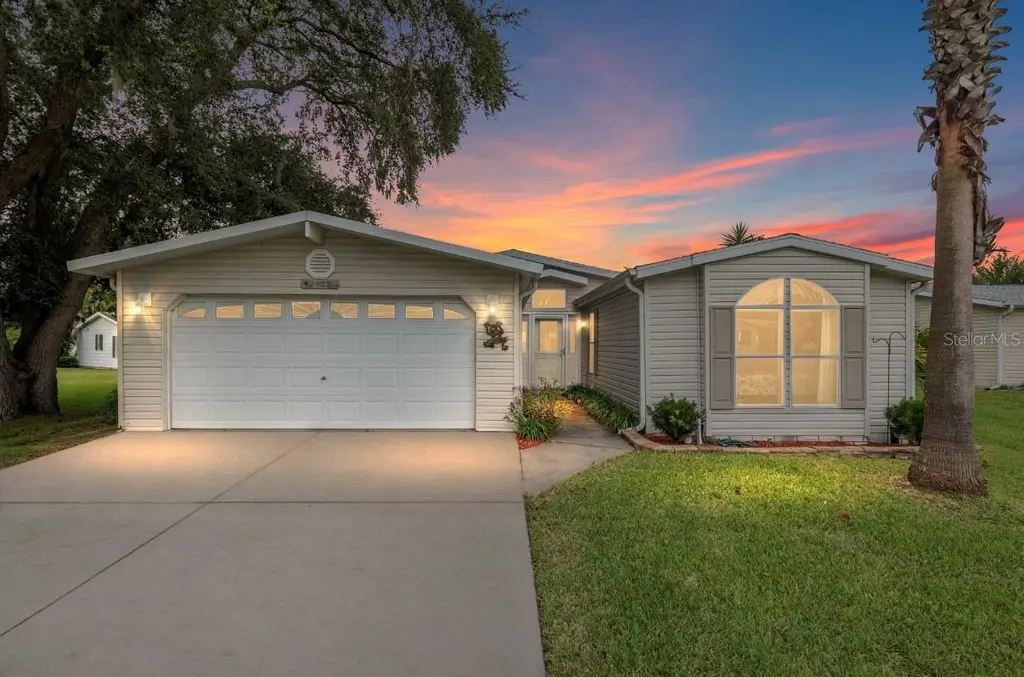
7863 SW 6th Pl · Ocala, FL
Flood risk 1/10 · Minimal
- FEMA flood zone
- X (unshaded)
- Chance of flooding over 30 yrs
- 0.0%
- Est. flood insurance / yr
- $507 – $1,088
Fire risk 5/10 · Moderate
- Est. fire insurance / yr
- $947 – $1,759
Heat risk 8/10 · Major
- Hot days now (above 107°F)
- 7 days/yr
- Hot days in 30 yrs
- 22 days/yr
Wind risk 9/10 · Severe
- Chance of severe wind over 30 yrs
- 99.0%
Air-quality risk 3/10 · Minor
- Unhealthy air days now
- 3 days/yr
- Unhealthy air days in 30 yrs
- 3 days/yr
Risk factors via First Street. Map © Google.
Why this score? — see what drove the C+ grade
The composite is a weighted blend of 9 inputs, each scored 0–100. Each bar is that input's sub-score; the figure is the points it added to the 100-point composite (weight × sub-score).
- Cash flow +27.7/30.0
- DSCR +9.8/10.0
- 1% rule +7.8/10.0
- ARV discount +7.5/15.0
- Schools +3.6/10.0
- Livability +3.5/5.0
- Rent growth +2.5/5.0
- Condition / age +2.5/5.0
- Appreciation +0.0/10.0
$195,000
🖨 Deal sheet 📄 Offer letter ✓ Due diligence
Listing remarks MLS
Beautiful 2/2/2 in the wonderful Falls of Ocala. The home features a huge master bedroom w/ sitting area and enormous master bathroom, huge kitchen w/ breakfast bar, a sun room w/ sliding glass door lthat leads to the covered porch, formal LR and den. This home has it all. The Falls of Ocala is a 55+ community with great amenities including pool, clubhouse and activites for the residents. Come join the family at The Falls of Ocala.
Key facts
- Split-bedroom layout
- French door
- Walk-in closet
Tags
Property features AI
Finance
- Other: Total living area approximately 2,048 square feet; Lot about 0.2 acre (approx. 68 x 130); No waterfront; Community is a senior community; Lease restrictions apply; Association managed by MEB Real Estate Management/Mark Butler
- HOA & community: Monthly HOA fee of $200; Association requires approval; Association amenities include clubhouse, pool; HOA covers pool, sewer and water; Deed restrictions; Sidewalks; Pets allowed (cats and dogs)
Exterior
- Parking: Attached garage (2 vehicles)
- Utilities: Private well water; Public sewer; Cable available; Electricity available; Phone available; Water available
- Home design: Single-family residence; One story; East-facing; Residential in a PUD; Homestead exempt
- Construction: Vinyl siding; Shingle roof; Stilt/On piling foundation; Built on one level
- Exterior features: Covered rear porch; Sliding doors; Cleared and landscaped lot; Paved road access (private maintained road)
Interior
- Kitchen: Dishwasher; Disposal; Microwave; Range; Refrigerator
- Bedrooms: 3 bedrooms
- Flooring: Carpet; Linoleum
- Bathrooms: 2 full bathrooms
- Heating & cooling: Central heating (electric); Central air conditioning
- Interior features: Ceiling fans; Eat-in kitchen; Open floorplan; Split bedroom plan; Walk-in closet(s); Window treatments; Blinds
- Laundry & utility: Indoor laundry room; Inside utility; Storage rooms; Breakfast room (separate); Florida room
Neighborhood map
What this means for you Summary
Snapshot
- This is a 3-bed/2.0-bath manufactured listed at $195k.
Deal economics
- At list price, monthly cash flow is $588 ($7k/yr) — positive.
- The deal already cash-flows at list — no discount required.
- Meets the 1% rule at list price ($2k rent vs $195k).
- Recommended offer: $172k (12.0% below list) — sets the bar for market timing.
- Cap rate 9.9% vs local median 4.2% in Ocala — top-decile yield for the area; either an underpriced asset or a hidden risk that comps aren't pricing in. Stress-test before assuming the spread holds.
Location & tenants
- Location reads 69/100 on livability (#476 in FL) — a middle-class / working-renter tenant base. Strengths: cost of living A+, housing A+, health & safety A+; Watch: crime F, amenities F, commute F.
- Marion (rural): math 42% / reading 43% proficiency, ranked #61 of 73 in FL (top 84%) — families likely to look elsewhere, expect single-tenant / working-renter base with shorter leases; 61% free/reduced lunch — lower-income household profile, screen leases tightly.
- Market conditions: Rents flat; 295 active listings in the ZIP; 2 comparable units currently listed for rent nearby; 7,071 units permitted in Marion County in 2024 (534 in 5+ unit buildings).
- At $2,498/mo this rent would consume 46% of the median local household income ($65k/yr) (locally 1062% of renters already pay >50% of income on rent) — very limited rent-growth headroom before tenants either downsize or default.
Forward outlook
- Local home prices are declining (-3.0%/yr); year-one equity from $1k of loan paydown is wiped out by about $6k of value loss. Plan a longer hold.
- Marion County population projected at +13% by 2050 — modest demand growth; plan on rents tracking national, not racing it.
Negotiation context
- It's been on market 178 days — a 12% lower offer ($172k) is reasonable based on typical stale-listing flexibility.
- 3 sale attempts since 21y ago; this cycle's ask has dropped $25k (11%) from the opening price — seller is motivated, your offer sets the floor, not the list.
- Current owner paid $115k; list at $195k implies a 70% gain — meaningful room to come down on a strong offer.
Risks & watch-outs
- Climate carrying-cost: severe wind risk, 99% chance of damaging wind over 30y; moderate wildfire risk; extreme-heat days projected 7→22/yr by 2055 (HVAC capex compounding) — expect insurance premiums to compound above CPI over the hold.
Questions for the listing agent
- It's been on market 178 days. Have you received any prior offers? Is the seller open to a 12% concession, seller financing, or rate buy-down credit?
- What does the HOA fee cover, when was the last increase, and are there any pending special assessments or reserve-fund shortfalls?
- Why hasn't it sold? Are there any deal-killer items the seller is aware of (foundation, flood, title, zoning, code violations)?
- Is there a deadline driving the sale (1031 exchange, divorce, estate, relocation)? That informs how much negotiation room exists.
- Crime grade is F in this area — have there been break-ins, vandalism, or insurance claims at this property in the last 3 years? What carrier currently insures it and at what premium?
- What's the average days-on-market for RENTAL listings here right now (not sales)? A rising rental-DOM trend means longer vacancies and softer asking-rent achievability than the comps imply.
- What's the recent tenant-quality profile in this submarket — average credit score on applications, eviction rate, late-payment / NSF rate, and stable-employment percentage? A property-management company in the area should have these aggregated.
- How much new for-sale + rental construction is in the pipeline within 1–3 miles? Heavy new supply typically softens prices + rents 12–24 months out; constrained supply supports both.
Investment metrics
- 1% rule
- 1.28% ✓
- Cap rate
- 9.91%
- Cash-on-cash
- 12.93%
- DSCR
- 1.58
- GRM
- 6.5
CMA / ARV
No comps found within radius.
Projected returns pro-forma
-3.0% appreciation · 0.12% rent growth · sell at horizon
- IRR
- -0.5%
- Equity multiple
- 0.98×
- Total profit
- $-1,099
- Equity at exit
- $29,075
- IRR
- 5.8%
- Equity multiple
- 1.37×
- Total profit
- $20,287
- Equity at exit
- $16,860
Cash invested: $54,600 (down + closing). Projections, not guarantees.
Landlord ↔ Tenant lean methodology
- Overall (STATE)
- 87 Strongly Landlord-Friendly
- State Florida
- 87 Strongly Landlord-Friendly · R+3
- County
- — inherits STATE
- City
- — inherits STATE
ZIP-level market 34474
- Home prices YoY
- -28.4%
- Rents YoY
- 0.1%
- Active inventory
- 295
- Price-to-rent
- 6.5×
Monthly cashflow live
- Estimated rent
- $2,498 medium interval (Pro) →
- Mortgage (P&I)
- −$1,023
- Tax from tax record
- −$81 /mo · $977/yr
- Insurance
- −$81
- HOA
- −$200
- Vacancy / Maint / Mgmt
- −$525
- Net cashflow
- $588
Break-even live
UW: 25.0% down · 7.5% · 30yr · 1.5% tax · 5.0% vac · 8.0% maint · 8.0% mgmt
Financing live
Cash to close
- Down payment
- $48,750
- Closing costs
- $5,850
- Reserves months
- —
- Total cash needed
- —
Loan-product check · same deal, 3 products live
Conventional
25% down · 7.5% · 30yr
- Down + closing
- —
- Monthly P&I
- —
- Monthly cashflow
- —
- DSCR
- —
- Eligible?
- —
Personal DTI + credit; lowest rate.
DSCR
20% down · 8.5% · 30yr
- Down + closing
- —
- Monthly P&I
- —
- Monthly cashflow
- —
- DSCR
- —
- Eligible?
- —
No personal income docs; deal must DSCR.
Hard money
10% down · 12.0% · 12mo
- Down + closing
- —
- Monthly P&I
- —
- Monthly cashflow
- —
- DSCR
- —
- Eligible?
- —
Short-term bridge; refi at stabilization.
Rent comps 2 comps
| Address | Beds | Baths | Sqft | Rent | $/sqft | DOM | Units | Dist |
|---|---|---|---|---|---|---|---|---|
| 7180 SW 19th Pl Ocala, FL | 4.0 | 2.0 | 1940 | $1,900 | $0.98 | 14d | 1 | 1.12mi |
| 7710 NW 14th St Ocala, FL | 3.0 | 3.0 | 1521 | $4,500 | $2.96 | 21d | 1 | 1.31mi |
HOA detail
- Monthly dues
- $200 · $2,400/yr
- Likely covers
- pool
Listing history 12 events
-
2026-05-11status Pending
-
2026-04-09price $195,000
-
2026-02-16price $199,900
-
2026-01-26status Active
-
2026-01-12status Pending
-
2026-01-08price $214,900
-
2025-10-31$219,900 Active
-
2019-12-03soldstatus $115,000
-
2006-04-26soldstatus $69,100
-
2006-04-24soldstatus $184,300 435-char remark
Show marketing remark (435 chars)
Beautiful 2/2/2 in the wonderful Falls of Ocala. The home features a huge master bedroom w/ sitting area and enormous master bathroom, huge kitchen w/ breakfast bar, a sun room w/ sliding glass door lthat leads to the covered porch, formal LR and den. This home has it all. The Falls of Ocala is a 55+ community with great amenities including pool, clubhouse and activites for the residents. Come join the family at The Falls of Ocala.
-
2005-11-02$187,410 435-char remark
Show marketing remark (435 chars)
Beautiful 2/2/2 in the wonderful Falls of Ocala. The home features a huge master bedroom w/ sitting area and enormous master bathroom, huge kitchen w/ breakfast bar, a sun room w/ sliding glass door lthat leads to the covered porch, formal LR and den. This home has it all. The Falls of Ocala is a 55+ community with great amenities including pool, clubhouse and activites for the residents. Come join the family at The Falls of Ocala.
-
2003-12-17soldstatus $600,000
ⓘ Source: listings_history table (triggers on properties + properties_extension) + one-shot
backfill from property_details.listing_events for pre-trigger history.
Tax reassessment forecast FL · Resets to sale price
- Current annual tax
- $977 · $81/mo
- Projected year-2 tax
- $1,618 · $135/mo
- Expected delta
- +$641/yr (+$53/mo · 65.6%)
ⓘ Screening estimate from a state-policy table — verify with the county assessor before closing.
Climate risk First Street
- Flood 1/10 Low FEMA zone X (unshaded) · 0% chance over 30 yrs
- Wildfire 5/10 Major
- Heat 8/10 Severe 7 d/yr ≥107°F today · 22 d/yr by 30 yrs out
- Wind 9/10 Extreme 99% chance of damaging wind over 30 yrs
- Air quality 3/10 Moderate 3 unhealthy d/yr today · 3 by 30 yrs out
Nearby sold comps map
Loading sold comps map…
Walkable amenities ~0.75 mi
Loading nearby amenities…
Taxation est. · year 1
- Rental income
- $29,980
- − Mortgage interest
- −$10,923
- − Property taxes
- −$977
- − Insurance
- −$975
- − Repairs & maintenance
- −$2,398
- − Management
- −$2,398
- − HOA
- −$2,400
- − Depreciation
- −$5,673
- Taxable income
- $4,235
- Est. tax owed @ 24.0%
- −$1,016
- After-tax cash flow
- $6,044/yr
For passive investors: Depreciation is non-cash, so a rental often shows a tax loss while cash-flowing — sheltering income. Rental losses are passive: they offset passive income freely, and up to $25,000/yr can offset ordinary (W-2) income if you actively participate and your MAGI is under $100k (phasing out to $0 by $150k); unused losses carry forward. On sale, claimed depreciation is recaptured at up to 25%, and gains may owe capital-gains tax (a 1031 exchange can defer both). Figures are a year-1 estimate at your 24.0% rate — not tax advice; consult a CPA.
Schools (NCES district)
- District
- Marion
- NCES district ID
- 1201260
- Math proficiency
- 42% ▼ -7.00%
- Reading proficiency
- 43% ▼ -4.00%
- Median HH income
- $40,015
- Composite
- 35.61/100
- National rank
- #4890
- State rank
- #61 of 73 in FL
Livability — Ocala
- Score
- 69/100
- State rank
- #476
- US rank
- #8461
Category grades
Schools grade is shown separately in the Schools card above.
Census & demographics
- County
- Marion County · 315,796 people
- City population
- 263,375
- Metro
- Ocala, FL
- Population (ZIP)
- 20,258
- Household income
- $65,291
- Rent vs Own
- Severe rent burden
- 1062.0
Population outlook (Marion County) Hauer SSP2
- Today (2025)
- 365,905 people
- By 2030
- 376,768 · +3.0%
- By 2040
- 396,555 · +8.4%
- By 2050
- 412,723 · +12.8%
- By 2075
- 446,090 · +21.9%
- By 2100
- 436,193 · +19.2%
Race, ethnicity, and origin ACS 2023
- Neighborhood character
- Diverse neighborhood (Simpson 0.64)
- Race & ethnicity
- White 52% Hispanic / Latino 25% Black 13% Two or more races 8% Asian 8%
- Hispanic origin (detail)
- Mexican 2% Puerto Rican 10%
- Common ancestry
- Lithuanian 2% Romanian 2% Slovak 1%
- Foreign-born
- 21% · Canada, Jamaica, Vietnam
- Languages at home
- 71% English-only · Spanish 22% Other Indo-European 4% Vietnamese 1%
Political lean MEDSL · Marion
- 2024 margin
- Solid R (+31.6) · D 33.8% · R 65.5%
- 2008→2024 swing
- -20.0pp toward R · 2008: -11.6pp · 2024: -31.6pp
- All cycles
- 2024: R+31.6 2020: R+25.9 2016: R+26.2 2012: R+16.2 2008: R+11.6
Not yet ingested
- Civics
- —
Market trends
- HPI YoY
- ▼ -78.16%
- Current HPI
- 196.5607
- Rent YoY
- ▲ 0.12%
- Metro
- Ocala, FL
- State GDP YoY
- ▲ 3.28%
- F500 in state
- 36
Industry mix (Fortune 500 HQ in FL)
| Industry | F500 HQs | Revenue |
|---|---|---|
| Industrial Technology | 2 | $29B |
|
||
| Insurance | 2 | $17B |
|
||
| Retail | 1 | $60B |
|
||
| Technology Distribution | 1 | $58B |
|
||
| Homebuilding | 1 | $35B |
|
||
| Technology Manufacturing | 1 | $35B |
|
||
Price history
-67.5% since first listed12 events — show timeline
- 2026-05-11 Pending — Stellar MLS as Distributed by MLS Grid
- 2026-04-09 Price Changed $195,000 Stellar MLS as Distributed by MLS Grid
- 2026-02-16 Price Changed $199,900 Stellar MLS as Distributed by MLS Grid
- 2026-01-26 Relisted — Stellar MLS as Distributed by MLS Grid
- 2026-01-12 Pending — Stellar MLS as Distributed by MLS Grid
- 2026-01-08 Price Changed $214,900 Stellar MLS as Distributed by MLS Grid
- 2025-10-31 Listed $219,900 Stellar MLS as Distributed by MLS Grid
- 2019-12-03 Sold (Public Records) $115,000 Public Records
- 2006-04-26 Sold (Public Records) $69,100 Public Records
- 2006-04-24 Sold (MLS) $184,300 Stellar MLS as Distributed by MLS Grid
- 2005-11-02 Listed $187,410 Stellar MLS as Distributed by MLS Grid
- 2003-12-17 Sold (Public Records) $600,000 Public Records
Property tax history
+1.8%/yrLatest (2025): $977 · +29.0% YoY. Source: county tax records.
Cash-flow waterfall
monthlySold comps — $/sqft
last 12 mo · ≤1 miLoading sold comps…