 Multi-family
1828 S Redbud St · Town of Pecos, TX
Flood risk No data
- FEMA flood zone
- —
- Chance of flooding over 30 yrs
- —
- Est. flood insurance / yr
- —
Fire risk No data
- Est. fire insurance / yr
- —
Heat risk No data
- Hot days now (above threshold)
- —
- Hot days in 30 yrs
- —
Wind risk No data
- Chance of severe wind over 30 yrs
- —
Air-quality risk No data
- Unhealthy air days now
- —
- Unhealthy air days in 30 yrs
- —
Risk factors via First Street. Map © Google.
Why this score? — see what drove the C grade
The composite is a weighted blend of 9 inputs, each scored 0–100. Each bar is that input's sub-score; the figure is the points it added to the 100-point composite (weight × sub-score).
- Cash flow +24.1/30.0
- DSCR +7.8/10.0
- ARV discount +7.5/15.0
- 1% rule +6.3/10.0
- Appreciation +4.5/10.0
- Rent growth +2.5/5.0
- Schools +2.5/10.0
- Livability +2.5/5.0
- Condition / age +2.2/5.0
$225,000
🖨 Deal sheet 📄 Offer letter ✓ Due diligence
Multi-family units
County records classify this as Multi-Family (2-4 Unit). Listing-text estimate: 1 unit. estimate disagrees with records
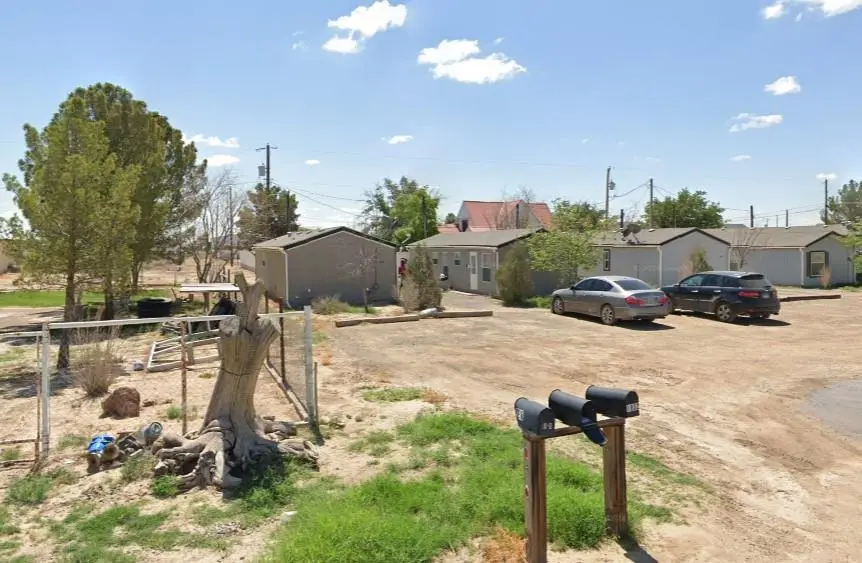
Listing remarks MLS
Own two mobile homes in Pecos, TX, perfect for housing oil field workers! Built in 2012 and well-maintained, these 2-bedroom, 2-bathroom homes offer comfortable living spaces and a convenient location near major oil fields. This is a fantastic opportunity to invest in turnkey housing solutions for your crew or as rental properties in high demand. Contact us today to schedule a viewing and explore this excellent investment!
Key facts
- 0.47 acre lot
- Built 2012
- Listed 164 days
Neighborhood map
What this means for you Summary
Snapshot
- This is a multifamily listed at $225k. Condition is rated fair.
Deal economics
- At list price, monthly cash flow is $445 ($5k/yr) — positive.
- The deal already cash-flows at list — no discount required.
- Meets the 1% rule at list price ($3k rent vs $225k).
- Recommended offer: $198k (12.0% below list) — sets the bar for market timing.
Location & tenants
- Location reads: area grade C — affects rentability + tenant quality, not the cash-flow math above.
- Pecos-Barstow-Toyah ISD (town): math 28% / reading 30% proficiency, ranked #652 of 826 in TX (top 79%) — low school quality limits family demand, transient renter base, plan for 1-2y turnover; 66% free/reduced lunch — lower-income household profile, screen leases tightly.
- Market conditions: 88 active listings in the ZIP; 22 units permitted in Reeves County in 2024 (0 in 5+ unit buildings).
Forward outlook
- Local home prices are declining (-1.1%/yr); year-one equity from $2k of loan paydown is wiped out by about $2k of value loss. Plan a longer hold.
- Reeves County population projected at +45% by 2050 — long-run rental-demand tailwind backs the buy-and-hold thesis.
- At projected returns (-1.1% appreciation + 3.0% rent growth), your $63k cash investment doubles in ~9 years — after that, you're playing with house money.
Negotiation context
- It's been on market 164 days — a 12% lower offer ($198k) is reasonable based on typical stale-listing flexibility.
Questions for the listing agent
- It's been on market 164 days. Have you received any prior offers? Is the seller open to a 12% concession, seller financing, or rate buy-down credit?
- Have any recent inspections been done? Can we get a copy of the seller's disclosures and any deferred-maintenance estimates?
- Why hasn't it sold? Are there any deal-killer items the seller is aware of (foundation, flood, title, zoning, code violations)?
- Is there a deadline driving the sale (1031 exchange, divorce, estate, relocation)? That informs how much negotiation room exists.
- What's the average days-on-market for RENTAL listings here right now (not sales)? A rising rental-DOM trend means longer vacancies and softer asking-rent achievability than the comps imply.
- What's the recent tenant-quality profile in this submarket — average credit score on applications, eviction rate, late-payment / NSF rate, and stable-employment percentage? A property-management company in the area should have these aggregated.
- How much new apartment / multifamily construction is in the pipeline within 1–3 miles? Heavy new supply (>2% of stock underway) typically softens rents 12–24 months out; light construction supports rent growth.
Investment metrics
- 1% rule
- 1.13% ✓
- Cap rate
- 8.67%
- Cash-on-cash
- 8.48%
- DSCR
- 1.38
- GRM
- 7.4
CMA / ARV
No comps found within radius.
Projected returns pro-forma
-1.09% appreciation · 3.0% rent growth · sell at horizon
- IRR
- 3.8%
- Equity multiple
- 1.17×
- Total profit
- $10,559
- Equity at exit
- $53,352
- IRR
- 10.4%
- Equity multiple
- 2.00×
- Total profit
- $63,275
- Equity at exit
- $55,210
Cash invested: $63,000 (down + closing). Projections, not guarantees.
Landlord ↔ Tenant lean methodology
- Overall (STATE)
- 87 Strongly Landlord-Friendly
- State Texas
- 87 Strongly Landlord-Friendly · R+5
- County
- — inherits STATE
- City
- — inherits STATE
ZIP-level market 79772
- Home prices YoY
- -0.7%
- Active inventory
- 88
- Price-to-rent
- 14.8×
Monthly cashflow live
- Estimated rent
- $2,532 medium interval (Pro) →
- Mortgage (P&I)
- −$1,180
- Tax est. 1.5%
- −$281 /mo · $3,375/yr
- Insurance
- −$94
- HOA
- −$0
- Vacancy / Maint / Mgmt
- −$532
- Net cashflow
- $445
Break-even live
2-unit breakdown (identical units grouped — click to expand)
| Units | Beds | Baths | Est. rent |
|---|---|---|---|
| 2× units | 2 | 2 | $2,532 |
| #1 | 2 | 2 | $1,266 |
| #2 | 2 | 2 | $1,266 |
| Total (2 units) | $2,532 | ||
UW: 25.0% down · 7.5% · 30yr · 1.5% tax · 5.0% vac · 8.0% maint · 8.0% mgmt
Financing live
Cash to close
- Down payment
- $56,250
- Closing costs
- $6,750
- Reserves months
- —
- Total cash needed
- —
Loan-product check · same deal, 3 products live
Conventional
25% down · 7.5% · 30yr
- Down + closing
- —
- Monthly P&I
- —
- Monthly cashflow
- —
- DSCR
- —
- Eligible?
- —
Personal DTI + credit; lowest rate.
DSCR
20% down · 8.5% · 30yr
- Down + closing
- —
- Monthly P&I
- —
- Monthly cashflow
- —
- DSCR
- —
- Eligible?
- —
No personal income docs; deal must DSCR.
Hard money
10% down · 12.0% · 12mo
- Down + closing
- —
- Monthly P&I
- —
- Monthly cashflow
- —
- DSCR
- —
- Eligible?
- —
Short-term bridge; refi at stabilization.
Listing history 16 events
-
2026-06-18days on market $225,000 Active 164 DOM
-
2026-06-17days on market $225,000 Active 163 DOM
-
2026-06-16days on market $225,000 Active 162 DOM
-
2026-06-15days on market $225,000 Active 161 DOM
-
2026-06-15days on market $225,000 Active 160 DOM
-
2026-06-13days on market $225,000 Active 159 DOM
-
2026-06-12days on market $225,000 Active 158 DOM
-
2026-06-10days on market $225,000 Active 155 DOM
-
2026-06-08days on market $225,000 Active 154 DOM
-
2026-06-08days on market $225,000 Active 153 DOM
-
2026-06-07days on market $225,000 Active 152 DOM
-
2026-06-03days on market $225,000 Active 149 DOM
-
2026-06-02days on market $225,000 Active 148 DOM
-
2026-06-01days on market $225,000 Active 147 DOM
-
2026-05-31days on market $225,000 Active 146 DOM
-
2026-01-05$225,000 Active 426-char remark
Show marketing remark (426 chars)
Own two mobile homes in Pecos, TX, perfect for housing oil field workers! Built in 2012 and well-maintained, these 2-bedroom, 2-bathroom homes offer comfortable living spaces and a convenient location near major oil fields. This is a fantastic opportunity to invest in turnkey housing solutions for your crew or as rental properties in high demand. Contact us today to schedule a viewing and explore this excellent investment!
ⓘ Source: listings_history table (triggers on properties + properties_extension) + one-shot
backfill from property_details.listing_events for pre-trigger history.
Nearby sold comps map
Loading sold comps map…
Walkable amenities ~0.75 mi
Loading nearby amenities…
Taxation est. · year 1
- Rental income
- $30,384
- − Mortgage interest
- −$12,603
- − Property taxes
- −$3,375
- − Insurance
- −$1,125
- − Repairs & maintenance
- −$2,431
- − Management
- −$2,431
- − Depreciation
- −$6,545
- Taxable income
- $1,874
- Est. tax owed @ 24.0%
- −$450
- After-tax cash flow
- $4,895/yr
For passive investors: Depreciation is non-cash, so a rental often shows a tax loss while cash-flowing — sheltering income. Rental losses are passive: they offset passive income freely, and up to $25,000/yr can offset ordinary (W-2) income if you actively participate and your MAGI is under $100k (phasing out to $0 by $150k); unused losses carry forward. On sale, claimed depreciation is recaptured at up to 25%, and gains may owe capital-gains tax (a 1031 exchange can defer both). Figures are a year-1 estimate at your 24.0% rate — not tax advice; consult a CPA.
Condition & rehab AI · 5 photos
This multi-family property in Pecos, TX, requires moderate rehabilitation to improve its condition and increase its value for resale and rental purposes.
Repairs flagged
- Major Landscaping — No visible landscaping or curb appeal features.
- Minor Exterior cleaning — Dirt and debris around the property.
- Minor Paint touch-ups — Some wear on the paint.
- Minor Kitchen appliances — Stainless steel appliances are in good condition.
- Unknown Bathroom fixtures — Not visible in the provided photos.
- Unknown Roof inspection — Not visible in the provided photos.
- Unknown HVAC inspection — Not visible in the provided photos.
- Unknown Foundation inspection — Not visible in the provided photos.
Value-add opportunities
- Both Landscaping and curb appeal improvements — Enhances both resale and rental value.
- Both Paint touch-ups — Improves the home's appearance and value.
- Both Kitchen and bathroom updates — Modernizes the home and improves functionality.
- Both HVAC and roof inspections — Ensures the home is in good condition and safe for occupants.
Renovation cost estimate screening
| Repair item | Severity | Est. cost |
|---|---|---|
| Landscaping · No visible landscaping or curb appeal features. | Major | $15,000–50,000 |
| Exterior cleaning · Dirt and debris around the property. | Minor | $500–3,000 |
| Paint touch-ups · Some wear on the paint. | Minor | $500–3,000 |
| Kitchen appliances · Stainless steel appliances are in good condition. | Minor | $500–3,000 |
| Bathroom fixtures · Not visible in the provided photos. | Unknown | $500–3,000 |
| Roof inspection · Not visible in the provided photos. | Unknown | $500–3,000 |
| HVAC inspection · Not visible in the provided photos. | Unknown | $500–3,000 |
| Foundation inspection · Not visible in the provided photos. | Unknown | $500–3,000 |
| Total estimated repair cost · 8 items | $18,500–71,000 |
Value-add ROI direction
- Both Landscaping and curb appeal improvements — Enhances both resale and rental value. ↑
- Both Paint touch-ups — Improves the home's appearance and value. ↑
- Both Kitchen and bathroom updates — Modernizes the home and improves functionality. ↑
- Both HVAC and roof inspections — Ensures the home is in good condition and safe for occupants. ↑
ⓘ Cost ranges are severity-bucket heuristics (US national rule-of-thumb). Get contractor quotes + a written scope before underwriting a rehab budget.
Schools (NCES district)
- District
- Pecos-Barstow-Toyah ISD
- NCES district ID
- 4834550
- Math proficiency
- 28% ▼ -7.00%
- Reading proficiency
- 30% ▲ 1.00%
- Median HH income
- $41,982
- Composite
- 24.61/100
- National rank
- #7632
- State rank
- #652 of 826 in TX
Livability — Town of Pecos
No livability data for this city. (Only ~50 U.S. cities are tracked.)
Census & demographics
- Census place
- Town of Pecos, TX
- City population
- 12,547
- Population (ZIP)
- 12,547
Population outlook (Reeves County) Hauer SSP2
- Today (2025)
- 17,069 people
- By 2030
- 18,407 · +7.8%
- By 2040
- 21,342 · +25.0%
- By 2050
- 24,701 · +44.7%
- By 2075
- 32,688 · +91.5%
- By 2100
- 36,117 · +111.6%
Race, ethnicity, and origin ACS 2023
- Neighborhood character
- Predominantly Hispanic (85%)
- Race & ethnicity
- Hispanic / Latino 85% Two or more races 22% White 12% Black 2% Native American 1%
- Hispanic origin (detail)
- Mexican 78%
- Common ancestry
- Iranian 1% Serbian 1%
- Foreign-born
- 19% · Canada
- Languages at home
- 38% English-only · Spanish 62%
Political lean MEDSL · Reeves
- 2024 margin
- Solid R (+36.9) · D 31.1% · R 68.0%
- 2008→2024 swing
- -42.2pp toward R · 2008: 5.2pp · 2024: -36.9pp
- All cycles
- 2024: R+36.9 2020: R+23.3 2016: D+7.6 2012: D+16.2 2008: D+5.2
Not yet ingested
- Civics
- —
Market trends
- HPI YoY
- ▼ -1.09%
- Current HPI
- 147.9377
- Rent YoY
- —
- Metro
- —
- State GDP YoY
- ▲ 3.95%
- F500 in state
- 110
Industry mix (Fortune 500 HQ in TX)
| Industry | F500 HQs | Revenue |
|---|---|---|
| Energy | 16 | $1,198B |
|
||
| Technology | 5 | $198B |
|
||
| Engineering / Construction | 4 | $72B |
|
||
| Energy Services | 3 | $60B |
|
||
| Utilities | 3 | $41B |
|
||
| Healthcare | 2 | $330B |
|
||
Price history
1 event — show timeline
- 2026-01-05 Listed $225,000 PBBOR
Cash-flow waterfall
monthlySold comps — $/sqft
last 12 mo · ≤1 miLoading sold comps…