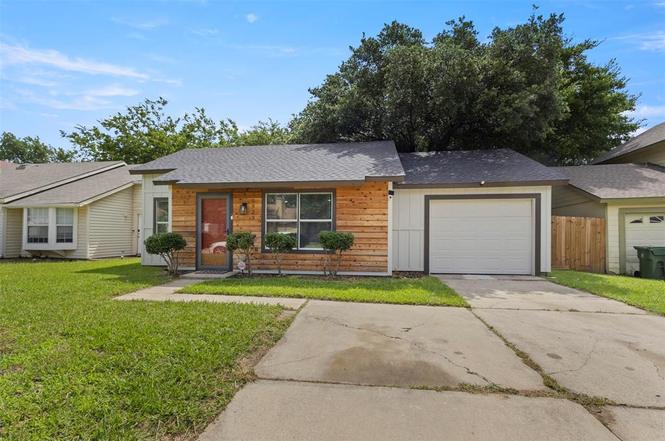
5523 Safari Trl · Arlington, TX
Flood risk 1/10 · Minimal
- FEMA flood zone
- X (unshaded)
- Chance of flooding over 30 yrs
- 0.0%
- Est. flood insurance / yr
- $507 – $1,088
Fire risk 3/10 · Minor
- Est. fire insurance / yr
- $1,222 – $2,270
Heat risk 7/10 · Major
- Hot days now (above 110°F)
- 7 days/yr
- Hot days in 30 yrs
- 23 days/yr
Wind risk 6/10 · Moderate
- Chance of severe wind over 30 yrs
- 27.0%
Air-quality risk 3/10 · Minor
- Unhealthy air days now
- 2 days/yr
- Unhealthy air days in 30 yrs
- 4 days/yr
Risk factors via First Street. Map © Google.
Why this score? — see what drove the D grade
The composite is a weighted blend of 9 inputs, each scored 0–100. Each bar is that input's sub-score; the figure is the points it added to the 100-point composite (weight × sub-score).
- Cash flow +13.1/30.0
- ARV discount +7.5/15.0
- 1% rule +3.9/10.0
- DSCR +3.9/10.0
- Livability +3.9/5.0
- Rent growth +2.8/5.0
- Schools +2.5/10.0
- Condition / age +2.5/5.0
- Appreciation +0.7/10.0
$225,000
🖨 Deal sheet 📄 Offer letter ✓ Due diligence
Listing remarks MLS
Charming Remodeled Home – Move-In Ready! Welcome to this beautifully remodeled 2-bedroom, 1-bath home featuring a stylish Jack & Jill bathroom. The home boasts new vinyl flooring throughout the living area, kitchen, and bathroom, with cozy new carpet in both bedrooms. The updated kitchen is equipped with sleek stainless steel appliances, quartz countertops, and brand-new cabinetry, perfect for cooking and entertaining. Enjoy a spacious backyard, ideal for relaxing or hosting gatherings. Conveniently located just minutes from major freeways, shopping centers, and the mall, this home offers both comfort and accessibility. Perfect for a small family or first-time homebuyer looking for a fresh start in a modern and inviting space.
Key facts
- 5,837 sq ft lot
- Garage
- Built 1984
Property features AI
Finance
- Other: Refrigerator excluded from sale
- Financial info: No second mortgage reported; Treat as clear loan type
- HOA & community: No homeowners association
Exterior
- Parking: Detached garage; 1 covered parking space; 1 garage space; Attached garage present
- Utilities: Cable available; City sewer; City water; Not in a municipal utility district
- Home design: Single family residence; One story; Residential property
- Construction: Built in 1984; Preowned
- Exterior features: Lot in Newport Village subdivision; Less than 0.5 acre lot
Interior
- Kitchen: Dishwasher; Electric range; Kitchen island; Granite counters
- Bedrooms: Primary bedroom on level 1 (approx. 10 x 10)
- Bathrooms: 1 full bathroom
- Interior features: Cable TV available; Decorative lighting; Granite counters; Kitchen island; One living area; One dining area; Room count: 2
Neighborhood map
What this means for you Summary
Snapshot
- This is a 3-bed/1.0-bath single-family listed at $225k.
Deal economics
- At list price, monthly cash flow is $-7 ($-84/yr) — negative.
- To cash-flow at today's rent, offer at most $224k (0.5% below list).
- To meet the 1% rule (rent ≥ 1% of price), the offer needs to be $201k (10.7% below list).
- Recommended offer: $201k (10.7% below list) — sets the bar for 1% rule.
- Cap rate 6.3% vs local median 3.7% in Arlington — top-decile yield for the area; either an underpriced asset or a hidden risk that comps aren't pricing in. Stress-test before assuming the spread holds.
Location & tenants
- Location reads 78/100 on livability (#75 in TX, #2,697 nationally) — a middle-class / working-renter tenant base. Strengths: amenities A+, cost of living A+, housing A+; Watch: crime F, commute F.
- Arlington ISD (urban): math 24% / reading 34% proficiency, ranked #629 of 826 in TX (top 76%) — low school quality limits family demand, transient renter base, plan for 1-2y turnover.
- Zoned schools: Fitzgerald El (math 36% / reading 37%, grade F, #1,883 of 4,322 statewide, top 44%, 531 students, 86% FRL) — zoned schools average 86% FRL vs 60% district-wide (26 pts higher); higher-poverty schools than district average — tighter screening recommended.
- Market conditions: Rents rising (+1.4%/yr); 76 active listings in the ZIP; 1 comparable units currently listed for rent nearby; solid renter incomes; 18,938 units permitted in Tarrant County in 2024 (8,336 in 5+ unit buildings).
Forward outlook
- Local home prices are declining (-3.0%/yr); year-one equity from $2k of loan paydown is wiped out by about $7k of value loss. Plan a longer hold.
- Tarrant County population projected at +41% by 2050 — long-run rental-demand tailwind backs the buy-and-hold thesis.
Negotiation context
- Only 3 days on market — expect competitive offers; lowballing is unlikely to land.
- 3 sale attempts since 18y ago with the ask held roughly flat each time — persistent listings suggest the price (not the market) is what's stuck; bring a comps-based counter.
Risks & watch-outs
- Climate carrying-cost: major wind risk, 27% chance of damaging wind over 30y; extreme-heat days projected 7→23/yr by 2055 (HVAC capex compounding) — expect insurance premiums to compound above CPI over the hold.
Questions for the listing agent
- What do current leases actually rent for vs. the listed asking? Can we see a recent rent roll and the last 12 months of T-12 income?
- Is there a deadline driving the sale (1031 exchange, divorce, estate, relocation)? That informs how much negotiation room exists.
- Schools are D-rated, which usually means shorter tenancies and higher turnover. Who's the typical renter profile here, and what's been the actual vacancy rate?
- Crime grade is F in this area — have there been break-ins, vandalism, or insurance claims at this property in the last 3 years? What carrier currently insures it and at what premium?
- The area grade is low — what's the realistic commute time and amenity access for the typical tenant pool here? Any planned neighborhood developments (good or bad) we should know about?
- What's the average days-on-market for RENTAL listings here right now (not sales)? A rising rental-DOM trend means longer vacancies and softer asking-rent achievability than the comps imply.
- What's the recent tenant-quality profile in this submarket — average credit score on applications, eviction rate, late-payment / NSF rate, and stable-employment percentage? A property-management company in the area should have these aggregated.
- How much new for-sale + rental construction is in the pipeline within 1–3 miles? Heavy new supply typically softens prices + rents 12–24 months out; constrained supply supports both.
Investment metrics
- 1% rule
- 0.89% ✗
- Cap rate
- 6.26%
- Cash-on-cash
- -0.13%
- DSCR
- 0.99
- GRM
- 9.3
CMA / ARV
- ARV (on-the-fly)
- $224,874
- Comps found
- 2
Show comp detail 2 sales within ~0.75 mi
| Address | Dist | Beds/Ba | Sqft | Sold | Price | $/sf | Match |
|---|---|---|---|---|---|---|---|
| 5523 Safari Trl | 0.00mi | 2/1.0 (-1) | 806 (0%) | 11mo | $225,000 | $279 | 86 |
| 5514 Bridgeton Dr | 0.03mi | 2/1.0 (-1) | 872 (+8%) | 18mo | $220,000 | $252 | 65 |
Match score weights: distance 35% · size 25% · config 20% · recency 20%. Top-matched comps best support the ARV.
Projected returns pro-forma
-3.0% appreciation · 1.39% rent growth · sell at horizon
- IRR
- -18.4%
- Equity multiple
- 0.36×
- Total profit
- $-40,053
- Equity at exit
- $33,548
- IRR
- -14.3%
- Equity multiple
- 0.24×
- Total profit
- $-47,955
- Equity at exit
- $19,454
Cash invested: $63,000 (down + closing). Projections, not guarantees.
Landlord ↔ Tenant lean methodology
- Overall (STATE)
- 87 Strongly Landlord-Friendly
- State Texas
- 87 Strongly Landlord-Friendly · R+5
- County
- — inherits STATE
- City
- — inherits STATE
ZIP-level market 76018
- Home prices YoY
- -2.8%
- Rents YoY
- 1.4%
- Active inventory
- 76
- Price-to-rent
- 9.3×
Monthly cashflow live
- Estimated rent
- $2,009 medium interval (Pro) →
- Mortgage (P&I)
- −$1,180
- Tax from tax record
- −$321 /mo · $3,848/yr
- Insurance
- −$94
- HOA
- −$0
- Vacancy / Maint / Mgmt
- −$422
- Net cashflow
- $-7
Break-even live
UW: 25.0% down · 7.5% · 30yr · 1.5% tax · 5.0% vac · 8.0% maint · 8.0% mgmt
Financing live
Cash to close
- Down payment
- $56,250
- Closing costs
- $6,750
- Reserves months
- —
- Total cash needed
- —
Loan-product check · same deal, 3 products live
Conventional
25% down · 7.5% · 30yr
- Down + closing
- —
- Monthly P&I
- —
- Monthly cashflow
- —
- DSCR
- —
- Eligible?
- —
Personal DTI + credit; lowest rate.
DSCR
20% down · 8.5% · 30yr
- Down + closing
- —
- Monthly P&I
- —
- Monthly cashflow
- —
- DSCR
- —
- Eligible?
- —
No personal income docs; deal must DSCR.
Hard money
10% down · 12.0% · 12mo
- Down + closing
- —
- Monthly P&I
- —
- Monthly cashflow
- —
- DSCR
- —
- Eligible?
- —
Short-term bridge; refi at stabilization.
Rent comps 1 comps
| Address | Beds | Baths | Sqft | Rent | $/sqft | DOM | Units | Dist |
|---|---|---|---|---|---|---|---|---|
| 5503 Creek Valley Dr Arlington, TX | 2.0 | 1.0 | 1063 | $1,795 | $1.69 | 44d | 1 | 0.10mi |
Listing history 4 events
-
2026-06-18days on market $225,000 Active 3 DOM
-
2026-06-17days on market $225,000 Active 2 DOM
-
2026-06-15remarks 699-char remark
-
2026-06-15$225,000 Active 1 DOM
ⓘ Source: listings_history table (triggers on properties + properties_extension) + one-shot
backfill from property_details.listing_events for pre-trigger history.
Tax reassessment forecast TX · Resets to sale price
- Current annual tax
- $3,848 · $321/mo
- Projected year-2 tax
- $4,118 · $343/mo
- Expected delta
- +$270/yr (+$22/mo · 7.0%)
ⓘ Screening estimate from a state-policy table — verify with the county assessor before closing.
Climate risk First Street
- Flood 1/10 Low FEMA zone X (unshaded) · 0% chance over 30 yrs
- Wildfire 3/10 Moderate
- Heat 7/10 Severe 7 d/yr ≥110°F today · 23 d/yr by 30 yrs out
- Wind 6/10 Major 27% chance of damaging wind over 30 yrs
- Air quality 3/10 Moderate 2 unhealthy d/yr today · 4 by 30 yrs out
Nearby sold comps map
Loading sold comps map…
Walkable amenities ~0.75 mi
Loading nearby amenities…
Taxation est. · year 1
- Rental income
- $24,111
- − Mortgage interest
- −$12,603
- − Property taxes
- −$3,848
- − Insurance
- −$1,125
- − Repairs & maintenance
- −$1,929
- − Management
- −$1,929
- − Depreciation
- −$6,545
- Taxable loss
- −$3,868
- Est. tax savings @ 24.0%
- +$928
- After-tax cash flow
- $845/yr
For passive investors: Depreciation is non-cash, so a rental often shows a tax loss while cash-flowing — sheltering income. Rental losses are passive: they offset passive income freely, and up to $25,000/yr can offset ordinary (W-2) income if you actively participate and your MAGI is under $100k (phasing out to $0 by $150k); unused losses carry forward. On sale, claimed depreciation is recaptured at up to 25%, and gains may owe capital-gains tax (a 1031 exchange can defer both). Figures are a year-1 estimate at your 24.0% rate — not tax advice; consult a CPA.
Schools (NCES district)
- District
- Arlington ISD
- NCES district ID
- 4808700
- Math proficiency
- 24% ▼ -21.00%
- Reading proficiency
- 34% ▼ -8.00%
- Median HH income
- $50,873
- Composite
- 25.42/100
- National rank
- #7458
- State rank
- #629 of 826 in TX
Livability — Arlington
- Score
- 78/100
- State rank
- #75
- US rank
- #2697
Category grades
Schools grade is shown separately in the Schools card above.
Census & demographics
- Census place
- Arlington, TX
- County
- Tarrant County · 2,033,669 people
- City population
- 366,588
- Metro
- Dallas-Fort Worth-Arlington, TX
- Population (ZIP)
- 26,834
- Household income
- $88,288
- Rent vs Own
- Severe rent burden
- 598.0
Population outlook (Tarrant County) Hauer SSP2
- Today (2025)
- 2,380,417 people
- By 2030
- 2,578,900 · +8.3%
- By 2040
- 2,974,995 · +25.0%
- By 2050
- 3,350,489 · +40.8%
- By 2075
- 4,216,909 · +77.2%
- By 2100
- 4,741,527 · +99.2%
Race, ethnicity, and origin ACS 2023
- Neighborhood character
- Highly diverse neighborhood (Simpson 0.76)
- Race & ethnicity
- Hispanic / Latino 34% Black 24% White 23% Asian 14% Two or more races 14% Native American 2%
- Hispanic origin (detail)
- Mexican 26%
- Common ancestry
- Slovak 1% Romanian 1% Lithuanian 0%
- Foreign-born
- 20% · Canada, Vietnam
- Languages at home
- 62% English-only · Spanish 22% Vietnamese 11% French/Haitian/Cajun 1%
Political lean MEDSL · Tarrant
- 2024 margin
- Lean R (+5.1) · D 46.7% · R 51.9% · Other 1.4%
- 2008→2024 swing
- +6.6pp toward D · 2008: -11.7pp · 2024: -5.1pp
- All cycles
- 2024: R+5.1 2020: D+0.2 2016: R+8.7 2012: R+15.7 2008: R+11.7
Not yet ingested
- Civics
- —
Market trends
- HPI YoY
- ▼ -8.64%
- Current HPI
- 296.8765
- Rent YoY
- ▲ 1.39%
- Metro
- Dallas-Fort Worth-Arlington, TX
- State GDP YoY
- ▲ 3.95%
- F500 in state
- 110
Industry mix (Fortune 500 HQ in TX)
| Industry | F500 HQs | Revenue |
|---|---|---|
| Energy | 16 | $1,198B |
|
||
| Technology | 5 | $198B |
|
||
| Engineering / Construction | 4 | $72B |
|
||
| Energy Services | 3 | $60B |
|
||
| Utilities | 3 | $41B |
|
||
| Healthcare | 2 | $330B |
|
||
Price history
+331.0% since first listed11 events — show timeline
- 2026-06-15 Listed $225,000 NTREIS
- 2025-07-10 Sold (Public Records) — Public Records
- 2025-07-10 Sold (MLS) — NTREIS
- 2025-06-23 Pending — NTREIS
- 2025-06-15 Contingent — NTREIS
- 2025-06-08 Listed $225,000 NTREIS
- 2008-05-30 Sold (Public Records) — Public Records
- 2008-05-28 Sold (MLS) — NTREIS
- 2008-03-10 Listing Removed — NTREIS
- 2008-01-11 Listed $52,200 NTREIS
- 1985-08-13 Sold (Public Records) — Public Records
Property tax history
+8.5%/yrLatest (2025): $3,848 · -8.7% YoY. Source: county tax records.
Cash-flow waterfall
monthlySold comps — $/sqft
last 12 mo · ≤1 miLoading sold comps…