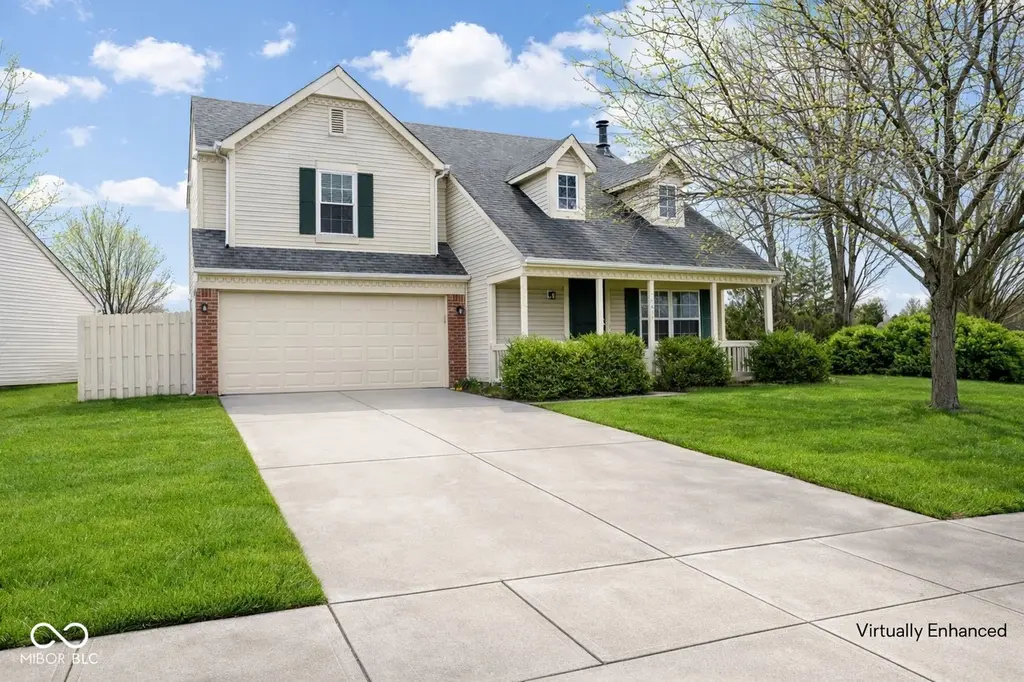
10877 Washington Bay Dr · Fishers, IN
Flood risk 1/10 · Minimal
- FEMA flood zone
- X (unshaded)
- Chance of flooding over 30 yrs
- 0.0%
- Est. flood insurance / yr
- $507 – $1,088
Fire risk 1/10 · Minimal
- Est. fire insurance / yr
- $717 – $1,331
Heat risk 3/10 · Minor
- Hot days now (above 101°F)
- 7 days/yr
- Hot days in 30 yrs
- 18 days/yr
Wind risk 2/10 · Minimal
- Chance of severe wind over 30 yrs
- 1.0%
Air-quality risk 3/10 · Minor
- Unhealthy air days now
- 2 days/yr
- Unhealthy air days in 30 yrs
- 3 days/yr
Risk factors via First Street. Map © Google.
Why this score? — see what drove the D grade
The composite is a weighted blend of 9 inputs, each scored 0–100. Each bar is that input's sub-score; the figure is the points it added to the 100-point composite (weight × sub-score).
- Cash flow +12.2/30.0
- ARV discount +6.3/15.0
- Schools +5.3/10.0
- Rent growth +4.2/5.0
- Livability +4.2/5.0
- DSCR +3.6/10.0
- 1% rule +2.9/10.0
- Condition / age +2.5/5.0
- Appreciation +0.0/10.0
$309,900
🖨 Deal sheet (PDF) 📄 Offer letter ✓ Due diligence
Listing remarks MLS
WOW! MOVE - RIGHT- INTO THIS UPDATED BRIGHT & OPEN HOME IN ONE OF FISHERS' MOST DESIRED LOCATIONS! ALL NEW: TANKLESS WATER HEATER, HEATED CERAMIC TILE FLOOR IN MASTER BATH, COMPLETELY UPDATED KITCHEN INCLUDING FLOOR AND COUNTERS, HOME AUTOMATED LIGHTING SYSTEM. FULL WHITE PICKET FENCE, GAS FIREPLACE, VAULTED CEILINGS & ALL APPLIANCES. ENJOY THE PRIVATE SETTING W/POND VIEW & HUGE SIDE YARD WITH NO NEIGHBOR NEXT DOOR. DON'T MISS OUT ON THIS WONDERFUL HOME! IT WILL NOT LAST!
Key facts
- Recent updates
- Updated kitchen
- Spacious garage
Tags
Neighborhood map
What this means for you Summary
Snapshot
- This is a 3-bed/2.5-bath single-family listed at $310k.
Deal economics
- At list price, monthly cash flow is $-64 ($-766/yr) — negative.
- To cash-flow at today's rent, offer at most $299k (3.6% below list).
- To meet the 1% rule (rent ≥ 1% of price), the offer needs to be $244k (21.1% below list).
- Recommended offer: $244k (21.1% below list) — sets the bar for 1% rule.
- Cap rate 6.0% vs local median 3.6% in Fishers — top-decile yield for the area; either an underpriced asset or a hidden risk that comps aren't pricing in. Stress-test before assuming the spread holds.
Location & tenants
- Location reads 83/100 on livability (#11 in IN, #898 nationally) — a professional / high-income tenant draw. Strengths: crime A+, amenities A+, employment A+; Watch: commute F.
- Hamilton Southeastern Schools (suburban): math 57% / reading 59% proficiency, ranked #14 of 301 in IN (top 5%) — acceptable for families but not a draw, mixed tenant base, ~2y average lease; only 10% free/reduced lunch — higher-income household profile.
- Zoned schools: Lantern Road Elementary School (math 75% / reading 59%, grade B+, #55 of 994 statewide, top 6%, 524 students, 14% FRL); Riverside Junior High (math 42% / reading 56%, grade C-, #53 of 330 statewide, top 16%, 895 students, 25% FRL); Hamilton Southeastern Hs (math 66% / reading 85%, grade A-, #7 of 369 statewide, top 2%, 3,450 students, 15% FRL).
- Market conditions: Rents rising fast (+6.7%/yr); 329 active listings in the ZIP; 21 comparable units currently listed for rent nearby; rentals leasing fast (median 1d on market — plan ~1-2 weeks tenant-placement turnaround); high-income renter base; 4,661 units permitted in Hamilton County in 2024 (1,528 in 5+ unit buildings).
Forward outlook
- Local home prices are declining (-3.0%/yr); year-one equity from $2k of loan paydown is wiped out by about $9k of value loss. Plan a longer hold.
- Hamilton County population projected at +44% by 2050 — long-run rental-demand tailwind backs the buy-and-hold thesis.
Negotiation context
- Only 6 days on market — expect competitive offers; lowballing is unlikely to land.
- 4 sale attempts since 25y ago with the ask held roughly flat each time — persistent listings suggest the price (not the market) is what's stuck; bring a comps-based counter.
- Current owner paid $134k; list at $310k implies a 130% gain — meaningful room to come down on a strong offer.
Questions for the listing agent
- What do current leases actually rent for vs. the listed asking? Can we see a recent rent roll and the last 12 months of T-12 income?
- What does the HOA fee cover, when was the last increase, and are there any pending special assessments or reserve-fund shortfalls?
- Is there a deadline driving the sale (1031 exchange, divorce, estate, relocation)? That informs how much negotiation room exists.
- Schools are A-rated — typically a magnet for longer-tenancy family renters. What's the average tenant stay here, and is there a school-zone premium baked into asking?
- The area grade is low — what's the realistic commute time and amenity access for the typical tenant pool here? Any planned neighborhood developments (good or bad) we should know about?
- What's the average days-on-market for RENTAL listings here right now (not sales)? A rising rental-DOM trend means longer vacancies and softer asking-rent achievability than the comps imply.
- What's the recent tenant-quality profile in this submarket — average credit score on applications, eviction rate, late-payment / NSF rate, and stable-employment percentage? A property-management company in the area should have these aggregated.
- How much new for-sale + rental construction is in the pipeline within 1–3 miles? Heavy new supply typically softens prices + rents 12–24 months out; constrained supply supports both.
Investment metrics
- 1% rule
- 0.79% ✗
- Cap rate
- 6.05%
- Cash-on-cash
- -0.88%
- DSCR
- 0.96
- GRM
- 10.6
CMA / ARV
- ARV (on-the-fly)
- $302,100
- Comps found
- 12
Show comp detail 12 sales within ~0.75 mi
| Address | Dist | Beds/Ba | Sqft | Sold | Price | $/sf | Match |
|---|---|---|---|---|---|---|---|
| 10877 Washington Bay Dr | 0.00mi | 2/2.5 (-1) | 1,325 (0%) | 1mo | $302,500 | $228 | 94 |
| 10880 Washington Bay Dr | 0.03mi | 3/2.0 | 1,334 (+1%) | 9mo | $319,000 | $239 | 88 |
| 10864 Washington Bay Dr | 0.06mi | 2/2.0 (-1) | 1,356 (+2%) | 2mo | $315,000 | $232 | 84 |
| 9304 Maryland Ct | 0.13mi | 2/2.0 (-1) | 1,348 (+2%) | 4mo | $297,000 | $220 | 80 |
| 10872 Washington Bay Dr | 0.04mi | 2/2.0 (-1) | 1,272 (-4%) | 8mo | $292,500 | $230 | 78 |
| 10695 Kyle Ct | 0.18mi | 3/2.0 | 1,294 (-2%) | 16mo | $305,000 | $236 | 73 |
| 10820 Washington Bay Dr | 0.13mi | 2/2.0 (-1) | 1,424 (+8%) | 13mo | $315,000 | $221 | 64 |
| 9776 Overcrest Dr | 0.46mi | 3/2.0 | 1,366 (+3%) | 10mo | $309,900 | $227 | 63 |
| 10656 Adam Ct | 0.33mi | 3/2.0 | 1,246 (-6%) | 14mo | $328,000 | $263 | 61 |
| 10832 Washington Bay Dr | 0.16mi | 2/2.5 (-1) | 1,487 (+12%) | 10mo | $315,000 | $212 | 59 |
| 9667 Overcrest Dr | 0.45mi | 3/2.0 | 1,415 (+7%) | 15mo | $315,000 | $223 | 54 |
| 8838 Moll Dr | 0.69mi | 3/1.5 | 1,368 (+3%) | 17mo | $298,000 | $218 | 44 |
Match score weights: distance 35% · size 25% · config 20% · recency 20%. Top-matched comps best support the ARV.
Projected returns pro-forma
-3.0% appreciation · 6.71% rent growth · sell at horizon
- IRR
- -14.0%
- Equity multiple
- 0.48×
- Total profit
- $-44,877
- Equity at exit
- $46,207
- IRR
- -0.4%
- Equity multiple
- 0.97×
- Total profit
- $-2,621
- Equity at exit
- $26,794
Cash invested: $86,772 (down + closing). Projections, not guarantees.
Landlord ↔ Tenant lean methodology
- Overall (STATE)
- 90 Strongly Landlord-Friendly
- State Indiana
- 90 Strongly Landlord-Friendly · R+11
- County
- — inherits STATE
- City
- — inherits STATE
ZIP-level market 46037
- Home prices YoY
- -18.6%
- Rents YoY
- 6.7%
- Active inventory
- 329
- Price-to-rent
- 10.6×
Monthly cashflow live
- Estimated rent
- $2,444 high interval (Pro) →
- Mortgage (P&I)
- −$1,625
- Tax from tax record
- −$217 /mo · $2,607/yr
- Insurance
- −$129
- HOA
- −$23
- Vacancy / Maint / Mgmt
- −$513
- Net cashflow
- $-64
Break-even live
Sensitivity live
| Price | -10% $112 | -5% $24 | +0% $-64 | +5% $-152 | +10% $-239 |
|---|---|---|---|---|---|
| Rent | -10% $-257 | -5% $-160 | +0% $-64 | +5% $33 | +10% $129 |
| Rate | -1.0pp $92 | -0.5pp $15 | base $-64 | +0.5pp $-144 | +1.0pp $-226 |
UW: 25.0% down · 7.5% · 30yr · 1.5% tax · 5.0% vac · 8.0% maint · 8.0% mgmt
Financing live
Cash to close
- Down payment
- $77,475
- Closing costs
- $9,297
- Reserves months
- —
- Total cash needed
- —
Loan-product check · same deal, 3 products live
Conventional
25% down · 7.5% · 30yr
- Down + closing
- —
- Monthly P&I
- —
- Monthly cashflow
- —
- DSCR
- —
- Eligible?
- —
Personal DTI + credit; lowest rate.
DSCR
20% down · 8.5% · 30yr
- Down + closing
- —
- Monthly P&I
- —
- Monthly cashflow
- —
- DSCR
- —
- Eligible?
- —
No personal income docs; deal must DSCR.
Hard money
10% down · 12.0% · 12mo
- Down + closing
- —
- Monthly P&I
- —
- Monthly cashflow
- —
- DSCR
- —
- Eligible?
- —
Short-term bridge; refi at stabilization.
Rent comps 21 comps
| Address | Beds | Baths | Sqft | Rent | $/sqft | DOM | Units | Dist |
|---|---|---|---|---|---|---|---|---|
| 11255 Slate Stone Dr Fishers, IN | 1.0–4.0 | 1.0–3.5 | 1707 | $3,068 | $1.80 | 0d | 32 | 0.41mi |
| 11110 Lantern Rd Fishers, IN | 1.0–2.0 | 1.0–2.0 | 1024 | $1,889 | $1.84 | 0d | 14 | 0.63mi |
| 11150 Lantern Rd Unit 1228663P Fishers, IN | 2.0 | 2.0 | 1173 | $3,542 | $3.02 | 45d | 1 | 0.66mi |
| 10510 Kings Way Rd Fishers, IN | 2.0 | 1.0–2.0 | 649 | $1,983 | $3.06 | 0d | 26 | 0.71mi |
| 9735 Junction Sta Fishers, IN | 3.0 | 2.5 | 1520 | $3,000 | $1.97 | 45d | 1 | 0.71mi |
| 11547 Yard St Fishers, IN | 2.0 | 1.0–2.0 | 922 | $2,150 | $2.33 | 0d | 15 | 0.76mi |
| 11547 Yard St Fishers, IN | 3.0 | 1.0–2.0 | 1106 | $2,640 | $2.39 | 45d | 17 | 0.76mi |
| 8800 Bradwell Pl Fishers, IN | 1.0–2.0 | 1.0–2.0 | 1041 | $1,869 | $1.80 | 0d | 20 | 0.76mi |
| 10950 Lantern Woods Blvd Fishers, IN | 1.0–3.0 | 1.0–2.0 | 988 | $1,945 | $1.97 | 0d | 36 | 0.83mi |
| 11229 Spring Blossom Ln Fishers, IN | 3.0 | 2.0 | 1284 | $2,295 | $1.79 | 45d | 1 | 0.86mi |
| 8439 Manship Dr Fishers, IN | 4.0 | 2.0 | 1429 | $2,325 | $1.63 | 9d | 1 | 0.89mi |
| 11437 Enclave Blvd Unit 1 Fishers, IN | 2.0 | 2.0 | 1220 | $1,650 | $1.35 | 45d | 1 | 0.99mi |
| 10732 Bella Vista Dr Fishers, IN | 1.0–3.0 | 1.0–2.0 | 978 | $1,973 | $2.02 | 0d | 17 | 1.02mi |
| 11212 Boston Way Fishers, IN | 3.0 | 2.0 | 1244 | $2,345 | $1.89 | 45d | 1 | 1.05mi |
| 8700 E 116th St Fishers, IN | 2.0 | 1.0–2.5 | 1033 | $2,691 | $2.60 | 0d | 37 | 1.07mi |
| 8800 North St Fishers, IN | 1.0–2.0 | 1.0–2.0 | 924 | $2,167 | $2.34 | 0d | 18 | 1.11mi |
| 11723 Watermark Way Fishers, IN | 1.0–2.0 | 1.0–2.0 | 980 | $1,771 | $1.81 | 0d | 10 | 1.11mi |
| 8594 E 116th St Fishers, IN | 1.0–3.0 | 1.0–3.0 | 1522 | $4,065 | $2.67 | 0d | 14 | 1.16mi |
| 11757 Garden Cir E Fishers, IN | 1.0–2.0 | 1.0–2.0 | 955 | $1,690 | $1.77 | 3d | 8 | 1.33mi |
| 10272 Lakeland Dr Fishers, IN | 3.0 | 2.0 | 1350 | $2,250 | $1.67 | 5d | 1 | 1.49mi |
| 7717 Cambridge Dr Fishers, IN | 3.0 | 2.5 | 1584 | $2,100 | $1.33 | 16d | 1 | 1.50mi |
HOA detail
- Monthly dues
- $23 · $276/yr
- Likely covers
- watergas
Listing history 9 events
-
2026-03-31status Pending
-
2026-03-25$309,900 Active
-
2012-04-30historical 490-char remark
Show marketing remark (490 chars)
WOW! MOVE - RIGHT- INTO THIS UPDATED BRIGHT & OPEN HOME IN ONE OF FISHERS' MOST DESIRED LOCATIONS! ALL NEW: TANKLESS WATER HEATER, HEATED CERAMIC TILE FLOOR IN MASTER BATH, COMPLETELY UPDATED KITCHEN INCLUDING FLOOR AND COUNTERS, HOME AUTOMATED LIGHTING SYSTEM. FULL WHITE PICKET FENCE, GAS FIREPLACE, VAULTED CEILINGS & ALL APPLIANCES. ENJOY THE PRIVATE SETTING W/POND VIEW & HUGE SIDE YARD WITH NO NEIGHBOR NEXT DOOR. DON'T MISS OUT ON THIS WONDERFUL HOME! IT WILL NOT LAST!
-
2012-04-27soldstatus $134,500 490-char remark
Show marketing remark (490 chars)
WOW! MOVE - RIGHT- INTO THIS UPDATED BRIGHT & OPEN HOME IN ONE OF FISHERS' MOST DESIRED LOCATIONS! ALL NEW: TANKLESS WATER HEATER, HEATED CERAMIC TILE FLOOR IN MASTER BATH, COMPLETELY UPDATED KITCHEN INCLUDING FLOOR AND COUNTERS, HOME AUTOMATED LIGHTING SYSTEM. FULL WHITE PICKET FENCE, GAS FIREPLACE, VAULTED CEILINGS & ALL APPLIANCES. ENJOY THE PRIVATE SETTING W/POND VIEW & HUGE SIDE YARD WITH NO NEIGHBOR NEXT DOOR. DON'T MISS OUT ON THIS WONDERFUL HOME! IT WILL NOT LAST!
-
2012-02-28$142,000 490-char remark
Show marketing remark (490 chars)
WOW! MOVE - RIGHT- INTO THIS UPDATED BRIGHT & OPEN HOME IN ONE OF FISHERS' MOST DESIRED LOCATIONS! ALL NEW: TANKLESS WATER HEATER, HEATED CERAMIC TILE FLOOR IN MASTER BATH, COMPLETELY UPDATED KITCHEN INCLUDING FLOOR AND COUNTERS, HOME AUTOMATED LIGHTING SYSTEM. FULL WHITE PICKET FENCE, GAS FIREPLACE, VAULTED CEILINGS & ALL APPLIANCES. ENJOY THE PRIVATE SETTING W/POND VIEW & HUGE SIDE YARD WITH NO NEIGHBOR NEXT DOOR. DON'T MISS OUT ON THIS WONDERFUL HOME! IT WILL NOT LAST!
-
2008-01-04soldstatus $129,900 454-char remark
Show marketing remark (454 chars)
WOW! MOVE RIGHT INTO THIS ALL UPDATED BRIGHT & AIRY HOME IN ONE OF FISHERS' MOST DESIRED LOCATIONS! ALL NEW EXT. & INT. PAINT, NEW CARPET, NEWLY INSTALLED WHITE PICKET FENCE, GAS FIREPLACE, VAULTED CEILINGS & ALL APPLIANCES. OPEN FLOOR PLAN + PRIVATE SETTING W/POND VIEW & HUGE SIDE YARD WITH NO NEIGHBOR NEXT DOOR. ENJOY THIS EASY COMMUTE, ENJOY LIVING IN A NEIGHBORHOOD W/MUCH LARGER AND EXPENSIVE HOMES. DON'T MISS! HOME WARRANTY, TOO.
-
2007-12-04$129,900 454-char remark
Show marketing remark (454 chars)
WOW! MOVE RIGHT INTO THIS ALL UPDATED BRIGHT & AIRY HOME IN ONE OF FISHERS' MOST DESIRED LOCATIONS! ALL NEW EXT. & INT. PAINT, NEW CARPET, NEWLY INSTALLED WHITE PICKET FENCE, GAS FIREPLACE, VAULTED CEILINGS & ALL APPLIANCES. OPEN FLOOR PLAN + PRIVATE SETTING W/POND VIEW & HUGE SIDE YARD WITH NO NEIGHBOR NEXT DOOR. ENJOY THIS EASY COMMUTE, ENJOY LIVING IN A NEIGHBORHOOD W/MUCH LARGER AND EXPENSIVE HOMES. DON'T MISS! HOME WARRANTY, TOO.
-
2001-04-26soldstatus $121,000
-
2001-02-06$122,900
ⓘ Source: listings_history table (triggers on properties + properties_extension) + one-shot
backfill from property_details.listing_events for pre-trigger history.
Tax reassessment forecast IN · Partial reset (capped growth)
- Current annual tax
- $2,607 · $217/mo
- Projected year-2 tax
- $2,620 · $218/mo
- Expected delta
- +$14/yr (+$1/mo · 0.5%)
ⓘ Screening estimate from a state-policy table — verify with the county assessor before closing.
Climate risk First Street
- Flood 1/10 Low FEMA zone X (unshaded) · 0% chance over 30 yrs
- Wildfire 1/10 Low
- Heat 3/10 Moderate 7 d/yr ≥101°F today · 18 d/yr by 30 yrs out
- Wind 2/10 Low 100% chance of damaging wind over 30 yrs
- Air quality 3/10 Moderate 2 unhealthy d/yr today · 3 by 30 yrs out
Nearby sold comps map
Loading sold comps map…
Walkable amenities ~0.75 mi
Loading nearby amenities…
Taxation est. · year 1
- Rental income
- $29,326
- − Mortgage interest
- −$17,359
- − Property taxes
- −$2,607
- − Insurance
- −$1,550
- − Repairs & maintenance
- −$2,346
- − Management
- −$2,346
- − HOA
- −$276
- − Depreciation
- −$9,015
- Taxable loss
- −$6,173
- Est. tax savings @ 24.0%
- +$1,481
- After-tax cash flow
- $715/yr
For passive investors: Depreciation is non-cash, so a rental often shows a tax loss while cash-flowing — sheltering income. Rental losses are passive: they offset passive income freely, and up to $25,000/yr can offset ordinary (W-2) income if you actively participate and your MAGI is under $100k (phasing out to $0 by $150k); unused losses carry forward. On sale, claimed depreciation is recaptured at up to 25%, and gains may owe capital-gains tax (a 1031 exchange can defer both). Figures are a year-1 estimate at your 24.0% rate — not tax advice; consult a CPA.
Schools (NCES district)
- District
- Hamilton Southeastern Schools
- NCES district ID
- 1810650
- Math proficiency
- 57% ▼ -11.00%
- Reading proficiency
- 59% ▼ -7.00%
- Median HH income
- $87,726
- Composite
- 53.02/100
- National rank
- #1520
- State rank
- #14 of 301 in IN
Livability — Fishers
- Score
- 83/100
- State rank
- #11
- US rank
- #898
Category grades
Schools grade is shown separately in the Schools card above.
Census & demographics
- Census place
- Fishers, IN
- County
- Hamilton County · 337,479 people
- City population
- 92,467
- Metro
- Indianapolis-Carmel-Anderson, IN
- Population (ZIP)
- 48,713
- Household income
- $141,810
- Rent vs Own
- Severe rent burden
- 738.0
Population outlook (Hamilton County) Hauer SSP2
- Today (2025)
- 381,938 people
- By 2030
- 417,496 · +9.3%
- By 2040
- 486,684 · +27.4%
- By 2050
- 549,805 · +44.0%
- By 2075
- 687,078 · +79.9%
- By 2100
- 754,495 · +97.5%
Race, ethnicity, and origin ACS 2023
- Neighborhood character
- Predominantly White (79%)
- Race & ethnicity
- White 79% Asian 10% Two or more races 5% Hispanic / Latino 3% Black 3%
- Common ancestry
- Romanian 2% Slovak 2% Iranian 1%
- Foreign-born
- 10% · Canada, China, South Korea
- Languages at home
- 87% English-only · Other Indo-European 4% Other Asian/Pacific 4% Spanish 2%
Political lean MEDSL · Hamilton
- 2024 margin
- Lean R (+6.1) · D 46.0% · R 52.1% · Other 1.9%
- 2008→2024 swing
- +16.2pp toward D · 2008: -22.2pp · 2024: -6.1pp
- All cycles
- 2024: R+6.1 2020: R+6.8 2016: R+19.6 2012: R+34.3 2008: R+22.2
Not yet ingested
- Civics
- —
Market trends
- HPI YoY
- ▼ -48.93%
- Current HPI
- 213.5424
- Rent YoY
- ▲ 6.71%
- Metro
- Indianapolis-Carmel-Anderson, IN
- State GDP YoY
- ▲ 2.90%
- F500 in state
- 18
Industry mix (Fortune 500 HQ in IN)
| Industry | F500 HQs | Revenue |
|---|---|---|
| Industrial Machinery | 2 | $37B |
|
||
| Healthcare | 1 | $177B |
|
||
| Pharmaceuticals | 1 | $45B |
|
||
| Metals / Steel | 1 | $18B |
|
||
| Agriculture | 1 | $17B |
|
||
| Packaging | 1 | $12B |
|
||
Price history
+152.2% since first listed9 events — show timeline
- 2026-03-31 Pending — MIBOR as Distributed by MLS Grid
- 2026-03-25 Listed $309,900 MIBOR as Distributed by MLS Grid
- 2012-04-30 Listing Removed — MIBOR as Distributed by MLS Grid
- 2012-04-27 Sold (MLS) $134,500 MIBOR as Distributed by MLS Grid
- 2012-02-28 Listed $142,000 MIBOR as Distributed by MLS Grid
- 2008-01-04 Sold (MLS) $129,900 MIBOR as Distributed by MLS Grid
- 2007-12-04 Listed $129,900 MIBOR as Distributed by MLS Grid
- 2001-04-26 Sold (MLS) $121,000 MIBOR as Distributed by MLS Grid
- 2001-02-06 Listed $122,900 MIBOR as Distributed by MLS Grid
Property tax history
+7.2%/yrLatest (2025): $2,607 · -9.5% YoY. Source: county tax records.
Cash-flow waterfall
monthlySold comps — $/sqft
last 12 mo · ≤1 miLoading sold comps…