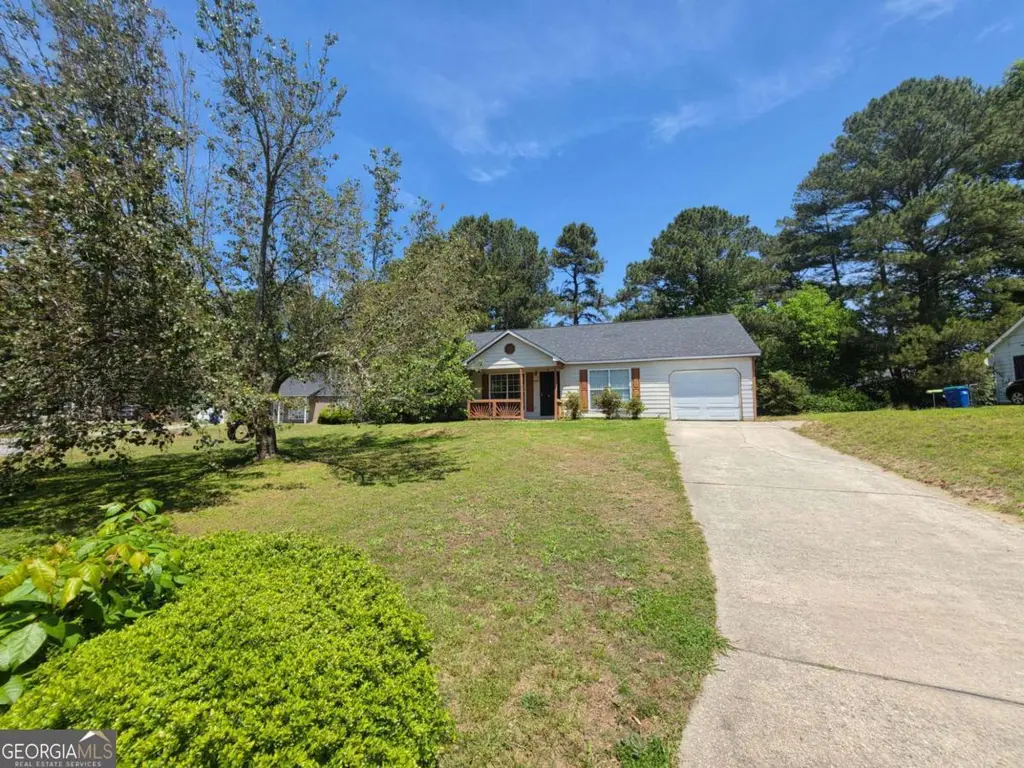
2835 Sapphire St · South Fulton, GA
Flood risk 1/10 · Minimal
- FEMA flood zone
- X (unshaded)
- Chance of flooding over 30 yrs
- 0.0%
- Est. flood insurance / yr
- $507 – $1,088
Fire risk 1/10 · Minimal
- Est. fire insurance / yr
- $963 – $1,789
Heat risk 6/10 · Moderate
- Hot days now (above 105°F)
- 7 days/yr
- Hot days in 30 yrs
- 18 days/yr
Wind risk 6/10 · Moderate
- Chance of severe wind over 30 yrs
- 27.0%
Air-quality risk 4/10 · Minor
- Unhealthy air days now
- 4 days/yr
- Unhealthy air days in 30 yrs
- 6 days/yr
Risk factors via First Street. Map © Google.
Why this score? — see what drove the C+ grade
The composite is a weighted blend of 9 inputs, each scored 0–100. Each bar is that input's sub-score; the figure is the points it added to the 100-point composite (weight × sub-score).
- Cash flow +15.6/30.0
- ARV discount +13.6/15.0
- Appreciation +10.0/10.0
- DSCR +4.8/10.0
- 1% rule +4.5/10.0
- Schools +4.5/10.0
- Rent growth +2.7/5.0
- Livability +2.5/5.0
- Condition / age +2.5/5.0
$195,000
🖨 Deal sheet (PDF) 📄 Offer letter ✓ Due diligence
Listing remarks MLS
Turnkey Investor Special: Immediate Cash Flow & High-Demand Location! Add an effortless, income-generating asset to your portfolio with 2835 Sapphire Street. This charming 3-bedroom, 2-bath ranch-style home comes with a reliable tenant already in place, meaning zero day-one vacancy and immediate ROI the moment you close. Nestled on a quiet cul-de-sac in the stable Woodward Estates community of College Park, this property offers an unbeatable, high-demand location. Situated just minutes from Hartsfield-Jackson International Airport, major highways, schools, shopping, and dining, it boasts a massive, built-in tenant pool for long-term equity growth and minimal future vacancy risk. Skip the rehab and the leasing hassle-this hands-off winner is ready to perform from Day 1
Key facts
- Quiet cul-de-sac
- 0.32 acre lot
- Garage
Tags
Property features AI
Exterior
- Parking: One-car garage; Four total parking spaces; Garage faces the front
- Utilities: Public water; Public sewer; Electric service (110V; 220V in laundry); Cable available; Phone available; Underground utilities
- Home design: One-level home; Resale property
- Construction: Vinyl siding; Composition shingle roof; Slab foundation; Built as described in deed records
- Exterior features: Patio; Paved road frontage on a county road; Near public transportation; Near shopping
Interior
- Kitchen: White cabinetry; Dishwasher; Electric range; Microwave; Refrigerator
- Bedrooms: Three main-level bedrooms; Primary bedroom on the main level
- Flooring: Carpet; Other flooring
- Bathrooms: Two full bathrooms (both on the main level); Primary bathroom: other features
- Heating & cooling: Central heating (electric); Central air conditioning; Ceiling fans
- Interior features: Other interior features; No shared/common walls
- Laundry & utility: Main-level laundry (220V in laundry)
Neighborhood map
What this means for you Summary
Snapshot
- This is a 3-bed/2.0-bath single-family listed at $195k.
Deal economics
- At list price, monthly cash flow is $81 ($971/yr) — positive.
- The deal already cash-flows at list — no discount required.
- To meet the 1% rule (rent ≥ 1% of price), the offer needs to be $185k (5.0% below list).
- Recommended offer: $185k (5.0% below list) — sets the bar for 1% rule.
Location & tenants
- Location reads: area grade C — affects rentability + tenant quality, not the cash-flow math above.
- Fulton County (suburban): math 49% / reading 53% proficiency, ranked #12 of 174 in GA (top 7%) — acceptable for families but not a draw, mixed tenant base, ~2y average lease.
- Zoned schools: Nolan Elementary School (math 24% / reading 22%, grade F, #796 of 1,228 statewide, top 65%, 710 students, 100% FRL); Banneker High School (math 24% / reading 75%, grade D+, #28 of 424 statewide, top 7%, 1,610 students, 100% FRL) — zoned schools average 100% FRL vs 41% district-wide (59 pts higher); higher-poverty schools than district average — tighter screening recommended.
- Zoned-school proficiency averages 36% at this address vs 51% district-wide (-14 pts) — the specific schools serving this property underperform the Fulton County average; the district grade overstates school quality for this exact location.
- Market conditions: Rents flat; 656 active listings in the ZIP; 40 comparable units currently listed for rent nearby; rentals at typical pace (median 26d on market — plan ~3-4 weeks tenant-placement turnaround); 11,565 units permitted in Fulton County in 2024 (8,159 in 5+ unit buildings).
Forward outlook
- In year one you build about $21k of equity ($1k loan paydown + $20k appreciation (10.0% local appreciation)).
- Fulton County population projected at +38% by 2050 — long-run rental-demand tailwind backs the buy-and-hold thesis.
- At projected returns (10.0% appreciation + 0.9% rent growth), your $55k cash investment doubles in ~3 years — after that, you're playing with house money.
- By year 2, paydown + projected appreciation supports a ~$34k cash-out refi (75% LTV) — recoverable capital for the next deal without selling this one.
Negotiation context
- It's been on market 19 days — a 2% lower offer ($192k) is reasonable based on typical stale-listing flexibility.
- 4 sale attempts since 8y ago with the ask held roughly flat each time — persistent listings suggest the price (not the market) is what's stuck; bring a comps-based counter.
- Current owner paid $130k; list at $195k implies a 51% gain — meaningful room to come down on a strong offer.
Risks & watch-outs
- Climate carrying-cost: major wind risk, 27% chance of damaging wind over 30y; extreme-heat days projected 7→18/yr by 2055 (HVAC capex compounding) — expect insurance premiums to compound above CPI over the hold.
Questions for the listing agent
- Is there a deadline driving the sale (1031 exchange, divorce, estate, relocation)? That informs how much negotiation room exists.
- What's the average days-on-market for RENTAL listings here right now (not sales)? A rising rental-DOM trend means longer vacancies and softer asking-rent achievability than the comps imply.
- What's the recent tenant-quality profile in this submarket — average credit score on applications, eviction rate, late-payment / NSF rate, and stable-employment percentage? A property-management company in the area should have these aggregated.
- How much new for-sale + rental construction is in the pipeline within 1–3 miles? Heavy new supply typically softens prices + rents 12–24 months out; constrained supply supports both.
Investment metrics
- 1% rule
- 0.95% ✗
- Cap rate
- 6.79%
- Cash-on-cash
- 1.78%
- DSCR
- 1.08
- GRM
- 8.8
CMA / ARV
- ARV (on-the-fly)
- $225,600
- Comps found
- 12
Show comp detail 12 sales within ~0.75 mi
| Address | Dist | Beds/Ba | Sqft | Sold | Price | $/sf | Match |
|---|---|---|---|---|---|---|---|
| 910 Winterside Ln | 0.08mi | 3/2.0 | 1,335 (-5%) | 15mo | $118,000 | $88 | 74 |
| 2985 Garnet Way | 0.29mi | 3/2.0 | 1,464 (+4%) | 11mo | $206,000 | $141 | 71 |
| 1005 Winter Side Ln | 0.14mi | 3/2.5 | 1,272 (-10%) | 7mo | $208,000 | $164 | 70 |
| 835 Old Rocky Rd | 0.45mi | 3/2.0 | 1,410 (0%) | 13mo | $200,000 | $142 | 68 |
| 6520 Emerald Pointe Cir | 0.41mi | 3/2.0 | 1,328 (-6%) | 10mo | $213,000 | $160 | 62 |
| 6255 Topaz Trl | 0.54mi | 3/2.5 | 1,486 (+5%) | 9mo | $234,700 | $158 | 57 |
| 2950 Harper Valley Dr | 0.57mi | 3/2.0 | 1,367 (-3%) | 20mo | $155,000 | $113 | 52 |
| 290 Gemstone Pl | 0.40mi | 3/2.0 | 1,304 (-8%) | 23mo | $265,000 | $203 | 50 |
| 805 Old Rocky Rd | 0.49mi | 4/3.0 (+1) | 1,500 (+6%) | 10mo | $250,000 | $167 | 49 |
| 245 Adena Ln W | 0.66mi | 4/2.0 (+1) | 1,348 (-4%) | 13mo | $230,000 | $171 | 46 |
| 935 Old Rocky Rd | 0.33mi | 4/3.0 (+1) | 1,500 (+6%) | 22mo | $235,900 | $157 | 46 |
| 3045 Flat Shoals Rd | 0.53mi | 2/2.0 (-1) | 1,200 (-15%) | 13mo | $215,000 | $179 | 35 |
Match score weights: distance 35% · size 25% · config 20% · recency 20%. Top-matched comps best support the ARV.
Projected returns pro-forma
10.0% appreciation · 0.95% rent growth · sell at horizon
- IRR
- 24.8%
- Equity multiple
- 2.97×
- Total profit
- $107,660
- Equity at exit
- $175,671
- IRR
- 21.4%
- Equity multiple
- 6.61×
- Total profit
- $306,104
- Equity at exit
- $378,842
Cash invested: $54,600 (down + closing). Projections, not guarantees.
Landlord ↔ Tenant lean methodology
- Overall (STATE)
- 90 Strongly Landlord-Friendly
- State Georgia
- 90 Strongly Landlord-Friendly · R+3
- County
- — inherits STATE
- City
- — inherits STATE
ZIP-level market 30349
- Home prices YoY
- 4.6%
- Rents YoY
- 0.9%
- Active inventory
- 656
- Price-to-rent
- 8.8×
Monthly cashflow live
- Estimated rent
- $1,853 high interval (Pro) →
- Mortgage (P&I)
- −$1,023
- Tax from tax record
- −$279 /mo · $3,353/yr
- Insurance
- −$81
- HOA
- −$0
- Vacancy / Maint / Mgmt
- −$389
- Net cashflow
- $81
Break-even live
Sensitivity live
| Price | -10% $191 | -5% $136 | +0% $81 | +5% $26 | +10% $-29 |
|---|---|---|---|---|---|
| Rent | -10% $-65 | -5% $8 | +0% $81 | +5% $154 | +10% $227 |
| Rate | -1.0pp $179 | -0.5pp $131 | base $81 | +0.5pp $30 | +1.0pp $-21 |
UW: 25.0% down · 7.5% · 30yr · 1.5% tax · 5.0% vac · 8.0% maint · 8.0% mgmt
Financing live
Cash to close
- Down payment
- $48,750
- Closing costs
- $5,850
- Reserves months
- —
- Total cash needed
- —
Loan-product check · same deal, 3 products live
Conventional
25% down · 7.5% · 30yr
- Down + closing
- —
- Monthly P&I
- —
- Monthly cashflow
- —
- DSCR
- —
- Eligible?
- —
Personal DTI + credit; lowest rate.
DSCR
20% down · 8.5% · 30yr
- Down + closing
- —
- Monthly P&I
- —
- Monthly cashflow
- —
- DSCR
- —
- Eligible?
- —
No personal income docs; deal must DSCR.
Hard money
10% down · 12.0% · 12mo
- Down + closing
- —
- Monthly P&I
- —
- Monthly cashflow
- —
- DSCR
- —
- Eligible?
- —
Short-term bridge; refi at stabilization.
Rent comps 40 comps
| Address | Beds | Baths | Sqft | Rent | $/sqft | DOM | Units | Dist |
|---|---|---|---|---|---|---|---|---|
| 6450 Peppermill Ln Atlanta, GA | 4.0 | 2.0 | 1188 | $1,531 | $1.29 | 25d | 1 | 0.07mi |
| 3105 Garnet Way Atlanta, GA | 3.0 | 2.0 | 1470 | $1,660 | $1.13 | 14d | 1 | 0.20mi |
| 6345 Peppermill Ln Atlanta, GA | 3.0 | 2.5 | 1224 | $1,800 | $1.47 | 44d | 1 | 0.25mi |
| 2820 Greenbower Ct Atlanta, GA | 3.0 | 2.0 | 1338 | $1,730 | $1.29 | 5d | 1 | 0.32mi |
| 855 Old Rocky Rd Atlanta, GA | 3.0 | 2.0 | 1310 | $1,710 | $1.31 | 25d | 1 | 0.45mi |
| 2667 Rocky Ct Atlanta, GA | 3.0 | 2.5 | 1432 | $2,200 | $1.54 | 44d | 1 | 0.47mi |
| 6560 Emerald Pointe Cir Atlanta, GA | 3.0 | 2.0 | 1309 | $1,500 | $1.15 | 23d | 1 | 0.49mi |
| 2592 Rocky Ct Atlanta, GA | 2.0 | 2.5 | 1424 | $2,000 | $1.40 | 44d | 1 | 0.51mi |
| 6278 Rockaway Rd Atlanta, GA | 3.0 | 2.5 | 1524 | $2,000 | $1.31 | 44d | 1 | 0.61mi |
| 6090 Emerald Pointe Cir Atlanta, GA | 3.0 | 2.0 | 1200 | $1,875 | $1.56 | 19d | 1 | 0.65mi |
| 320 Emerald Green Ct Atlanta, GA | 3.0 | 2.0 | 1575 | $2,050 | $1.30 | 44d | 1 | 0.69mi |
| 6120 Hemperly Rd Atlanta, GA | 4.0 | 2.5 | 1770 | $2,100 | $1.19 | 25d | 1 | 0.74mi |
| 6120 Hemperly Rd Atlanta, GA | 4.0 | 2.5 | 1770 | $2,100 | $1.19 | 5d | 1 | 0.74mi |
| 3240 Devilla Trce South Fulton, GA | 4.0 | 2.0 | 1616 | $1,980 | $1.23 | 44d | 1 | 0.80mi |
| 3206 Pine Tree Trl Unit 15C Atlanta, GA | 3.0 | 2.5 | 1466 | $1,950 | $1.33 | 5d | 1 | 0.81mi |
| 6575 Smoke Ridge Dr Atlanta, GA | 4.0 | 2.0 | 1808 | $1,815 | $1.00 | 44d | 1 | 0.84mi |
| 2184 Olmadison Vw Atlanta, GA | 2.0 | 2.0 | 1236 | $1,985 | $1.61 | 19d | 1 | 0.86mi |
| 2865 Spruce Point Rd Atlanta, GA | 4.0 | 2.0 | 1050 | $1,910 | $1.82 | 44d | 1 | 0.86mi |
| 3500 Keels Ln Atlanta, GA | 3.0 | 2.0 | 1272 | $1,755 | $1.38 | 3d | 1 | 0.86mi |
| 6230 Cedar Wood Dr Atlanta, GA | 3.0 | 2.0 | 1238 | $1,694 | $1.37 | 44d | 1 | 0.87mi |
| 6415 El Caudillo Ct Atlanta, GA | 3.0 | 3.0 | 1498 | $2,800 | $1.87 | 5d | 1 | 0.87mi |
| 6368 Olmadison Pl Atlanta, GA | 3.0 | 2.5 | 1428 | $1,596 | $1.12 | 0d | 1 | 0.89mi |
| 6370 Olmadison Pl Atlanta, GA | 3.0 | 2.5 | 1440 | $1,795 | $1.25 | 44d | 1 | 0.89mi |
| 2550 Hallie Mill Rd Atlanta, GA | 3.0 | 2.0 | 1372 | $1,600 | $1.17 | 14d | 1 | 0.89mi |
| 7060 Kimberly Mill Rd Atlanta, GA | 3.0 | 1.0 | 1056 | $1,425 | $1.35 | 6d | 1 | 0.89mi |
| 7060 Kimberly Mill Rd Atlanta, GA | 3.0 | 1.0 | 1056 | $1,425 | $1.35 | 0d | 1 | 0.89mi |
| 6056 Carriage Ct Atlanta, GA | 3.0 | 2.0 | 1400 | $1,549 | $1.11 | 0d | 1 | 0.91mi |
| 2373 Bigwood Trl Atlanta, GA | 3.0 | 2.5 | 1566 | $1,845 | $1.18 | 25d | 1 | 0.92mi |
| 2560 Foxlair Trl Atlanta, GA | 4.0 | 2.0 | 1485 | $1,795 | $1.21 | 25d | 1 | 0.94mi |
| 2285 Bigwood Trl Atlanta, GA | 3.0 | 2.5 | 1580 | $1,740 | $1.10 | 3d | 1 | 0.94mi |
| 2310 Bigwood Trl Atlanta, GA | 3.0 | 2.5 | 1580 | $2,600 | $1.65 | 25d | 1 | 0.99mi |
| 7045 Birling Dr Atlanta, GA | 4.0 | 3.0 | 1488 | $1,765 | $1.19 | 44d | 1 | 0.99mi |
| 325 Pointer Ct Atlanta, GA | 3.0 | 2.0 | 1474 | $1,620 | $1.10 | 6d | 1 | 1.00mi |
| 6078 Oak Bend Ct Riverdale, GA | 3.0 | 2.5 | 1622 | $1,800 | $1.11 | 25d | 1 | 1.02mi |
| 2555 Flat Shoals Rd #401 Atlanta, GA | 3.0 | 2.5 | 1550 | $2,050 | $1.32 | 44d | 1 | 1.02mi |
| 2555 Flat Shoals Rd #404 College Park, GA | 3.0 | 2.5 | 1408 | $1,700 | $1.21 | 25d | 1 | 1.03mi |
| 110 Fruitwood Trce Unit A Riverdale, GA | 3.0 | 2.0 | 1100 | $1,800 | $1.64 | 21d | 1 | 1.04mi |
| 6440 Connell Rd Atlanta, GA | 3.0 | 2.0 | 1391 | $1,695 | $1.22 | 25d | 1 | 1.05mi |
| 6048 Oak Bend Ct Riverdale, GA | 3.0 | 2.5 | 1500 | $1,750 | $1.17 | 0d | 1 | 1.06mi |
| 6048 Oak Bend Ct Riverdale, GA | 3.0 | 2.5 | 1500 | $1,750 | $1.17 | 23d | 1 | 1.06mi |
Listing history 12 events
-
2026-06-21days on market $195,000 Active 19 DOM
-
2026-06-18days on market $195,000 Active 16 DOM
-
2026-06-17days on market $195,000 Active 15 DOM
-
2026-06-16days on market $195,000 Active 14 DOM
-
2026-06-15days on market $195,000 Active 13 DOM
-
2026-06-13days on market $195,000 Active 11 DOM
-
2026-06-09days on market $195,000 Active 7 DOM
-
2026-06-08days on market $195,000 Active 6 DOM
-
2026-06-07days on market $195,000 Active 5 DOM
-
2026-06-04days on market $195,000 Active 2 DOM
-
2026-06-03remarks 695-char remark
-
2026-06-03$195,000 Active 1 DOM
ⓘ Source: listings_history table (triggers on properties + properties_extension) + one-shot
backfill from property_details.listing_events for pre-trigger history.
Tax reassessment forecast GA · Resets to sale price
- Current annual tax
- $3,353 · $279/mo
- Projected year-2 tax
- $3,353 · $279/mo
- Expected delta
- $0/yr ($0/mo · 0.0%)
ⓘ Screening estimate from a state-policy table — verify with the county assessor before closing.
Climate risk First Street
- Flood 1/10 Low FEMA zone X (unshaded) · 0% chance over 30 yrs
- Wildfire 1/10 Low
- Heat 6/10 Major 7 d/yr ≥105°F today · 18 d/yr by 30 yrs out
- Wind 6/10 Major 27% chance of damaging wind over 30 yrs
- Air quality 4/10 Moderate 4 unhealthy d/yr today · 6 by 30 yrs out
Nearby sold comps map
Loading sold comps map…
Walkable amenities ~0.75 mi
Loading nearby amenities…
Taxation est. · year 1
- Rental income
- $22,240
- − Mortgage interest
- −$10,923
- − Property taxes
- −$3,353
- − Insurance
- −$975
- − Repairs & maintenance
- −$1,779
- − Management
- −$1,779
- − Depreciation
- −$5,673
- Taxable loss
- −$2,241
- Est. tax savings @ 24.0%
- +$538
- After-tax cash flow
- $1,509/yr
For passive investors: Depreciation is non-cash, so a rental often shows a tax loss while cash-flowing — sheltering income. Rental losses are passive: they offset passive income freely, and up to $25,000/yr can offset ordinary (W-2) income if you actively participate and your MAGI is under $100k (phasing out to $0 by $150k); unused losses carry forward. On sale, claimed depreciation is recaptured at up to 25%, and gains may owe capital-gains tax (a 1031 exchange can defer both). Figures are a year-1 estimate at your 24.0% rate — not tax advice; consult a CPA.
Schools (NCES district)
- District
- Fulton County
- NCES district ID
- 1302280
- Math proficiency
- 49% ▼ -2.00%
- Reading proficiency
- 53% ▬ 0.00%
- Median HH income
- $68,035
- Composite
- 45.33/100
- National rank
- #2640
- State rank
- #12 of 174 in GA
Livability — South Fulton
No livability data for this city. (Only ~50 U.S. cities are tracked.)
Census & demographics
- Census place
- South Fulton, GA
- County
- Fulton County · 1,094,430 people
- City population
- 127,674
- Metro
- Atlanta-Sandy Springs-Alpharetta, GA
- Population (ZIP)
- 79,872
- Household income
- $67,023
- Rent vs Own
- Severe rent burden
- 4258.0
Population outlook (Fulton County) Hauer SSP2
- Today (2025)
- 1,203,707 people
- By 2030
- 1,299,706 · +8.0%
- By 2040
- 1,488,256 · +23.6%
- By 2050
- 1,664,580 · +38.3%
- By 2075
- 2,036,072 · +69.2%
- By 2100
- 2,222,402 · +84.6%
Race, ethnicity, and origin ACS 2023
- Neighborhood character
- Predominantly Black (89%)
- Race & ethnicity
- Black 89% Hispanic / Latino 5% Two or more races 4% White 3%
- Foreign-born
- 9% · Canada
- Languages at home
- 88% English-only · Spanish 6% French/Haitian/Cajun 1%
Political lean MEDSL · Fulton
- 2024 margin
- Solid D (+44.9) · D 71.9% · R 27.0% · Other 1.1%
- 2008→2024 swing
- +9.8pp toward D · 2008: 35.0pp · 2024: 44.9pp
- All cycles
- 2024: D+44.9 2020: D+46.4 2016: D+42.1 2012: D+29.6 2008: D+35.0
Not yet ingested
- Civics
- —
Market trends
- HPI YoY
- ▲ 18.01%
- Current HPI
- 407.99
- Rent YoY
- ▲ 0.95%
- Metro
- Atlanta-Sandy Springs-Alpharetta, GA
- State GDP YoY
- ▲ 2.66%
- F500 in state
- 28
Industry mix (Fortune 500 HQ in GA)
| Industry | F500 HQs | Revenue |
|---|---|---|
| Paper / Packaging | 2 | $29B |
|
||
| Retail | 1 | $160B |
|
||
| Transportation / Logistics | 1 | $91B |
|
||
| Airlines | 1 | $62B |
|
||
| Consumer Goods | 1 | $47B |
|
||
| Utilities | 1 | $25B |
|
||
Price history
+178.6% since first listed11 events — show timeline
- 2026-06-02 Listed $195,000 GAMLS
- 2026-06-02 Listed $195,000 FMLS
- 2026-03-31 Listing Removed — GAMLS
- 2025-08-05 Listed $215,000 GAMLS
- 2018-12-11 Sold (Public Records) $129,500 Public Records
- 2018-11-30 Sold (MLS) $129,500 FMLS
- 2018-11-02 Pending — FMLS
- 2018-10-23 Listed $129,500 FMLS
- 2006-03-13 Sold (Public Records) $99,000 Public Records
- 2003-10-30 Sold (Public Records) $116,000 Public Records
- 1996-01-25 Sold (Public Records) $70,000 Public Records
Property tax history
+5.2%/yrLatest (2025): $3,353 · -7.1% YoY. Source: county tax records.
Cash-flow waterfall
monthlySold comps — $/sqft
last 12 mo · ≤1 miLoading sold comps…