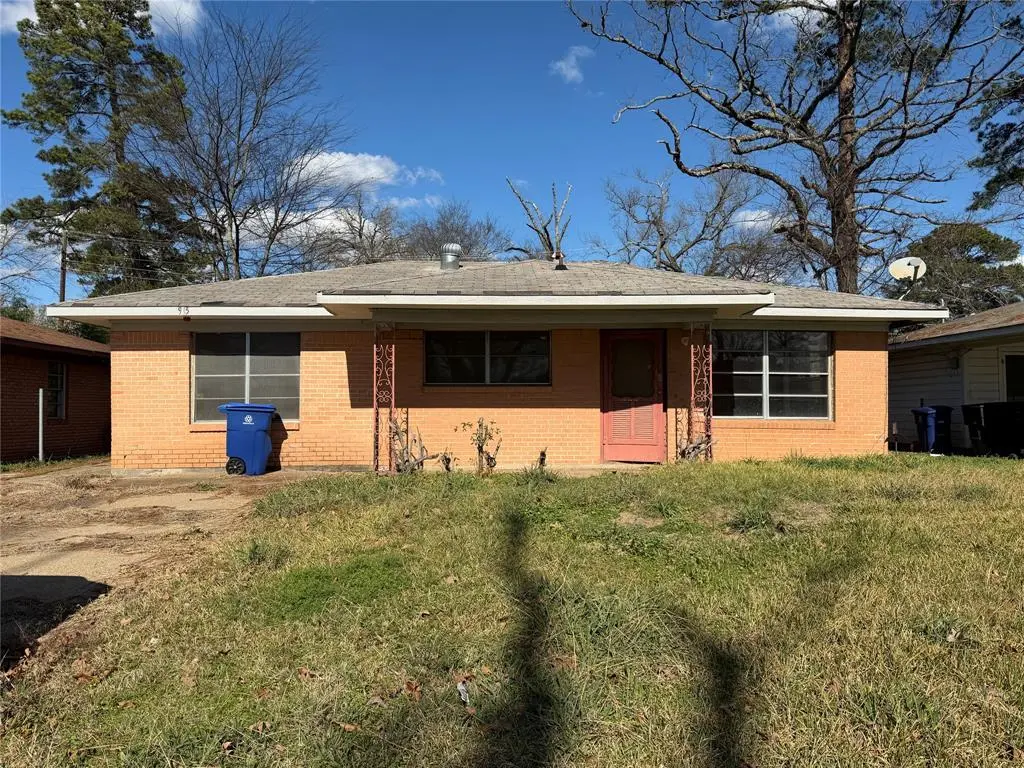
915 Pine Tree Dr · Shreveport, LA
Flood risk 1/10 · Minimal
- FEMA flood zone
- X (unshaded)
- Chance of flooding over 30 yrs
- 0.0%
- Est. flood insurance / yr
- $507 – $1,088
Fire risk 1/10 · Minimal
- Est. fire insurance / yr
- $1,269 – $2,357
Heat risk 7/10 · Major
- Hot days now (above 110°F)
- 7 days/yr
- Hot days in 30 yrs
- 22 days/yr
Wind risk 6/10 · Moderate
- Chance of severe wind over 30 yrs
- 69.0%
Air-quality risk 2/10 · Minimal
- Unhealthy air days now
- 1 days/yr
- Unhealthy air days in 30 yrs
- 1 days/yr
Risk factors via First Street. Map © Google.
Why this score? — see what drove the B+ grade
The composite is a weighted blend of 9 inputs, each scored 0–100. Each bar is that input's sub-score; the figure is the points it added to the 100-point composite (weight × sub-score).
- Cash flow +30.0/30.0
- ARV discount +15.0/15.0
- 1% rule +10.0/10.0
- DSCR +10.0/10.0
- Rent growth +4.4/5.0
- Livability +3.0/5.0
- Condition / age +2.5/5.0
- Schools +2.2/10.0
- Appreciation +0.0/10.0
$42,000
🖨 Deal sheet 📄 Offer letter ✓ Due diligence
Listing remarks MLS
Looking for a project with promise? This 3-bedroom, 1.5-bath home on Pine Tree Dr offers a great opportunity to create something special. Ready for updates and personal touches, this handy person special is perfect for buyers who see potential and aren’t afraid of a little work. Bring your vision and transform this house into a home. Sold as-is.
Key facts
- 6,882 sq ft lot
- Built 1960
- Listed 6 days
Neighborhood map
What this means for you Summary
Snapshot
- This is a 3-bed/1.5-bath single-family listed at $42k.
Deal economics
- At list price, monthly cash flow is $542 ($6k/yr) — positive.
- The deal already cash-flows at list — no discount required.
- Meets the 1% rule at list price ($1k rent vs $42k).
- Cap rate 21.8% vs local median 5.7% in Shreveport — top-decile yield for the area; either an underpriced asset or a hidden risk that comps aren't pricing in. Stress-test before assuming the spread holds.
Location & tenants
- Location reads 59/100 on livability (#270 in LA) — a working-class tenant base; expect higher turnover. Strengths: cost of living A+, housing A; Watch: schools D+, crime F, amenities F.
- Caddo Parish (urban): math 21% / reading 32% proficiency, ranked #53 of 98 in LA (top 54%) — low school quality limits family demand, transient renter base, plan for 1-2y turnover; 64% free/reduced lunch — lower-income household profile, screen leases tightly.
- Market conditions: Rents rising fast (+7.5%/yr); 485 active listings in the ZIP; 13 comparable units currently listed for rent nearby; rentals lingering (median 44d on market — plan ~5-8 weeks vacancy on turnover, expect pricing pressure); 54% of comp listings sitting > 30 days — soft ceiling on asking rent; solid renter incomes; 221 units permitted in Caddo Parish in 2024 (0 in 5+ unit buildings).
- This rent is only 16% of the median local income ($81k/yr) — well below the 30% rent-burden line; pricing power to push rent on renewal without tenant pushback.
Forward outlook
- Local home prices are declining (-3.0%/yr); year-one equity from $290 of loan paydown is wiped out by about $1k of value loss. Plan a longer hold.
- Caddo County population projected at -15% by 2050 — secular population decline; favor cash flow + early exit over multi-decade hold.
- At projected returns (-3.0% appreciation + 7.5% rent growth), your $12k cash investment doubles in ~2 years — after that, you're playing with house money.
Negotiation context
- Only 6 days on market — expect competitive offers; lowballing is unlikely to land.
- 2 sale attempts; this cycle's ask has dropped $8k (16%) from the opening price — seller is motivated, your offer sets the floor, not the list.
Risks & watch-outs
- Climate carrying-cost: major wind risk, 69% chance of damaging wind over 30y; extreme-heat days projected 7→22/yr by 2055 (HVAC capex compounding) — expect insurance premiums to compound above CPI over the hold.
Questions for the listing agent
- Built in 1960 — when were the roof, HVAC, electrical panel, plumbing, and water heater last replaced?
- Is there a deadline driving the sale (1031 exchange, divorce, estate, relocation)? That informs how much negotiation room exists.
- Schools are D-rated, which usually means shorter tenancies and higher turnover. Who's the typical renter profile here, and what's been the actual vacancy rate?
- Crime grade is F in this area — have there been break-ins, vandalism, or insurance claims at this property in the last 3 years? What carrier currently insures it and at what premium?
- What's the average days-on-market for RENTAL listings here right now (not sales)? A rising rental-DOM trend means longer vacancies and softer asking-rent achievability than the comps imply.
- What's the recent tenant-quality profile in this submarket — average credit score on applications, eviction rate, late-payment / NSF rate, and stable-employment percentage? A property-management company in the area should have these aggregated.
- How much new for-sale + rental construction is in the pipeline within 1–3 miles? Heavy new supply typically softens prices + rents 12–24 months out; constrained supply supports both.
Investment metrics
- 1% rule
- 2.59% ✓
- Cap rate
- 21.77%
- Cash-on-cash
- 55.27%
- DSCR
- 3.46
- GRM
- 3.2
CMA / ARV
- ARV (median comp)
- $64,715
- List price
- $42,000
- Delta
- -28.92%
- Verdict
- UNDERPRICED
- Comps
- 20 within 1.0 mi
Show comp detail 6 sales within ~0.75 mi
| Address | Dist | Beds/Ba | Sqft | Sold | Price | $/sf | Match |
|---|---|---|---|---|---|---|---|
| 931 Pine Tree Dr | 0.04mi | 2/1.0 (-1) | 1,606 (-6%) | 22mo | $75,000 | $47 | 63 |
| 502 W 76th St | 0.55mi | 3/2.0 | 1,694 (-1%) | 12mo | $25,000 | $15 | 61 |
| 1029 Huntington Ln | 0.23mi | 2/1.0 (-1) | 1,452 (-15%) | 9mo | $45,000 | $31 | 50 |
| 7910 Woodfield Dr | 0.44mi | 3/2.0 | 1,470 (-14%) | 11mo | $115,000 | $78 | 45 |
| 7101 Brandtway St | 0.70mi | 3/1.5 | 1,592 (-7%) | 14mo | $55,000 | $35 | 44 |
| 3005 Valley View Dr | 0.70mi | 3/1.0 | 1,454 (-15%) | 13mo | $123,700 | $85 | 29 |
Match score weights: distance 35% · size 25% · config 20% · recency 20%. Top-matched comps best support the ARV.
Projected returns pro-forma
-3.0% appreciation · 7.51% rent growth · sell at horizon
- IRR
- 58.8%
- Equity multiple
- 3.80×
- Total profit
- $32,877
- Equity at exit
- $6,262
- IRR
- 65.2%
- Equity multiple
- 9.20×
- Total profit
- $96,399
- Equity at exit
- $3,631
Cash invested: $11,760 (down + closing). Projections, not guarantees.
Landlord ↔ Tenant lean methodology
- Overall (STATE)
- 90 Strongly Landlord-Friendly
- State Louisiana
- 90 Strongly Landlord-Friendly · R+12
- County
- — inherits STATE
- City
- — inherits STATE
ZIP-level market 71106
- Rents YoY
- 7.5%
- Active inventory
- 485
- Price-to-rent
- 3.2×
Monthly cashflow live
- Estimated rent
- $1,087 high interval (Pro) →
- Mortgage (P&I)
- −$220
- Tax from tax record
- −$79 /mo · $948/yr
- Insurance
- −$18
- HOA
- −$0
- Vacancy / Maint / Mgmt
- −$228
- Net cashflow
- $542
Break-even live
UW: 25.0% down · 7.5% · 30yr · 1.5% tax · 5.0% vac · 8.0% maint · 8.0% mgmt
Financing live
Cash to close
- Down payment
- $10,500
- Closing costs
- $1,260
- Reserves months
- —
- Total cash needed
- —
Loan-product check · same deal, 3 products live
Conventional
25% down · 7.5% · 30yr
- Down + closing
- —
- Monthly P&I
- —
- Monthly cashflow
- —
- DSCR
- —
- Eligible?
- —
Personal DTI + credit; lowest rate.
DSCR
20% down · 8.5% · 30yr
- Down + closing
- —
- Monthly P&I
- —
- Monthly cashflow
- —
- DSCR
- —
- Eligible?
- —
No personal income docs; deal must DSCR.
Hard money
10% down · 12.0% · 12mo
- Down + closing
- —
- Monthly P&I
- —
- Monthly cashflow
- —
- DSCR
- —
- Eligible?
- —
Short-term bridge; refi at stabilization.
Rent comps 13 comps
| Address | Beds | Baths | Sqft | Rent | $/sqft | DOM | Units | Dist |
|---|---|---|---|---|---|---|---|---|
| 7137 Burlingame Blvd Shreveport, LA | 3.0 | 1.5 | 1100 | $700 | $0.64 | 43d | 1 | 0.16mi |
| 702 Bringhurst Dr Shreveport, LA | 3.0 | 1.5 | 1206 | $1,100 | $0.91 | 43d | 1 | 0.33mi |
| 638 Bringhurst Dr Shreveport, LA | 3.0 | 1.5 | 1704 | $1,200 | $0.70 | 21d | 1 | 0.35mi |
| 749 W 68th St Shreveport, LA | 3.0 | 1.0 | 1232 | $800 | $0.65 | 43d | 1 | 0.41mi |
| 7913 Woodfield Dr Shreveport, LA | 3.0 | 1.0 | 1067 | $1,000 | $0.94 | 43d | 1 | 0.43mi |
| 7504 W Canal Blvd Shreveport, LA | 3.0 | 1.0 | 1388 | $1,150 | $0.83 | 43d | 1 | 0.71mi |
| 2762 Marquette St Shreveport, LA | 3.0 | 1.0 | 1054 | $1,000 | $0.95 | 21d | 1 | 0.76mi |
| 629 Woodmont Pl Shreveport, LA | 3.0 | 1.0 | 1431 | $1,295 | $0.90 | 44d | 1 | 0.78mi |
| 629 David Dr Shreveport, LA | 3.0 | 1.5 | 1064 | $1,100 | $1.03 | 21d | 1 | 0.87mi |
| 570 Sally Ann Dr Shreveport, LA | 3.0 | 1.0 | 1082 | $825 | $0.76 | 13d | 1 | 0.93mi |
| 3306 Valley View Dr Shreveport, LA | 3.0 | 1.0 | 1300 | $1,150 | $0.88 | 21d | 1 | 1.00mi |
| 8902 Coyth Ln Shreveport, LA | 3.0 | 2.0 | 1082 | $1,200 | $1.11 | 43d | 1 | 1.13mi |
| 3437 Red Bud Ln Shreveport, LA | 3.0 | 1.5 | 1393 | $1,200 | $0.86 | 21d | 1 | 1.19mi |
Listing history 16 events
-
2026-06-18days on market $42,000 Active 6 DOM
-
2026-06-17days on market $42,000 Active 5 DOM
-
2026-06-16days on market $42,000 Active 4 DOM
-
2026-06-15days on market $42,000 Active 3 DOM
-
2026-06-13pricedays on market $42,000 Active 1 DOM
-
2026-06-05days on market $46,000 Active 152 DOM
-
2026-06-03days on market $46,000 Active 151 DOM
-
2026-06-02days on market $46,000 Active 150 DOM
-
2026-06-01days on market $46,000 Active 149 DOM
-
2026-05-31days on market $46,000 Active 148 DOM
-
2026-05-30days on market $46,000 Active 147 DOM
-
2026-03-07price $46,000 353-char remark
Show marketing remark (353 chars)
Looking for a project with promise? This 3-bedroom, 1.5-bath home on Pine Tree Dr offers a great opportunity to create something special. Ready for updates and personal touches, this handy person special is perfect for buyers who see potential and aren’t afraid of a little work. Bring your vision and transform this house into a home. Sold as-is.
-
2026-02-04status Active 353-char remark
Show marketing remark (353 chars)
Looking for a project with promise? This 3-bedroom, 1.5-bath home on Pine Tree Dr offers a great opportunity to create something special. Ready for updates and personal touches, this handy person special is perfect for buyers who see potential and aren’t afraid of a little work. Bring your vision and transform this house into a home. Sold as-is.
-
2026-01-28status Pending 353-char remark
Show marketing remark (353 chars)
Looking for a project with promise? This 3-bedroom, 1.5-bath home on Pine Tree Dr offers a great opportunity to create something special. Ready for updates and personal touches, this handy person special is perfect for buyers who see potential and aren’t afraid of a little work. Bring your vision and transform this house into a home. Sold as-is.
-
2025-12-27$49,900 Active 353-char remark
Show marketing remark (353 chars)
Looking for a project with promise? This 3-bedroom, 1.5-bath home on Pine Tree Dr offers a great opportunity to create something special. Ready for updates and personal touches, this handy person special is perfect for buyers who see potential and aren’t afraid of a little work. Bring your vision and transform this house into a home. Sold as-is.
-
1979-01-05soldstatus
ⓘ Source: listings_history table (triggers on properties + properties_extension) + one-shot
backfill from property_details.listing_events for pre-trigger history.
Tax reassessment forecast LA · Resets to sale price
- Current annual tax
- $948 · $79/mo
- Projected year-2 tax
- $948 · $79/mo
- Expected delta
- $0/yr ($0/mo · 0.0%)
ⓘ Screening estimate from a state-policy table — verify with the county assessor before closing.
Climate risk First Street
- Flood 1/10 Low FEMA zone X (unshaded) · 0% chance over 30 yrs
- Wildfire 1/10 Low
- Heat 7/10 Severe 7 d/yr ≥110°F today · 22 d/yr by 30 yrs out
- Wind 6/10 Major 69% chance of damaging wind over 30 yrs
- Air quality 2/10 Low 1 unhealthy d/yr today · 1 by 30 yrs out
Nearby sold comps map
Loading sold comps map…
Walkable amenities ~0.75 mi
Loading nearby amenities…
Taxation est. · year 1
- Rental income
- $13,038
- − Mortgage interest
- −$2,353
- − Property taxes
- −$948
- − Insurance
- −$210
- − Repairs & maintenance
- −$1,043
- − Management
- −$1,043
- − Depreciation
- −$1,222
- Taxable income
- $6,220
- Est. tax owed @ 24.0%
- −$1,493
- After-tax cash flow
- $5,007/yr
For passive investors: Depreciation is non-cash, so a rental often shows a tax loss while cash-flowing — sheltering income. Rental losses are passive: they offset passive income freely, and up to $25,000/yr can offset ordinary (W-2) income if you actively participate and your MAGI is under $100k (phasing out to $0 by $150k); unused losses carry forward. On sale, claimed depreciation is recaptured at up to 25%, and gains may owe capital-gains tax (a 1031 exchange can defer both). Figures are a year-1 estimate at your 24.0% rate — not tax advice; consult a CPA.
Schools (NCES district)
- District
- Caddo Parish
- NCES district ID
- 2200300
- Math proficiency
- 21% ▼ -33.00%
- Reading proficiency
- 32% ▼ -30.00%
- Median HH income
- $39,227
- Composite
- 22.23/100
- National rank
- #8148
- State rank
- #53 of 98 in LA
Livability — Shreveport
- Score
- 59/100
- State rank
- #270
- US rank
- #19730
Category grades
Schools grade is shown separately in the Schools card above.
Census & demographics
- Census place
- Shreveport, LA
- County
- Caddo Parish · 178,536 people
- City population
- 164,123
- Metro
- Shreveport-Bossier City, LA
- Population (ZIP)
- 34,117
- Household income
- $81,452
- Rent vs Own
- Severe rent burden
- 1333.0
Population outlook (Caddo County) Hauer SSP2
- Today (2025)
- 243,190 people
- By 2030
- 237,231 · -2.5%
- By 2040
- 222,502 · -8.5%
- By 2050
- 206,516 · -15.1%
- By 2075
- 165,706 · -31.9%
- By 2100
- 122,262 · -49.7%
Race, ethnicity, and origin ACS 2023
- Neighborhood character
- Diverse neighborhood (Simpson 0.59)
- Race & ethnicity
- White 51% Black 39% Hispanic / Latino 5% Two or more races 5%
- Hispanic origin (detail)
- Mexican 3%
- Common ancestry
- Lithuanian 3% Slovak 2% Serbian 1%
- Foreign-born
- 3% · Canada
- Languages at home
- 96% English-only · Spanish 3% Other Indo-European 0%
Political lean MEDSL · Caddo
- 2024 margin
- Toss-up / Even · D 51.6% · R 47.0% · Other 1.4%
- 2008→2024 swing
- +1.6pp toward D · 2008: 3.0pp · 2024: 4.6pp
- All cycles
- 2024: D+4.6 2020: D+6.8 2016: D+4.2 2012: D+4.9 2008: D+3.0
Not yet ingested
- Civics
- —
Market trends
- HPI YoY
- ▼ -86.48%
- Current HPI
- 124.2416
- Rent YoY
- ▲ 7.51%
- Metro
- Shreveport-Bossier City, LA
- State GDP YoY
- ▲ 3.29%
- F500 in state
- 10
Industry mix (Fortune 500 HQ in LA)
| Industry | F500 HQs | Revenue |
|---|---|---|
| Telecommunications | 2 | $23B |
|
||
| Utilities | 1 | $12B |
|
||
| Wholesale / Distribution | 1 | $5B |
|
||
| Advertising | 1 | $2B |
|
||
Price history
-7.8% since first listed5 events — show timeline
- 2026-03-07 Price Changed $46,000 NTREIS
- 2026-02-04 Relisted — NTREIS
- 2026-01-28 Pending — NTREIS
- 2025-12-27 Listed $49,900 NTREIS
- 1979-01-05 Sold (Public Records) — Public Records
Property tax history
+0.6%/yrLatest (2025): $948 · +0.4% YoY. Source: county tax records.
Cash-flow waterfall
monthlySold comps — $/sqft
last 12 mo · ≤1 miLoading sold comps…