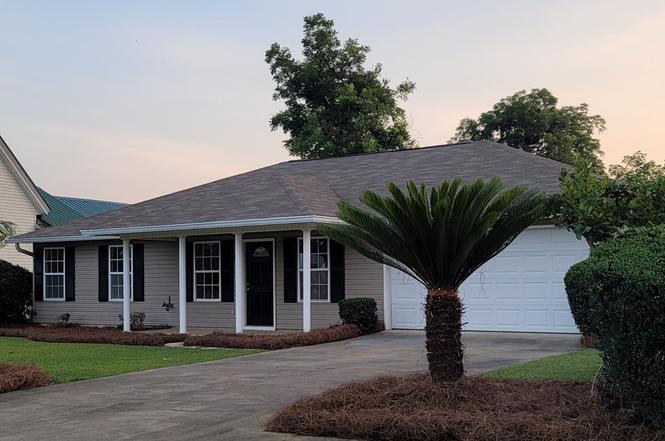
357 S 1st St · Colquitt, GA
Flood risk 1/10 · Minimal
- FEMA flood zone
- X (unshaded)
- Chance of flooding over 30 yrs
- 0.0%
- Est. flood insurance / yr
- $507 – $1,088
Fire risk 4/10 · Minor
- Est. fire insurance / yr
- $963 – $1,789
Heat risk 8/10 · Major
- Hot days now (above 109°F)
- 7 days/yr
- Hot days in 30 yrs
- 20 days/yr
Wind risk 8/10 · Major
- Chance of severe wind over 30 yrs
- 99.0%
Air-quality risk 5/10 · Moderate
- Unhealthy air days now
- 7 days/yr
- Unhealthy air days in 30 yrs
- 8 days/yr
Risk factors via First Street. Map © Google.
Why this score? — see what drove the C- grade
The composite is a weighted blend of 9 inputs, each scored 0–100. Each bar is that input's sub-score; the figure is the points it added to the 100-point composite (weight × sub-score).
- ARV discount +12.3/15.0
- Cash flow +11.8/30.0
- Appreciation +8.3/10.0
- 1% rule +4.3/10.0
- DSCR +3.5/10.0
- Livability +3.4/5.0
- Rent growth +2.5/5.0
- Condition / age +2.5/5.0
- Schools +2.0/10.0
$115,500
🖨 Deal sheet (PDF) 📄 Offer letter ✓ Due diligence
Listing remarks MLS
Just updated in 2023 and ready for new owners!! This 3 bdrm, 2 bath home is located in the heart of Colquitt and is within walking distance of shopping on the town square, restaurants, and swamp gravy folk play. Recent updated include: new waterproof luxury vinyl plank flooring though out the home, new paint, new hardware on interior and exterior doors, new farmhouse kitchen sink and faucet, new countertops, painted cabinets and new hardware, new ceiling fans and lighting. This home also has 6ft vinyl privacy fencing around the back yard, remote controlled electric garage door. The roof was replaced in 2019. If your searching for a newly updated home in Colquitt come take a look!
Key facts
- 8,276 sq ft lot
- Built 2006
- Listed 35 days
Neighborhood map
What this means for you Summary
Snapshot
- This is a 2-bed/2.0-bath single-family listed at $116k.
Deal economics
- At list price, monthly cash flow is $-31 ($-373/yr) — negative.
- To cash-flow at today's rent, offer at most $110k (4.8% below list).
- To meet the 1% rule (rent ≥ 1% of price), the offer needs to be $107k (7.2% below list).
- Recommended offer: $107k (7.2% below list) — sets the bar for 1% rule.
Location & tenants
- Location reads 68/100 on livability (#136 in GA) — a middle-class / working-renter tenant base. Strengths: cost of living A+, health & safety A+, crime A; Watch: amenities F, commute F, employment F.
- Miller County (rural): math 23% / reading 26% proficiency, ranked #131 of 174 in GA (top 75%) — low school quality limits family demand, transient renter base, plan for 1-2y turnover; 65% free/reduced lunch — lower-income household profile, screen leases tightly.
- Zoned schools: Miller County Elementary School (math 27% / reading 32%, grade F, #633 of 1,228 statewide, top 54%, 331 students, 100% FRL); Miller County Middle School (math 17% / reading 22%, grade F, #356 of 470 statewide, top 78%, 156 students, 100% FRL); Miller County High School (math 22% / reading 24%, grade F, #207 of 424 statewide, top 49%, 248 students, 100% FRL) — zoned schools average 100% FRL vs 65% district-wide (35 pts higher); higher-poverty schools than district average — tighter screening recommended.
- Market conditions: 18 active listings in the ZIP; 2 units permitted in Miller County in 2024 (0 in 5+ unit buildings).
Forward outlook
- In year one you build about $8k of equity ($799 loan paydown + $8k appreciation (6.6% local appreciation)).
- Miller County population projected at -21% by 2050 — secular population decline; favor cash flow + early exit over multi-decade hold.
- At projected returns (6.6% appreciation + 3.0% rent growth), your $32k cash investment doubles in ~4 years — after that, you're playing with house money.
- By year 5, paydown + projected appreciation supports a ~$37k cash-out refi (75% LTV) — recoverable capital for the next deal without selling this one.
Negotiation context
- It's been on market 35 days — a 3% lower offer ($112k) is reasonable based on typical stale-listing flexibility.
- 2 sale attempts since 3y ago; this cycle's ask has dropped $10k (8%) from the opening price — seller is motivated, your offer sets the floor, not the list.
Risks & watch-outs
- Climate carrying-cost: severe wind risk, 99% chance of damaging wind over 30y; extreme-heat days projected 7→20/yr by 2055 (HVAC capex compounding) — expect insurance premiums to compound above CPI over the hold.
Questions for the listing agent
- What do current leases actually rent for vs. the listed asking? Can we see a recent rent roll and the last 12 months of T-12 income?
- It's been on market 35 days. Have you received any prior offers? Is the seller open to a 7% concession, seller financing, or rate buy-down credit?
- Is there a deadline driving the sale (1031 exchange, divorce, estate, relocation)? That informs how much negotiation room exists.
- Schools are F-rated, which usually means shorter tenancies and higher turnover. Who's the typical renter profile here, and what's been the actual vacancy rate?
- What's the average days-on-market for RENTAL listings here right now (not sales)? A rising rental-DOM trend means longer vacancies and softer asking-rent achievability than the comps imply.
- What's the recent tenant-quality profile in this submarket — average credit score on applications, eviction rate, late-payment / NSF rate, and stable-employment percentage? A property-management company in the area should have these aggregated.
- How much new for-sale + rental construction is in the pipeline within 1–3 miles? Heavy new supply typically softens prices + rents 12–24 months out; constrained supply supports both.
Investment metrics
- 1% rule
- 0.93% ✗
- Cap rate
- 5.97%
- Cash-on-cash
- -1.15%
- DSCR
- 0.95
- GRM
- 9.0
CMA / ARV
- ARV (on-the-fly)
- $129,344
- Comps found
- 3
Show comp detail 3 sales within ~0.75 mi
| Address | Dist | Beds/Ba | Sqft | Sold | Price | $/sf | Match |
|---|---|---|---|---|---|---|---|
| 154 Peter St | 0.03mi | 3/2.0 (+1) | 1,500 (-0%) | 12mo | $157,500 | $105 | 83 |
| 160 Peter St | 0.02mi | 2/2.0 | 1,504 (0%) | 20mo | $130,000 | $86 | 82 |
| 356 E Pine St | 0.47mi | 3/1.0 (+1) | 1,600 (+6%) | 23mo | $32,500 | $20 | 39 |
Match score weights: distance 35% · size 25% · config 20% · recency 20%. Top-matched comps best support the ARV.
Projected returns pro-forma
6.58% appreciation · 3.0% rent growth · sell at horizon
- IRR
- 15.8%
- Equity multiple
- 2.10×
- Total profit
- $35,439
- Equity at exit
- $76,868
- IRR
- 15.7%
- Equity multiple
- 4.25×
- Total profit
- $105,004
- Equity at exit
- $143,231
Cash invested: $32,340 (down + closing). Projections, not guarantees.
Landlord ↔ Tenant lean methodology
- Overall (STATE)
- 90 Strongly Landlord-Friendly
- State Georgia
- 90 Strongly Landlord-Friendly · R+3
- County
- — inherits STATE
- City
- — inherits STATE
ZIP-level market 39837
- Home prices YoY
- 2.7%
- Active inventory
- 18
- Price-to-rent
- 9.0×
Monthly cashflow live
- Estimated rent
- $1,072 medium interval (Pro) →
- Mortgage (P&I)
- −$606
- Tax from tax record
- −$224 /mo · $2,689/yr
- Insurance
- −$48
- HOA
- −$0
- Lot rent
- −$0
- Vacancy / Maint / Mgmt
- −$225
- Net cashflow
- $-31
Break-even live
Sensitivity live
| Price | -10% $34 | -5% $2 | +0% $-31 | +5% $-64 | +10% $-96 |
|---|---|---|---|---|---|
| Rent | -10% $-116 | -5% $-73 | +0% $-31 | +5% $11 | +10% $54 |
| Rate | -1.0pp $27 | -0.5pp $-2 | base $-31 | +0.5pp $-61 | +1.0pp $-91 |
UW: 25.0% down · 7.5% · 30yr · 1.5% tax · 5.0% vac · 8.0% maint · 8.0% mgmt
Financing live
Cash to close
- Down payment
- $28,875
- Closing costs
- $3,465
- Reserves months
- —
- Total cash needed
- —
Loan-product check · same deal, 3 products live
Conventional
25% down · 7.5% · 30yr
- Down + closing
- —
- Monthly P&I
- —
- Monthly cashflow
- —
- DSCR
- —
- Eligible?
- —
Personal DTI + credit; lowest rate.
DSCR
20% down · 8.5% · 30yr
- Down + closing
- —
- Monthly P&I
- —
- Monthly cashflow
- —
- DSCR
- —
- Eligible?
- —
No personal income docs; deal must DSCR.
Hard money
10% down · 12.0% · 12mo
- Down + closing
- —
- Monthly P&I
- —
- Monthly cashflow
- —
- DSCR
- —
- Eligible?
- —
Short-term bridge; refi at stabilization.
Listing history 9 events
-
2026-03-17status Pending
-
2026-03-12price $115,500
-
2026-02-04$125,500 Active
-
2023-11-21soldstatus $187,000 689-char remark
Show marketing remark (689 chars)
Just updated in 2023 and ready for new owners!! This 3 bdrm, 2 bath home is located in the heart of Colquitt and is within walking distance of shopping on the town square, restaurants, and swamp gravy folk play. Recent updated include: new waterproof luxury vinyl plank flooring though out the home, new paint, new hardware on interior and exterior doors, new farmhouse kitchen sink and faucet, new countertops, painted cabinets and new hardware, new ceiling fans and lighting. This home also has 6ft vinyl privacy fencing around the back yard, remote controlled electric garage door. The roof was replaced in 2019. If your searching for a newly updated home in Colquitt come take a look!
-
2023-11-21soldstatus $187,000
Show marketing remark (689 chars)
Just updated in 2023 and ready for new owners!! This 3 bdrm, 2 bath home is located in the heart of Colquitt and is within walking distance of shopping on the town square, restaurants, and swamp gravy folk play. Recent updated include: new waterproof luxury vinyl plank flooring though out the home, new paint, new hardware on interior and exterior doors, new farmhouse kitchen sink and faucet, new countertops, painted cabinets and new hardware, new ceiling fans and lighting. This home also has 6ft vinyl privacy fencing around the back yard, remote controlled electric garage door. The roof was replaced in 2019. If your searching for a newly updated home in Colquitt come take a look!
-
2023-08-19$187,000 689-char remark
Show marketing remark (689 chars)
Just updated in 2023 and ready for new owners!! This 3 bdrm, 2 bath home is located in the heart of Colquitt and is within walking distance of shopping on the town square, restaurants, and swamp gravy folk play. Recent updated include: new waterproof luxury vinyl plank flooring though out the home, new paint, new hardware on interior and exterior doors, new farmhouse kitchen sink and faucet, new countertops, painted cabinets and new hardware, new ceiling fans and lighting. This home also has 6ft vinyl privacy fencing around the back yard, remote controlled electric garage door. The roof was replaced in 2019. If your searching for a newly updated home in Colquitt come take a look!
-
2023-06-13soldstatus $103,000
-
2010-02-05soldstatus $100,000
-
2009-12-31soldstatus $338,500
ⓘ Source: listings_history table (triggers on properties + properties_extension) + one-shot
backfill from property_details.listing_events for pre-trigger history.
Tax reassessment forecast GA · Resets to sale price
- Current annual tax
- $2,689 · $224/mo
- Projected year-2 tax
- $2,689 · $224/mo
- Expected delta
- $0/yr ($0/mo · 0.0%)
ⓘ Screening estimate from a state-policy table — verify with the county assessor before closing.
Climate risk First Street
- Flood 1/10 Low FEMA zone X (unshaded) · 0% chance over 30 yrs
- Wildfire 4/10 Moderate
- Heat 8/10 Severe 7 d/yr ≥109°F today · 20 d/yr by 30 yrs out
- Wind 8/10 Severe 99% chance of damaging wind over 30 yrs
- Air quality 5/10 Major 7 unhealthy d/yr today · 8 by 30 yrs out
Nearby sold comps map
Loading sold comps map…
Walkable amenities ~0.75 mi
Loading nearby amenities…
Taxation est. · year 1
- Rental income
- $12,863
- − Mortgage interest
- −$6,470
- − Property taxes
- −$2,689
- − Insurance
- −$578
- − Repairs & maintenance
- −$1,029
- − Management
- −$1,029
- − Depreciation
- −$3,360
- Taxable loss
- −$2,291
- Est. tax savings @ 24.0%
- +$550
- After-tax cash flow
- $177/yr
For passive investors: Depreciation is non-cash, so a rental often shows a tax loss while cash-flowing — sheltering income. Rental losses are passive: they offset passive income freely, and up to $25,000/yr can offset ordinary (W-2) income if you actively participate and your MAGI is under $100k (phasing out to $0 by $150k); unused losses carry forward. On sale, claimed depreciation is recaptured at up to 25%, and gains may owe capital-gains tax (a 1031 exchange can defer both). Figures are a year-1 estimate at your 24.0% rate — not tax advice; consult a CPA.
Schools (NCES district)
- District
- Miller County
- NCES district ID
- 1303660
- Math proficiency
- 23% ▼ -8.00%
- Reading proficiency
- 26% ▼ -7.00%
- Median HH income
- $35,319
- Composite
- 20.24/100
- National rank
- #8625
- State rank
- #131 of 174 in GA
Livability — Colquitt
- Score
- 68/100
- State rank
- #136
- US rank
- #9304
Category grades
Schools grade is shown separately in the Schools card above.
Census & demographics
- Census place
- Colquitt, GA
- Population (ZIP)
- 5,994
Population outlook (Miller County) Hauer SSP2
- Today (2025)
- 5,401 people
- By 2030
- 5,146 · -4.7%
- By 2040
- 4,675 · -13.4%
- By 2050
- 4,282 · -20.7%
- By 2075
- 3,577 · -33.8%
- By 2100
- 3,087 · -42.8%
Race, ethnicity, and origin ACS 2023
- Neighborhood character
- Majority White (64%)
- Race & ethnicity
- White 64% Black 29% Two or more races 4% Hispanic / Latino 3%
- Common ancestry
- Lithuanian 1% Romanian 1% Italian 1%
- Foreign-born
- 2% · Canada
- Languages at home
- 96% English-only · Spanish 2% French/Haitian/Cajun 1%
Political lean MEDSL · Miller
- 2024 margin
- Solid R (+50.5) · D 24.6% · R 75.1%
- 2008→2024 swing
- -11.0pp toward R · 2008: -39.5pp · 2024: -50.5pp
- All cycles
- 2024: R+50.5 2020: R+46.5 2016: R+49.8 2012: R+38.1 2008: R+39.5
Not yet ingested
- Civics
- —
Market trends
- HPI YoY
- ▲ 6.58%
- Current HPI
- 246.936
- Rent YoY
- —
- Metro
- —
- State GDP YoY
- ▲ 2.66%
- F500 in state
- 28
Industry mix (Fortune 500 HQ in GA)
| Industry | F500 HQs | Revenue |
|---|---|---|
| Paper / Packaging | 2 | $29B |
|
||
| Retail | 1 | $160B |
|
||
| Transportation / Logistics | 1 | $91B |
|
||
| Airlines | 1 | $62B |
|
||
| Consumer Goods | 1 | $47B |
|
||
| Utilities | 1 | $25B |
|
||
Price history
-65.9% since first listed9 events — show timeline
- 2026-03-17 Pending — SWGABOR
- 2026-03-12 Price Changed $115,500 SWGABOR
- 2026-02-04 Listed $125,500 SWGABOR
- 2023-11-21 Sold (Public Records) $187,000 Public Records
- 2023-11-21 Sold (MLS) $187,000 SWGABOR
- 2023-08-19 Listed $187,000 SWGABOR
- 2023-06-13 Sold (Public Records) $103,000 Public Records
- 2010-02-05 Sold (Public Records) $100,000 Public Records
- 2009-12-31 Sold (Public Records) $338,500 Public Records
Property tax history
+6.6%/yrLatest (2025): $2,689 · -0.8% YoY. Source: county tax records.
Cash-flow waterfall
monthlySold comps — $/sqft
last 12 mo · ≤1 miLoading sold comps…