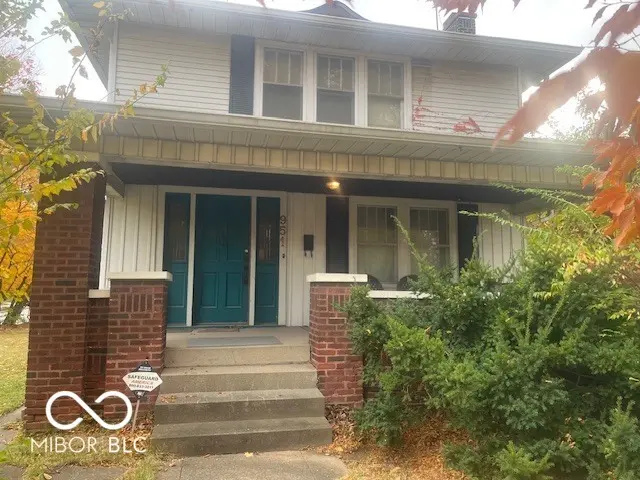
951 E Southern Ave · Indianapolis city (balance), IN
Flood risk 1/10 · Minimal
- FEMA flood zone
- X (unshaded)
- Chance of flooding over 30 yrs
- 0.0%
- Est. flood insurance / yr
- $473 – $860
Fire risk 1/10 · Minimal
- Est. fire insurance / yr
- $717 – $1,331
Heat risk 3/10 · Minor
- Hot days now (above 101°F)
- 7 days/yr
- Hot days in 30 yrs
- 19 days/yr
Wind risk 2/10 · Minimal
- Chance of severe wind over 30 yrs
- 0.0%
Air-quality risk 3/10 · Minor
- Unhealthy air days now
- 2 days/yr
- Unhealthy air days in 30 yrs
- 3 days/yr
Risk factors via First Street. Map © Google.
Why this score? — see what drove the C- grade
The composite is a weighted blend of 9 inputs, each scored 0–100. Each bar is that input's sub-score; the figure is the points it added to the 100-point composite (weight × sub-score).
- Cash flow +17.0/30.0
- ARV discount +15.0/15.0
- DSCR +5.3/10.0
- 1% rule +4.5/10.0
- Rent growth +3.2/5.0
- Livability +2.5/5.0
- Condition / age +2.5/5.0
- Schools +1.4/10.0
- Appreciation +0.0/10.0
$189,900
🖨 Deal sheet 📄 Offer letter ✓ Due diligence
Listing remarks MLS
Investment Opportunity!! Located at 951 E Southern Ave., Indianapolis, IN, this single-family residence presents a great investment opportunity for handy homeowners and investors alike. This property offers a canvas for creating a personalized haven. The living room features a fireplace and crown molding, along with large windows that look out to Garfield Park just across the street. With 1810 square feet of living area situated on an 8538 square foot lot, the two-story layout provides ample space for comfortable living, complemented by the charm of a welcoming porch. This residence includes three bedrooms, and hardwood floors throughout, along with a built-in buffet in the dining room and built-in shelves and bench in the Living room. You're just minutes away from the iconic Garfield Park and the Garfield Park Conservatory and Gardens-perfect for morning jogs or evening concerts. Plus, enjoy quick access to local favorites and downtown Indy. This 1920s home, with its blend of classic features and investment potential, is ready for its' transformation.
Key facts
- Large windows
- Built-in buffet
- Built-in shelves
Tags
Neighborhood map
What this means for you Summary
Snapshot
- This is a 3-bed/1.0-bath single-family listed at $190k.
Deal economics
- At list price, monthly cash flow is $129 ($2k/yr) — positive.
- The deal already cash-flows at list — no discount required.
- To meet the 1% rule (rent ≥ 1% of price), the offer needs to be $180k (5.3% below list).
- Recommended offer: $179k (6.0% below list) — sets the bar for market timing.
- Cap rate 7.1% vs local median 4.4% in Indianapolis city (balance) — top-decile yield for the area; either an underpriced asset or a hidden risk that comps aren't pricing in. Stress-test before assuming the spread holds.
Location & tenants
- Location reads: area grade C — affects rentability + tenant quality, not the cash-flow math above.
- Indianapolis Public Schools (urban): math 14% / reading 20% proficiency, ranked #286 of 301 in IN (top 95%) — low school quality limits family demand, transient renter base, plan for 1-2y turnover; 77% free/reduced lunch — lower-income household profile, screen leases tightly.
- Market conditions: Rents rising (+2.9%/yr); 493 active listings in the ZIP; 40 comparable units currently listed for rent nearby; rentals at typical pace (median 24d on market — plan ~3-4 weeks tenant-placement turnaround); 1,906 units permitted in Marion County in 2024 (621 in 5+ unit buildings).
- This rent runs 38% of the median local income ($57k/yr) — at the standard rent-burdened threshold; future hikes will face affordability resistance.
Forward outlook
- Local home prices are declining (-3.0%/yr); year-one equity from $1k of loan paydown is wiped out by about $6k of value loss. Plan a longer hold.
- Marion County population projected at +18% by 2050 — long-run rental-demand tailwind backs the buy-and-hold thesis.
Negotiation context
- It's been on market 86 days — a 6% lower offer ($179k) is reasonable based on typical stale-listing flexibility.
- 6 sale attempts since 22y ago; this cycle's ask has dropped $10k (5%) from the opening price — seller is motivated, your offer sets the floor, not the list.
Risks & watch-outs
- Watch-outs: built in 1920 — expect roof / HVAC / electrical / plumbing capex.
Questions for the listing agent
- It's been on market 86 days. Have you received any prior offers? Is the seller open to a 6% concession, seller financing, or rate buy-down credit?
- Built in 1920 — when were the roof, HVAC, electrical panel, plumbing, and water heater last replaced?
- Why hasn't it sold? Are there any deal-killer items the seller is aware of (foundation, flood, title, zoning, code violations)?
- Is there a deadline driving the sale (1031 exchange, divorce, estate, relocation)? That informs how much negotiation room exists.
- What's the average days-on-market for RENTAL listings here right now (not sales)? A rising rental-DOM trend means longer vacancies and softer asking-rent achievability than the comps imply.
- What's the recent tenant-quality profile in this submarket — average credit score on applications, eviction rate, late-payment / NSF rate, and stable-employment percentage? A property-management company in the area should have these aggregated.
- How much new for-sale + rental construction is in the pipeline within 1–3 miles? Heavy new supply typically softens prices + rents 12–24 months out; constrained supply supports both.
Investment metrics
- 1% rule
- 0.95% ✗
- Cap rate
- 7.11%
- Cash-on-cash
- 2.91%
- DSCR
- 1.13
- GRM
- 8.8
CMA / ARV
- ARV (median comp)
- $250,537
- List price
- $189,900
- Delta
- -24.20%
- Verdict
- UNDERPRICED
- Comps
- 20 within 1.0 mi
Show comp detail 12 sales within ~0.75 mi
| Address | Dist | Beds/Ba | Sqft | Sold | Price | $/sf | Match |
|---|---|---|---|---|---|---|---|
| 2707 Manker St | 0.13mi | 2/1.0 (-1) | 1,764 (-2%) | 6mo | $217,000 | $123 | 80 |
| 2658 Allen Ave | 0.16mi | 2/1.0 (-1) | 1,696 (-6%) | 0mo | $210,000 | $124 | 76 |
| 1015 E Bradbury Ave | 0.32mi | 2/1.5 (-1) | 1,896 (+5%) | 2mo | $289,000 | $152 | 68 |
| 1015 Cameron St | 0.31mi | 3/2.0 | 1,970 (+9%) | 2mo | $275,000 | $140 | 65 |
| 2125 S Garfield Dr | 0.63mi | 3/2.5 | 1,820 (+1%) | 0mo | $285,000 | $157 | 63 |
| 2145 Singleton St | 0.65mi | 3/1.0 | 1,869 (+3%) | 1mo | $152,000 | $81 | 63 |
| 1616 Walker Ave | 0.62mi | 3/2.0 | 1,862 (+3%) | 3mo | $185,000 | $99 | 60 |
| 1629 Hoefgen St | 0.60mi | 3/2.0 | 1,904 (+5%) | 0mo | $160,000 | $84 | 59 |
| 2924 Beech St | 0.52mi | 2/— (-1) | 1,728 (-4%) | 6mo | $66,500 | $38 | 58 |
| 1601 Hoefgen St | 0.55mi | 2/1.0 (-1) | 1,920 (+6%) | 3mo | $124,900 | $65 | 57 |
| 324 E Southern Ave | 0.45mi | 2/2.0 (-1) | 1,632 (-10%) | 2mo | $199,900 | $122 | 52 |
| 156 E Pleasant Run Parkway North Dr | 0.75mi | 2/1.0 (-1) | 2,020 (+12%) | 0mo | $195,000 | $97 | 40 |
Match score weights: distance 35% · size 25% · config 20% · recency 20%. Top-matched comps best support the ARV.
Projected returns pro-forma
-3.0% appreciation · 2.88% rent growth · sell at horizon
- IRR
- -11.8%
- Equity multiple
- 0.57×
- Total profit
- $-22,763
- Equity at exit
- $28,315
- IRR
- -2.8%
- Equity multiple
- 0.81×
- Total profit
- $-10,076
- Equity at exit
- $16,419
Cash invested: $53,172 (down + closing). Projections, not guarantees.
Landlord ↔ Tenant lean methodology
- Overall (STATE)
- 90 Strongly Landlord-Friendly
- State Indiana
- 90 Strongly Landlord-Friendly · R+11
- County
- — inherits STATE
- City
- — inherits STATE
ZIP-level market 46203
- Home prices YoY
- -26.7%
- Rents YoY
- 2.9%
- Active inventory
- 493
- Price-to-rent
- 8.8×
Monthly cashflow live
- Estimated rent
- $1,798 high interval (Pro) →
- Mortgage (P&I)
- −$996
- Tax from tax record
- −$217 /mo · $2,602/yr
- Insurance
- −$79
- HOA
- −$0
- Vacancy / Maint / Mgmt
- −$378
- Net cashflow
- $129
Break-even live
UW: 25.0% down · 7.5% · 30yr · 1.5% tax · 5.0% vac · 8.0% maint · 8.0% mgmt
Financing live
Cash to close
- Down payment
- $47,475
- Closing costs
- $5,697
- Reserves months
- —
- Total cash needed
- —
Loan-product check · same deal, 3 products live
Conventional
25% down · 7.5% · 30yr
- Down + closing
- —
- Monthly P&I
- —
- Monthly cashflow
- —
- DSCR
- —
- Eligible?
- —
Personal DTI + credit; lowest rate.
DSCR
20% down · 8.5% · 30yr
- Down + closing
- —
- Monthly P&I
- —
- Monthly cashflow
- —
- DSCR
- —
- Eligible?
- —
No personal income docs; deal must DSCR.
Hard money
10% down · 12.0% · 12mo
- Down + closing
- —
- Monthly P&I
- —
- Monthly cashflow
- —
- DSCR
- —
- Eligible?
- —
Short-term bridge; refi at stabilization.
Rent comps 40 comps
| Address | Beds | Baths | Sqft | Rent | $/sqft | DOM | Units | Dist |
|---|---|---|---|---|---|---|---|---|
| 1628 Cruft St Indianapolis, IN | 3.0 | 2.0 | 1992 | $1,495 | $0.75 | 43d | 1 | 0.56mi |
| 1546 E Bradbury Ave Indianapolis, IN | 2.0 | 1.5 | 2066 | $1,500 | $0.73 | 43d | 1 | 0.58mi |
| 1528 E Tabor St Indianapolis, IN | 3.0 | 1.5 | 2200 | $1,550 | $0.70 | 14d | 1 | 0.66mi |
| 2109 Singleton St Indianapolis, IN | 3.0 | 2.0 | 1340 | $2,100 | $1.57 | 7d | 1 | 0.70mi |
| 1621 Knox St Indianapolis, IN | 4.0 | 2.0 | 1411 | $930 | $0.66 | 4d | 1 | 0.79mi |
| 1861 Barth Ave Unit 1861 Indianapolis, IN | 2.0 | 1.0 | 1300 | $1,600 | $1.23 | 23d | 1 | 0.85mi |
| 3319 Olive St Indianapolis, IN | 3.0 | 2.0 | 1588 | $1,450 | $0.91 | 23d | 1 | 0.89mi |
| 2283 Union St Indianapolis, IN | 3.0 | 2.0 | 1824 | $1,820 | $1.00 | 23d | 1 | 0.90mi |
| 1835 Applegate St Indianapolis, IN | 4.0 | 3.0 | 2024 | $2,300 | $1.14 | 43d | 1 | 0.91mi |
| 438 E Beecher St Indianapolis, IN | 3.0 | 2.5 | 1500 | $1,450 | $0.97 | 23d | 1 | 0.92mi |
| 1833 Orleans St Unit 1 Indianapolis, IN | 3.0 | 1.0 | 1260 | $1,350 | $1.07 | 43d | 1 | 0.93mi |
| 1258 E Naomi St Indianapolis, IN | 3.0 | 2.0 | 1608 | $1,450 | $0.90 | 7d | 1 | 0.93mi |
| 1830 Orleans St Indianapolis, IN | 3.0 | 2.5 | 1586 | $1,995 | $1.26 | 43d | 1 | 0.94mi |
| 3216 Brill Rd Indianapolis, IN | 3.0 | 2.0 | 1628 | $1,646 | $1.01 | 23d | 1 | 0.98mi |
| 1742 Thaddeus St Unit 1742-A Indianapolis, IN | 3.0 | 2.0 | 1350 | $1,600 | $1.19 | 13d | 1 | 1.03mi |
| 1729 Thaddeus St Unit 1729-B Indianapolis, IN | 3.0 | 2.0 | 1350 | $1,600 | $1.19 | 13d | 1 | 1.07mi |
| 224 Iowa St Indianapolis, IN | 3.0 | 1.0 | 1254 | $1,450 | $1.16 | 23d | 1 | 1.12mi |
| 1641 Iowa St Indianapolis, IN | 3.0 | 3.0 | 1938 | $1,900 | $0.98 | 23d | 1 | 1.13mi |
| 835 Weghorst St Unit 837 Indianapolis, IN | 3.0 | 1.5 | 1500 | $1,399 | $0.93 | 23d | 1 | 1.15mi |
| 1713 S Delaware St Indianapolis, IN | 2.0 | 2.0 | 1785 | $1,700 | $0.95 | 43d | 1 | 1.19mi |
| 3219 Keystone Lakes Way Indianapolis, IN | 4.0 | 2.0 | 1986 | $1,861 | $0.94 | 23d | 1 | 1.22mi |
| 1602 Quill St Unit B Indianapolis, IN | 3.0 | 2.0 | 1250 | $1,650 | $1.32 | 14d | 1 | 1.24mi |
| 1602 Quill St Unit B Indianapolis, IN | 3.0 | 2.0 | 1250 | $1,750 | $1.40 | 43d | 1 | 1.24mi |
| 752 Cottage Ave Indianapolis, IN | 3.0 | 2.0 | 1548 | $1,750 | $1.13 | 14d | 1 | 1.24mi |
| 728 Cottage Ave Indianapolis, IN | 3.0 | 2.5 | 1831 | $2,550 | $1.39 | 23d | 1 | 1.25mi |
| 1436 S New Jersey St Unit A Indianapolis, IN | 3.0 | 2.5 | 1300 | $2,100 | $1.62 | 23d | 1 | 1.27mi |
| 1337 Barth Ave Indianapolis, IN | 3.0 | 1.0 | 2468 | $1,700 | $0.69 | 7d | 1 | 1.32mi |
| 1337 Barth Ave Indianapolis, IN | 3.0 | 1.0 | 2468 | $1,700 | $0.69 | 16d | 1 | 1.32mi |
| 1337 Barth Ave Indianapolis, IN | 3.0 | 1.0 | 2468 | $1,700 | $0.69 | 10d | 1 | 1.32mi |
| 1337 Barth Ave Unit NA Indianapolis, IN | 3.0 | 1.0 | 2468 | $1,700 | $0.69 | 4d | 1 | 1.32mi |
| 1045 Orange St Indianapolis, IN | 2.0 | 1.0 | 1232 | $2,000 | $1.62 | 23d | 1 | 1.32mi |
| 1045 Orange St Indianapolis, IN | 2.0 | 1.0 | 1232 | $2,200 | $1.79 | 43d | 1 | 1.32mi |
| 734 Parkway Ave Indianapolis, IN | 3.0 | 2.0 | 2110 | $2,299 | $1.09 | 23d | 1 | 1.34mi |
| 1619 S Randolph St Indianapolis, IN | 3.0 | 1.0 | 2016 | $1,195 | $0.59 | 23d | 1 | 1.35mi |
| 614 Parkway Ave Indianapolis, IN | 3.0 | 2.0 | 1360 | $1,900 | $1.40 | 21d | 1 | 1.36mi |
| 243 Terrace Ave Indianapolis, IN | 4.0 | 2.0 | 1669 | $2,700 | $1.62 | 17d | 1 | 1.36mi |
| 1330 Laurel St Indianapolis, IN | 3.0 | 2.0 | 1911 | $2,250 | $1.18 | 20d | 1 | 1.36mi |
| 350 Terrace Ave Indianapolis, IN | 4.0 | 2.5 | 2552 | $3,000 | $1.18 | 23d | 1 | 1.37mi |
| 350 Terrace Ave Indianapolis, IN | 4.0 | 2.5 | 2552 | $3,000 | $1.18 | 4d | 1 | 1.37mi |
| 1247 Wright St Indianapolis, IN | 3.0 | 1.5 | 1247 | $1,750 | $1.40 | 17d | 1 | 1.40mi |
Listing history 13 events
-
2026-05-11status Pending 1077-char remark
Show marketing remark (1077 chars)
Investment Opportunity!! Located at 951 E Southern Ave., Indianapolis, IN, this single-family residence presents a great investment opportunity for handy homeowners and investors alike. This property offers a canvas for creating a personalized haven. The living room features a fireplace and crown molding, along with large windows that look out to Garfield Park just across the street. With 1810 square feet of living area situated on an 8538 square foot lot, the two-story layout provides ample space for comfortable living, complemented by the charm of a welcoming porch. This residence includes three bedrooms, and hardwood floors throughout, along with a built-in buffet in the dining room and built-in shelves and bench in the Living room. You're just minutes away from the iconic Garfield Park and the Garfield Park Conservatory and Gardens-perfect for morning jogs or evening concerts. Plus, enjoy quick access to local favorites and downtown Indy. This 1920s home, with its blend of classic features and investment potential, is ready for its' transformation.
-
2026-04-09price $189,900 1077-char remark
Show marketing remark (1077 chars)
Investment Opportunity!! Located at 951 E Southern Ave., Indianapolis, IN, this single-family residence presents a great investment opportunity for handy homeowners and investors alike. This property offers a canvas for creating a personalized haven. The living room features a fireplace and crown molding, along with large windows that look out to Garfield Park just across the street. With 1810 square feet of living area situated on an 8538 square foot lot, the two-story layout provides ample space for comfortable living, complemented by the charm of a welcoming porch. This residence includes three bedrooms, and hardwood floors throughout, along with a built-in buffet in the dining room and built-in shelves and bench in the Living room. You're just minutes away from the iconic Garfield Park and the Garfield Park Conservatory and Gardens-perfect for morning jogs or evening concerts. Plus, enjoy quick access to local favorites and downtown Indy. This 1920s home, with its blend of classic features and investment potential, is ready for its' transformation.
-
2026-03-24status Active 1077-char remark
Show marketing remark (1077 chars)
Investment Opportunity!! Located at 951 E Southern Ave., Indianapolis, IN, this single-family residence presents a great investment opportunity for handy homeowners and investors alike. This property offers a canvas for creating a personalized haven. The living room features a fireplace and crown molding, along with large windows that look out to Garfield Park just across the street. With 1810 square feet of living area situated on an 8538 square foot lot, the two-story layout provides ample space for comfortable living, complemented by the charm of a welcoming porch. This residence includes three bedrooms, and hardwood floors throughout, along with a built-in buffet in the dining room and built-in shelves and bench in the Living room. You're just minutes away from the iconic Garfield Park and the Garfield Park Conservatory and Gardens-perfect for morning jogs or evening concerts. Plus, enjoy quick access to local favorites and downtown Indy. This 1920s home, with its blend of classic features and investment potential, is ready for its' transformation.
-
2026-02-20status Pending 1077-char remark
Show marketing remark (1077 chars)
Investment Opportunity!! Located at 951 E Southern Ave., Indianapolis, IN, this single-family residence presents a great investment opportunity for handy homeowners and investors alike. This property offers a canvas for creating a personalized haven. The living room features a fireplace and crown molding, along with large windows that look out to Garfield Park just across the street. With 1810 square feet of living area situated on an 8538 square foot lot, the two-story layout provides ample space for comfortable living, complemented by the charm of a welcoming porch. This residence includes three bedrooms, and hardwood floors throughout, along with a built-in buffet in the dining room and built-in shelves and bench in the Living room. You're just minutes away from the iconic Garfield Park and the Garfield Park Conservatory and Gardens-perfect for morning jogs or evening concerts. Plus, enjoy quick access to local favorites and downtown Indy. This 1920s home, with its blend of classic features and investment potential, is ready for its' transformation.
-
2026-01-12$199,900 Active 1077-char remark
Show marketing remark (1077 chars)
Investment Opportunity!! Located at 951 E Southern Ave., Indianapolis, IN, this single-family residence presents a great investment opportunity for handy homeowners and investors alike. This property offers a canvas for creating a personalized haven. The living room features a fireplace and crown molding, along with large windows that look out to Garfield Park just across the street. With 1810 square feet of living area situated on an 8538 square foot lot, the two-story layout provides ample space for comfortable living, complemented by the charm of a welcoming porch. This residence includes three bedrooms, and hardwood floors throughout, along with a built-in buffet in the dining room and built-in shelves and bench in the Living room. You're just minutes away from the iconic Garfield Park and the Garfield Park Conservatory and Gardens-perfect for morning jogs or evening concerts. Plus, enjoy quick access to local favorites and downtown Indy. This 1920s home, with its blend of classic features and investment potential, is ready for its' transformation.
-
2007-02-08historical
-
2006-08-09$145,000
-
2005-09-12historical
-
2005-01-12$149,900
-
2005-01-08historical
-
2004-07-09$149,900
-
2004-04-12historical
-
2004-01-14$159,900
ⓘ Source: listings_history table (triggers on properties + properties_extension) + one-shot
backfill from property_details.listing_events for pre-trigger history.
Tax reassessment forecast IN · Partial reset (capped growth)
- Current annual tax
- $2,602 · $217/mo
- Projected year-2 tax
- $2,602 · $217/mo
- Expected delta
- $0/yr ($0/mo · 0.0%)
ⓘ Screening estimate from a state-policy table — verify with the county assessor before closing.
Climate risk First Street
- Flood 1/10 Low FEMA zone X (unshaded) · 0% chance over 30 yrs
- Wildfire 1/10 Low
- Heat 3/10 Moderate 7 d/yr ≥101°F today · 19 d/yr by 30 yrs out
- Wind 2/10 Low 0% chance of damaging wind over 30 yrs
- Air quality 3/10 Moderate 2 unhealthy d/yr today · 3 by 30 yrs out
Nearby sold comps map
Loading sold comps map…
Walkable amenities ~0.75 mi
Loading nearby amenities…
Taxation est. · year 1
- Rental income
- $21,580
- − Mortgage interest
- −$10,637
- − Property taxes
- −$2,602
- − Insurance
- −$950
- − Repairs & maintenance
- −$1,726
- − Management
- −$1,726
- − Depreciation
- −$5,524
- Taxable loss
- −$1,585
- Est. tax savings @ 24.0%
- +$380
- After-tax cash flow
- $1,928/yr
For passive investors: Depreciation is non-cash, so a rental often shows a tax loss while cash-flowing — sheltering income. Rental losses are passive: they offset passive income freely, and up to $25,000/yr can offset ordinary (W-2) income if you actively participate and your MAGI is under $100k (phasing out to $0 by $150k); unused losses carry forward. On sale, claimed depreciation is recaptured at up to 25%, and gains may owe capital-gains tax (a 1031 exchange can defer both). Figures are a year-1 estimate at your 24.0% rate — not tax advice; consult a CPA.
Schools (NCES district)
- District
- Indianapolis Public Schools
- NCES district ID
- 1804770
- Math proficiency
- 14% ▼ -7.00%
- Reading proficiency
- 20% ▼ -3.00%
- Median HH income
- $32,034
- Composite
- 13.69/100
- National rank
- #9499
- State rank
- #286 of 301 in IN
Livability — Indianapolis city (balance)
No livability data for this city. (Only ~50 U.S. cities are tracked.)
Census & demographics
- Census place
- Indianapolis city (balance), IN
- County
- Marion County · 998,460 people
- City population
- 881,119
- Metro
- Indianapolis-Carmel-Anderson, IN
- Population (ZIP)
- 37,758
- Household income
- $57,393
- Rent vs Own
- Severe rent burden
- 1499.0
Population outlook (Marion County) Hauer SSP2
- Today (2025)
- 1,025,572 people
- By 2030
- 1,065,727 · +3.9%
- By 2040
- 1,141,577 · +11.3%
- By 2050
- 1,208,920 · +17.9%
- By 2075
- 1,367,288 · +33.3%
- By 2100
- 1,438,201 · +40.2%
Race, ethnicity, and origin ACS 2023
- Neighborhood character
- Predominantly White (69%)
- Race & ethnicity
- White 69% Hispanic / Latino 14% Black 12% Two or more races 8% Asian 2% Native American 1%
- Hispanic origin (detail)
- Mexican 12% Puerto Rican 1%
- Common ancestry
- Slovak 2% Lithuanian 2% Italian 1%
- Foreign-born
- 8% · Canada
- Languages at home
- 88% English-only · Spanish 10% Other Indo-European 1%
Political lean MEDSL · Marion
- 2024 margin
- Strong D (+27.7) · D 63.0% · R 35.3% · Other 1.7%
- 2008→2024 swing
- -0.7pp no change · 2008: 28.4pp · 2024: 27.7pp
- All cycles
- 2024: D+27.7 2020: D+29.1 2016: D+22.8 2012: D+22.2 2008: D+28.4
Not yet ingested
- Civics
- —
Market trends
- HPI YoY
- ▼ -127.37%
- Current HPI
- 349.579
- Rent YoY
- ▲ 2.88%
- Metro
- Indianapolis-Carmel-Anderson, IN
- State GDP YoY
- ▲ 2.90%
- F500 in state
- 18
Industry mix (Fortune 500 HQ in IN)
| Industry | F500 HQs | Revenue |
|---|---|---|
| Industrial Machinery | 2 | $37B |
|
||
| Healthcare | 1 | $177B |
|
||
| Pharmaceuticals | 1 | $45B |
|
||
| Metals / Steel | 1 | $18B |
|
||
| Agriculture | 1 | $17B |
|
||
| Packaging | 1 | $12B |
|
||
Price history
+18.8% since first listed13 events — show timeline
- 2026-05-11 Pending — MIBOR as Distributed by MLS Grid
- 2026-04-09 Price Changed $189,900 MIBOR as Distributed by MLS Grid
- 2026-03-24 Relisted — MIBOR as Distributed by MLS Grid
- 2026-02-20 Pending — MIBOR as Distributed by MLS Grid
- 2026-01-12 Listed $199,900 MIBOR as Distributed by MLS Grid
- 2007-02-08 Listing Removed — MIBOR as Distributed by MLS Grid
- 2006-08-09 Listed $145,000 MIBOR as Distributed by MLS Grid
- 2005-09-12 Listing Removed — MIBOR as Distributed by MLS Grid
- 2005-01-12 Listed $149,900 MIBOR as Distributed by MLS Grid
- 2005-01-08 Listing Removed — MIBOR as Distributed by MLS Grid
- 2004-07-09 Listed $149,900 MIBOR as Distributed by MLS Grid
- 2004-04-12 Listing Removed — MIBOR as Distributed by MLS Grid
- 2004-01-14 Listed $159,900 MIBOR as Distributed by MLS Grid
Property tax history
+0.9%/yrLatest (2025): $2,602 · +4.9% YoY. Source: county tax records.
Cash-flow waterfall
monthlySold comps — $/sqft
last 12 mo · ≤1 miLoading sold comps…