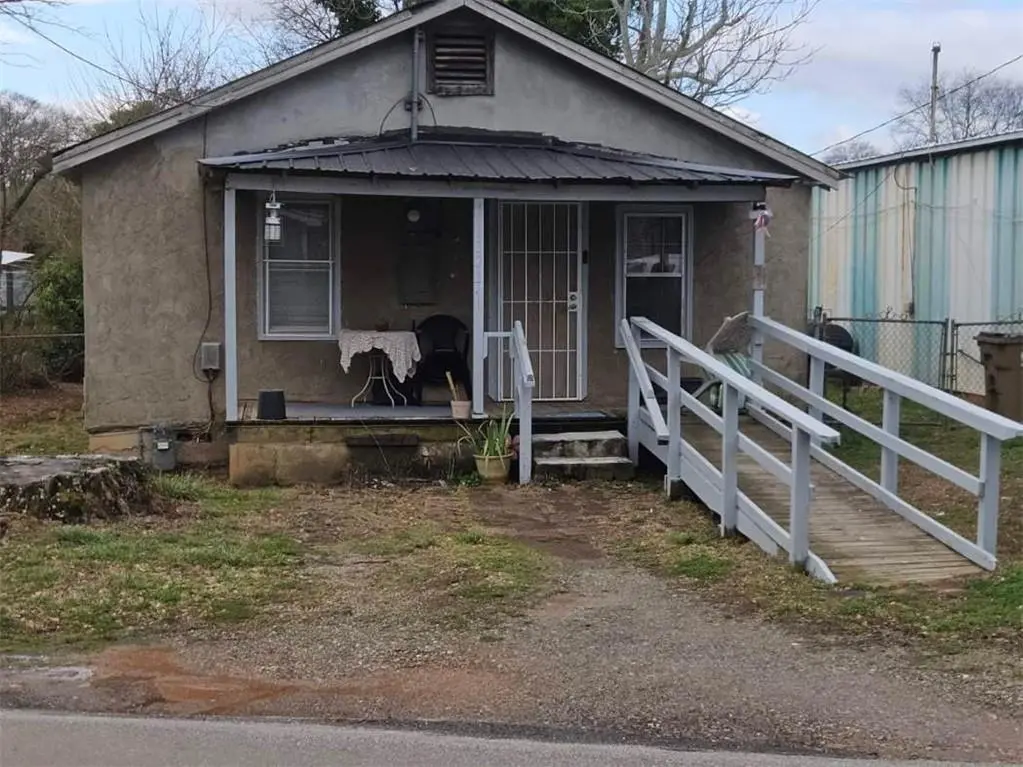
1322 Ralston St · Gainesville, GA
Flood risk No data
- FEMA flood zone
- —
- Chance of flooding over 30 yrs
- —
- Est. flood insurance / yr
- —
Fire risk No data
- Est. fire insurance / yr
- —
Heat risk No data
- Hot days now (above threshold)
- —
- Hot days in 30 yrs
- —
Wind risk No data
- Chance of severe wind over 30 yrs
- —
Air-quality risk No data
- Unhealthy air days now
- —
- Unhealthy air days in 30 yrs
- —
Risk factors via First Street. Map © Google.
Why this score? — see what drove the C grade
The composite is a weighted blend of 9 inputs, each scored 0–100. Each bar is that input's sub-score; the figure is the points it added to the 100-point composite (weight × sub-score).
- Cash flow +19.9/30.0
- ARV discount +15.0/15.0
- DSCR +6.3/10.0
- 1% rule +4.4/10.0
- Rent growth +3.6/5.0
- Livability +3.3/5.0
- Condition / age +2.5/5.0
- Schools +2.0/10.0
- Appreciation +0.0/10.0
$179,000
🖨 Deal sheet 📄 Offer letter ✓ Due diligence
Listing remarks MLS
Investor special with strong value-add potential in an established Gainesville location. This property offers renovation or rental opportunity with existing structure in place and off-street access. Level lot with public water and sewer already connected, providing added redevelopment or improvement flexibility. Conveniently located approximately 1.5 miles to Downtown Gainesville Square, about 2 miles to Northeast Georgia Medical Center, and within 3 miles of I-985 access and the Jesse Jewell Parkway retail and dining corridor. Proximity to major employment, medical, and commercial centers supports long-term rental demand.
Key facts
- Public sewer
- Off-street access
- Level lot
Tags
Neighborhood map
What this means for you Summary
Snapshot
- This is a 2-bed/1.0-bath single-family listed at $179k.
Deal economics
- At list price, monthly cash flow is $216 ($3k/yr) — positive.
- The deal already cash-flows at list — no discount required.
- To meet the 1% rule (rent ≥ 1% of price), the offer needs to be $167k (6.4% below list).
- Recommended offer: $167k (6.4% below list) — sets the bar for 1% rule.
- Cap rate 7.7% vs local median 2.7% in Gainesville — top-decile yield for the area; either an underpriced asset or a hidden risk that comps aren't pricing in. Stress-test before assuming the spread holds.
Location & tenants
- Location reads 66/100 on livability (#181 in GA) — a middle-class / working-renter tenant base. Strengths: housing A+, cost of living A-; Watch: amenities D+, schools F, crime F.
- Gainesville City (urban): math 23% / reading 25% proficiency, ranked #130 of 174 in GA (top 75%) — low school quality limits family demand, transient renter base, plan for 1-2y turnover; 71% free/reduced lunch — lower-income household profile, screen leases tightly.
- Market conditions: Rents rising fast (+4.5%/yr); 251 active listings in the ZIP; 12 comparable units currently listed for rent nearby; rentals leasing fast (median 13d on market — plan ~1-2 weeks tenant-placement turnaround); 2,274 units permitted in Hall County in 2024 (620 in 5+ unit buildings).
- This rent runs 31% of the median local income ($64k/yr) — at the standard rent-burdened threshold; future hikes will face affordability resistance.
Forward outlook
- Local home prices are declining (-3.0%/yr); year-one equity from $1k of loan paydown is wiped out by about $5k of value loss. Plan a longer hold.
- Hall County population projected at +30% by 2050 — long-run rental-demand tailwind backs the buy-and-hold thesis.
Negotiation context
- It's been on market 87 days — a 6% lower offer ($168k) is reasonable based on typical stale-listing flexibility.
- 2 sale attempts with the ask held roughly flat each time — persistent listings suggest the price (not the market) is what's stuck; bring a comps-based counter.
- Current owner paid $18k; list at $179k implies a 884% gain — meaningful room to come down on a strong offer.
Risks & watch-outs
- Watch-outs: built in 1945 — expect roof / HVAC / electrical / plumbing capex.
Questions for the listing agent
- It's been on market 87 days. Have you received any prior offers? Is the seller open to a 6% concession, seller financing, or rate buy-down credit?
- Built in 1945 — when were the roof, HVAC, electrical panel, plumbing, and water heater last replaced?
- Why hasn't it sold? Are there any deal-killer items the seller is aware of (foundation, flood, title, zoning, code violations)?
- Is there a deadline driving the sale (1031 exchange, divorce, estate, relocation)? That informs how much negotiation room exists.
- Schools are F-rated, which usually means shorter tenancies and higher turnover. Who's the typical renter profile here, and what's been the actual vacancy rate?
- Crime grade is F in this area — have there been break-ins, vandalism, or insurance claims at this property in the last 3 years? What carrier currently insures it and at what premium?
- What's the average days-on-market for RENTAL listings here right now (not sales)? A rising rental-DOM trend means longer vacancies and softer asking-rent achievability than the comps imply.
- What's the recent tenant-quality profile in this submarket — average credit score on applications, eviction rate, late-payment / NSF rate, and stable-employment percentage? A property-management company in the area should have these aggregated.
- How much new for-sale + rental construction is in the pipeline within 1–3 miles? Heavy new supply typically softens prices + rents 12–24 months out; constrained supply supports both.
Investment metrics
- 1% rule
- 0.94% ✗
- Cap rate
- 7.74%
- Cash-on-cash
- 5.17%
- DSCR
- 1.23
- GRM
- 8.9
CMA / ARV
- ARV (median comp)
- $239,481
- List price
- $179,000
- Delta
- -25.25%
- Verdict
- UNDERPRICED
- Comps
- 20 within 1.0 mi
Show comp detail 2 sales within ~0.75 mi
| Address | Dist | Beds/Ba | Sqft | Sold | Price | $/sf | Match |
|---|---|---|---|---|---|---|---|
| 1322 Ralston St | 0.00mi | 2/1.0 | 1,041 (0%) | 1mo | $100,000 | $96 | 99 |
| 1529 Browns Bridge Avenue Ave | 0.63mi | 2/1.0 | 1,104 (+6%) | 9mo | $262,000 | $237 | 53 |
Match score weights: distance 35% · size 25% · config 20% · recency 20%. Top-matched comps best support the ARV.
Projected returns pro-forma
-3.0% appreciation · 4.55% rent growth · sell at horizon
- IRR
- -6.7%
- Equity multiple
- 0.75×
- Total profit
- $-12,663
- Equity at exit
- $26,689
- IRR
- 4.5%
- Equity multiple
- 1.35×
- Total profit
- $17,684
- Equity at exit
- $15,477
Cash invested: $50,120 (down + closing). Projections, not guarantees.
Landlord ↔ Tenant lean methodology
- Overall (STATE)
- 90 Strongly Landlord-Friendly
- State Georgia
- 90 Strongly Landlord-Friendly · R+3
- County
- — inherits STATE
- City
- — inherits STATE
ZIP-level market 30501
- Rents YoY
- 4.5%
- Active inventory
- 251
- Price-to-rent
- 8.9×
Monthly cashflow live
- Estimated rent
- $1,675 high interval (Pro) →
- Mortgage (P&I)
- −$939
- Tax from tax record
- −$94 /mo · $1,127/yr
- Insurance
- −$75
- HOA
- −$0
- Vacancy / Maint / Mgmt
- −$352
- Net cashflow
- $216
Break-even live
UW: 25.0% down · 7.5% · 30yr · 1.5% tax · 5.0% vac · 8.0% maint · 8.0% mgmt
Financing live
Cash to close
- Down payment
- $44,750
- Closing costs
- $5,370
- Reserves months
- —
- Total cash needed
- —
Loan-product check · same deal, 3 products live
Conventional
25% down · 7.5% · 30yr
- Down + closing
- —
- Monthly P&I
- —
- Monthly cashflow
- —
- DSCR
- —
- Eligible?
- —
Personal DTI + credit; lowest rate.
DSCR
20% down · 8.5% · 30yr
- Down + closing
- —
- Monthly P&I
- —
- Monthly cashflow
- —
- DSCR
- —
- Eligible?
- —
No personal income docs; deal must DSCR.
Hard money
10% down · 12.0% · 12mo
- Down + closing
- —
- Monthly P&I
- —
- Monthly cashflow
- —
- DSCR
- —
- Eligible?
- —
Short-term bridge; refi at stabilization.
Rent comps 12 comps
| Address | Beds | Baths | Sqft | Rent | $/sqft | DOM | Units | Dist |
|---|---|---|---|---|---|---|---|---|
| 622 Shallowford Rd NW Gainesville, GA | 2.0–4.0 | 2.5 | 1859 | $1,950 | $1.05 | 13d | 85 | 0.47mi |
| 703 West Ave Gainesville, GA | 1.0–2.0 | 1.0 | 825 | $1,275 | $1.55 | 13d | 9 | 0.74mi |
| 915 Washington St SW Gainesville, GA | 2.0 | 2.0 | 1182 | $1,650 | $1.40 | 13d | 1 | 0.79mi |
| 915 Washington St NW Unit 917-15 Gainesville, GA | 2.0 | 2.0 | 1182 | $1,650 | $1.40 | 20d | 1 | 0.80mi |
| 2100 Saint Thomas Dr Gainesville, GA | 1.0–2.0 | 1.0–2.0 | 906 | $2,249 | $2.48 | 13d | 20 | 0.85mi |
| 700 Washington St NW Gainesville, GA | 1.0–2.0 | 1.0–2.0 | 812 | $1,644 | $2.02 | 13d | 6 | 0.95mi |
| 1000 Rea Dr SW Gainesville, GA | 2.0 | 1.0–2.0 | 938 | $1,995 | $2.13 | 13d | 13 | 1.01mi |
| 1000 Everly Way Gainesville, GA | 3.0 | 1.0–2.0 | 1007 | $2,013 | $2.00 | 13d | 15 | 1.14mi |
| 415 Adair St Gainesville, GA | 2.0 | 1.0–2.0 | 900 | $1,450 | $1.61 | 13d | 4 | 1.20mi |
| 114 Washington St SE Unit 302 Gainesville, GA | 1.0 | 1.0 | 800 | $1,200 | $1.50 | 43d | 1 | 1.22mi |
| 1100 Park Creek Ct Gainesville, GA | 1.0–3.0 | 1.0–2.0 | 971 | $1,548 | $1.59 | 13d | 26 | 1.32mi |
| 565 North Ave Apt 17 Gainesville, GA | 2.0 | 2.0 | 942 | $1,550 | $1.65 | 20d | 1 | 1.36mi |
Listing history 4 events
-
2026-05-19status Under Contract 634-char remark
Show marketing remark (634 chars)
Investor special with strong value-add potential in an established Gainesville location. This property offers renovation or rental opportunity with existing structure in place and off-street access. Level lot with public water and sewer already connected, providing added redevelopment or improvement flexibility. Conveniently located approximately 1.5 miles to Downtown Gainesville Square, about 2 miles to Northeast Georgia Medical Center, and within 3 miles of I-985 access and the Jesse Jewell Parkway retail and dining corridor. Proximity to major employment, medical, and commercial centers supports long-term rental demand.
-
2026-02-25$179,000 New 634-char remark
Show marketing remark (634 chars)
Investor special with strong value-add potential in an established Gainesville location. This property offers renovation or rental opportunity with existing structure in place and off-street access. Level lot with public water and sewer already connected, providing added redevelopment or improvement flexibility. Conveniently located approximately 1.5 miles to Downtown Gainesville Square, about 2 miles to Northeast Georgia Medical Center, and within 3 miles of I-985 access and the Jesse Jewell Parkway retail and dining corridor. Proximity to major employment, medical, and commercial centers supports long-term rental demand.
-
2026-02-25$179,000 Active 634-char remark
Show marketing remark (634 chars)
Investor special with strong value-add potential in an established Gainesville location. This property offers renovation or rental opportunity with existing structure in place and off-street access. Level lot with public water and sewer already connected, providing added redevelopment or improvement flexibility. Conveniently located approximately 1.5 miles to Downtown Gainesville Square, about 2 miles to Northeast Georgia Medical Center, and within 3 miles of I-985 access and the Jesse Jewell Parkway retail and dining corridor. Proximity to major employment, medical, and commercial centers supports long-term rental demand.
-
1993-02-15soldstatus $18,200
ⓘ Source: listings_history table (triggers on properties + properties_extension) + one-shot
backfill from property_details.listing_events for pre-trigger history.
Tax reassessment forecast GA · Resets to sale price
- Current annual tax
- $1,127 · $94/mo
- Projected year-2 tax
- $1,647 · $137/mo
- Expected delta
- +$520/yr (+$43/mo · 46.1%)
ⓘ Screening estimate from a state-policy table — verify with the county assessor before closing.
Nearby sold comps map
Loading sold comps map…
Walkable amenities ~0.75 mi
Loading nearby amenities…
Taxation est. · year 1
- Rental income
- $20,097
- − Mortgage interest
- −$10,027
- − Property taxes
- −$1,127
- − Insurance
- −$895
- − Repairs & maintenance
- −$1,608
- − Management
- −$1,608
- − Depreciation
- −$5,207
- Taxable loss
- −$375
- Est. tax savings @ 24.0%
- +$90
- After-tax cash flow
- $2,680/yr
For passive investors: Depreciation is non-cash, so a rental often shows a tax loss while cash-flowing — sheltering income. Rental losses are passive: they offset passive income freely, and up to $25,000/yr can offset ordinary (W-2) income if you actively participate and your MAGI is under $100k (phasing out to $0 by $150k); unused losses carry forward. On sale, claimed depreciation is recaptured at up to 25%, and gains may owe capital-gains tax (a 1031 exchange can defer both). Figures are a year-1 estimate at your 24.0% rate — not tax advice; consult a CPA.
Schools (NCES district)
- District
- Gainesville City
- NCES district ID
- 1302310
- Math proficiency
- 23% ▼ -7.00%
- Reading proficiency
- 25% ▼ -2.00%
- Median HH income
- $40,331
- Composite
- 20.3/100
- National rank
- #8614
- State rank
- #130 of 174 in GA
Livability — Gainesville
- Score
- 66/100
- State rank
- #181
- US rank
- #11362
Category grades
Schools grade is shown separately in the Schools card above.
Census & demographics
- Census place
- Gainesville, GA
- County
- Hall County · 188,353 people
- City population
- 140,301
- Metro
- Gainesville, GA
- Population (ZIP)
- 32,258
- Household income
- $64,175
- Rent vs Own
- Severe rent burden
- 2055.0
Population outlook (Hall County) Hauer SSP2
- Today (2025)
- 225,275 people
- By 2030
- 240,204 · +6.6%
- By 2040
- 268,440 · +19.2%
- By 2050
- 293,596 · +30.3%
- By 2075
- 350,293 · +55.5%
- By 2100
- 389,329 · +72.8%
Race, ethnicity, and origin ACS 2023
- Neighborhood character
- Diverse neighborhood (Simpson 0.66)
- Race & ethnicity
- White 42% Hispanic / Latino 39% Two or more races 18% Black 12% Asian 1% Native American 1%
- Hispanic origin (detail)
- Mexican 23%
- Common ancestry
- Slovak 2% Italian 1% Lithuanian 1%
- Foreign-born
- 21% · Canada
- Languages at home
- 62% English-only · Spanish 35% French/Haitian/Cajun 1%
Political lean MEDSL · Hall
- 2024 margin
- Solid R (+43.8) · D 27.8% · R 71.6%
- 2008→2024 swing
- +7.1pp toward D · 2008: -50.9pp · 2024: -43.8pp
- All cycles
- 2024: R+43.8 2020: R+43.2 2016: R+50.7 2012: R+56.4 2008: R+50.9
Not yet ingested
- Civics
- —
Market trends
- HPI YoY
- ▼ -212.22%
- Current HPI
- 286.1181
- Rent YoY
- ▲ 4.55%
- Metro
- Gainesville, GA
- State GDP YoY
- ▲ 2.66%
- F500 in state
- 28
Industry mix (Fortune 500 HQ in GA)
| Industry | F500 HQs | Revenue |
|---|---|---|
| Paper / Packaging | 2 | $29B |
|
||
| Retail | 1 | $160B |
|
||
| Transportation / Logistics | 1 | $91B |
|
||
| Airlines | 1 | $62B |
|
||
| Consumer Goods | 1 | $47B |
|
||
| Utilities | 1 | $25B |
|
||
Price history
+883.5% since first listed4 events — show timeline
- 2026-05-19 Pending — GAMLS
- 2026-02-25 Listed $179,000 FMLS
- 2026-02-25 Listed $179,000 GAMLS
- 1993-02-15 Sold (Public Records) $18,200 Public Records
Property tax history
+5.8%/yrLatest (2025): $1,127 · -3.1% YoY. Source: county tax records.
Cash-flow waterfall
monthlySold comps — $/sqft
last 12 mo · ≤1 miLoading sold comps…