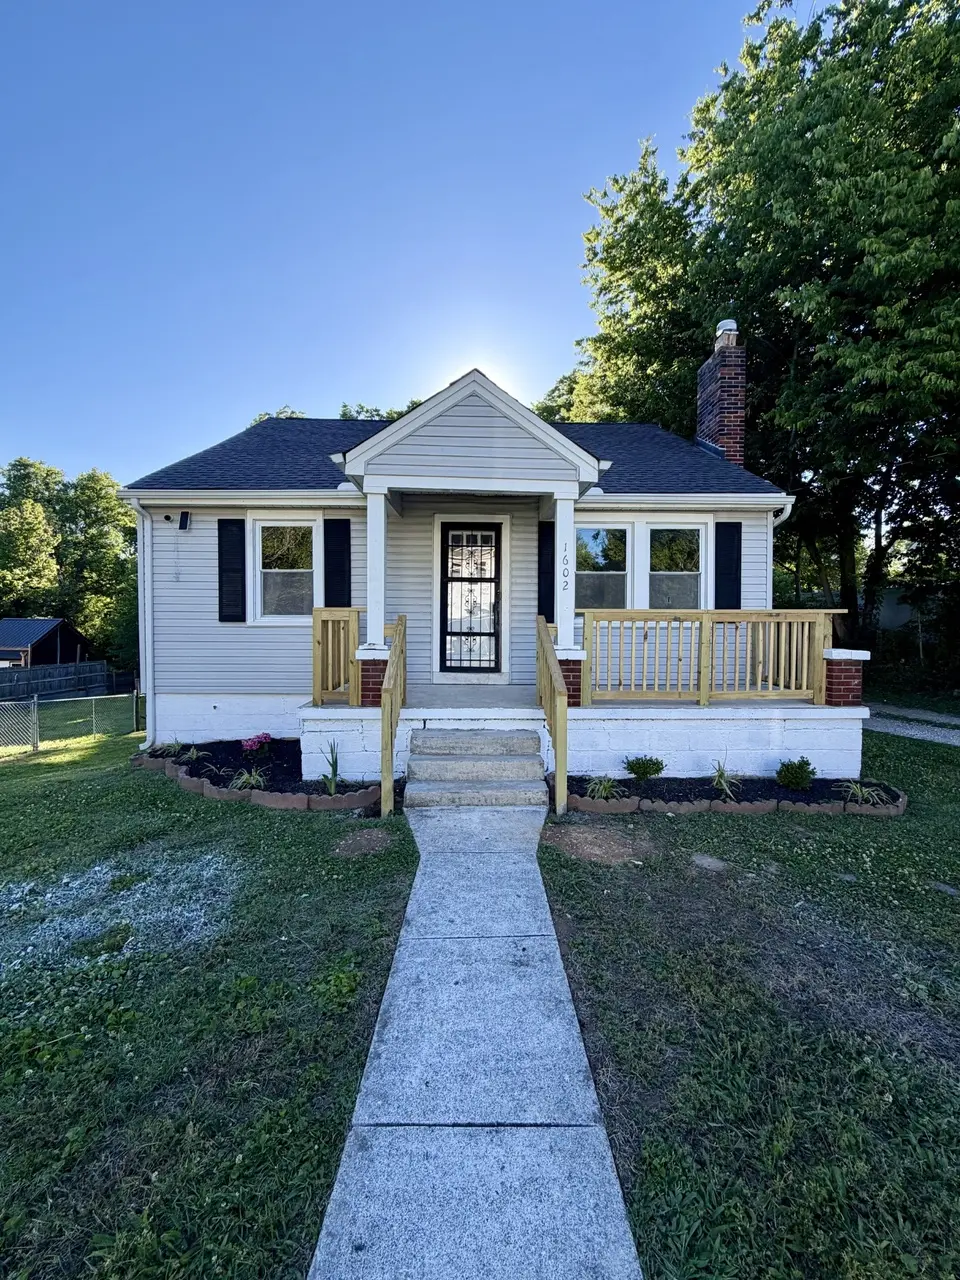
1602 Columbia Ave · Columbia, TN
Flood risk 1/10 · Minimal
- FEMA flood zone
- X (unshaded)
- Chance of flooding over 30 yrs
- 0.0%
- Est. flood insurance / yr
- $473 – $860
Fire risk 3/10 · Minor
- Est. fire insurance / yr
- $949 – $1,763
Heat risk 5/10 · Moderate
- Hot days now (above 106°F)
- 7 days/yr
- Hot days in 30 yrs
- 19 days/yr
Wind risk 4/10 · Minor
- Chance of severe wind over 30 yrs
- 14.0%
Air-quality risk 1/10 · Minimal
- Unhealthy air days now
- 0 days/yr
- Unhealthy air days in 30 yrs
- 0 days/yr
Risk factors via First Street. Map © Google.
Why this score? — see what drove the C- grade
The composite is a weighted blend of 9 inputs, each scored 0–100. Each bar is that input's sub-score; the figure is the points it added to the 100-point composite (weight × sub-score).
- Cash flow +16.1/30.0
- ARV discount +15.0/15.0
- DSCR +5.0/10.0
- Rent growth +3.7/5.0
- 1% rule +3.4/10.0
- Livability +3.2/5.0
- Condition / age +2.5/5.0
- Schools +1.8/10.0
- Appreciation +0.0/10.0
$214,900
🖨 Deal sheet (PDF) 📄 Offer letter ✓ Due diligence
Listing remarks
Cozy home in a great location less than 5 minutes to Columbia's Downtown Square. This 3 Bed / 1 Full Bath home has been freshly painted with new carpet and has a full unfinished basement. Sand and finish hardwood floors and tile throughout. Granite in bath and kitchen. ATMOS gas heat and water. Nice size lot. Roof and Gutters less than 4 years old and come with warranties. All new windows approximately 3 years old. Property being sold As-Is. Easy to show!
Key facts
- Tile throughout
- Granite in bath
- Granite in kitchen
Tags
Property features AI
Finance
- Other: Living area about 1,311 square feet; Lot size about 0.16 acres
Exterior
- Parking: No covered or designated parking spaces reported
- Utilities: Public water; Public sewer; Electricity available; Natural gas available
- Home design: Single-family residence; Two levels; Residential property
- Construction: Vinyl siding; Shingle roof; Existing (previously built)
- Exterior features: Level lot; Lot dimensions approximately 50 x 150
Interior
- Kitchen: Electric oven
- Bedrooms: 3 bedrooms (all on the main level)
- Flooring: Carpet; Wood; Tile
- Bathrooms: 1 full bathroom
- Heating & cooling: Central heating (natural gas); Central air conditioning (electric)
- Interior features: Built-in features; Ceiling fans
- Laundry & utility: Washer hookup; Electric dryer hookup; Unfinished basement
Neighborhood map
What this means for you Summary
Snapshot
- This is a 3-bed/1.0-bath single-family listed at $215k.
Deal economics
- At list price, monthly cash flow is $108 ($1k/yr) — positive.
- The deal already cash-flows at list — no discount required.
- To meet the 1% rule (rent ≥ 1% of price), the offer needs to be $181k (15.9% below list).
- Recommended offer: $181k (15.9% below list) — sets the bar for 1% rule.
- Cap rate 6.9% vs local median 2.8% in Columbia — top-decile yield for the area; either an underpriced asset or a hidden risk that comps aren't pricing in. Stress-test before assuming the spread holds.
Location & tenants
- Location reads 63/100 on livability (#207 in TN) — a middle-class / working-renter tenant base. Strengths: cost of living A+, housing A+; Watch: employment C-, health & safety C-, crime F.
- Maury County (town): math 19% / reading 21% proficiency, ranked #108 of 139 in TN (top 78%) — low school quality limits family demand, transient renter base, plan for 1-2y turnover.
- Zoned schools: Highland Park Elementary (math 22% / reading 17%, grade F, #654 of 952 statewide, top 72%, 291 students, 0% FRL); Whitthorne Middle School (math 8% / reading 12%, grade F, #257 of 333 statewide, top 78%, 932 students, 0% FRL); Columbia Central High School (math 7% / reading 27%, grade F, #225 of 332 statewide, top 69%, 1,474 students, 0% FRL) — zoned schools average 0% FRL vs 48% district-wide (48 pts lower); this property's tenant base skews higher-income than the district average.
- Market conditions: Rents rising fast (+5.0%/yr); 1129 active listings in the ZIP; 6 comparable units currently listed for rent nearby; rentals lingering (median 46d on market — plan ~5-8 weeks vacancy on turnover, expect pricing pressure); 50% of comp listings sitting > 30 days — soft ceiling on asking rent; 1,650 units permitted in Maury County in 2024 (60 in 5+ unit buildings).
- This rent runs 32% of the median local income ($68k/yr) — at the standard rent-burdened threshold; future hikes will face affordability resistance.
Forward outlook
- Local home prices are declining (-3.0%/yr); year-one equity from $1k of loan paydown is wiped out by about $6k of value loss. Plan a longer hold.
- Maury County population projected at +34% by 2050 — long-run rental-demand tailwind backs the buy-and-hold thesis.
Negotiation context
- It's been on market 34 days — a 3% lower offer ($208k) is reasonable based on typical stale-listing flexibility.
- 2 sale attempts with the ask held roughly flat each time — persistent listings suggest the price (not the market) is what's stuck; bring a comps-based counter.
- Current owner paid $32k; list at $215k implies a 572% gain — meaningful room to come down on a strong offer.
Risks & watch-outs
- Watch-outs: built in 1942 — expect roof / HVAC / electrical / plumbing capex.
- Climate carrying-cost: extreme-heat days projected 7→19/yr by 2055 (HVAC capex compounding) — expect insurance premiums to compound above CPI over the hold.
Questions for the listing agent
- It's been on market 34 days. Have you received any prior offers? Is the seller open to a 16% concession, seller financing, or rate buy-down credit?
- Built in 1942 — when were the roof, HVAC, electrical panel, plumbing, and water heater last replaced?
- Is there a deadline driving the sale (1031 exchange, divorce, estate, relocation)? That informs how much negotiation room exists.
- Schools are F-rated, which usually means shorter tenancies and higher turnover. Who's the typical renter profile here, and what's been the actual vacancy rate?
- Crime grade is F in this area — have there been break-ins, vandalism, or insurance claims at this property in the last 3 years? What carrier currently insures it and at what premium?
- What's the average days-on-market for RENTAL listings here right now (not sales)? A rising rental-DOM trend means longer vacancies and softer asking-rent achievability than the comps imply.
- What's the recent tenant-quality profile in this submarket — average credit score on applications, eviction rate, late-payment / NSF rate, and stable-employment percentage? A property-management company in the area should have these aggregated.
- How much new for-sale + rental construction is in the pipeline within 1–3 miles? Heavy new supply typically softens prices + rents 12–24 months out; constrained supply supports both.
Investment metrics
- 1% rule
- 0.84% ✗
- Cap rate
- 6.90%
- Cash-on-cash
- 2.16%
- DSCR
- 1.10
- GRM
- 9.9
CMA / ARV
- ARV (on-the-fly)
- $311,808
- Comps found
- 12
Show comp detail 12 sales within ~0.75 mi
| Address | Dist | Beds/Ba | Sqft | Sold | Price | $/sf | Match |
|---|---|---|---|---|---|---|---|
| 1119 High St S | 0.54mi | 3/2.5 | 1,827 (+2%) | 2mo | $640,000 | $350 | 63 |
| 1503 Carmack Blvd | 0.42mi | 3/2.5 | 1,716 (-4%) | 5mo | $290,000 | $169 | 63 |
| 403 W 13th St | 0.23mi | 2/2.0 (-1) | 1,600 (-11%) | 0mo | $236,500 | $148 | 62 |
| 2315 Highland Ave | 0.74mi | 3/1.5 | 1,800 (+0%) | 2mo | $239,900 | $133 | 61 |
| 1010 S High St | 0.66mi | 2/1.0 (-1) | 1,800 (+0%) | 4mo | $375,000 | $208 | 60 |
| 1210 School St | 0.40mi | 3/2.0 | 1,716 (-4%) | 20mo | $375,000 | $219 | 54 |
| 1504 Highland Ave | 0.23mi | 3/2.0 | 1,583 (-12%) | 20mo | $260,000 | $164 | 50 |
| 1111 School St | 0.52mi | 3/2.5 | 1,841 (+3%) | 20mo | $320,000 | $174 | 49 |
| 1912 Lynnwood Dr | 0.46mi | 3/2.0 | 1,599 (-11%) | 14mo | $250,000 | $156 | 45 |
| 1836 Dimple Ct | 0.31mi | 3/2.0 | 1,545 (-14%) | 16mo | $274,000 | $177 | 45 |
| 333 W 14th St | 0.15mi | 4/2.5 (+1) | 2,056 (+15%) | 17mo | $365,000 | $178 | 44 |
| 1024 Woodland St | 0.73mi | 3/2.0 | 2,054 (+15%) | 5mo | $105,000 | $51 | 33 |
Match score weights: distance 35% · size 25% · config 20% · recency 20%. Top-matched comps best support the ARV.
Projected returns pro-forma
-3.0% appreciation · 4.97% rent growth · sell at horizon
- IRR
- -10.9%
- Equity multiple
- 0.60×
- Total profit
- $-24,346
- Equity at exit
- $32,042
- IRR
- 0.7%
- Equity multiple
- 1.05×
- Total profit
- $2,985
- Equity at exit
- $18,581
Cash invested: $60,172 (down + closing). Projections, not guarantees.
Landlord ↔ Tenant lean methodology
- Overall (STATE)
- 87 Strongly Landlord-Friendly
- State Tennessee
- 87 Strongly Landlord-Friendly · R+13
- County
- — inherits STATE
- City
- — inherits STATE
ZIP-level market 38401
- Home prices YoY
- -22.7%
- Rents YoY
- 5.0%
- Active inventory
- 1129
- Price-to-rent
- 9.9×
Monthly cashflow live
- Estimated rent
- $1,807 high interval (Pro) →
- Mortgage (P&I)
- −$1,127
- Tax from tax record
- −$103 /mo · $1,236/yr
- Insurance
- −$90
- HOA
- −$0
- Vacancy / Maint / Mgmt
- −$380
- Net cashflow
- $108
Break-even live
Sensitivity live
| Price | -10% $230 | -5% $169 | +0% $108 | +5% $47 | +10% $-13 |
|---|---|---|---|---|---|
| Rent | -10% $-34 | -5% $37 | +0% $108 | +5% $180 | +10% $251 |
| Rate | -1.0pp $217 | -0.5pp $163 | base $108 | +0.5pp $53 | +1.0pp $-4 |
UW: 25.0% down · 7.5% · 30yr · 1.5% tax · 5.0% vac · 8.0% maint · 8.0% mgmt
Financing live
Cash to close
- Down payment
- $53,725
- Closing costs
- $6,447
- Reserves months
- —
- Total cash needed
- —
Loan-product check · same deal, 3 products live
Conventional
25% down · 7.5% · 30yr
- Down + closing
- —
- Monthly P&I
- —
- Monthly cashflow
- —
- DSCR
- —
- Eligible?
- —
Personal DTI + credit; lowest rate.
DSCR
20% down · 8.5% · 30yr
- Down + closing
- —
- Monthly P&I
- —
- Monthly cashflow
- —
- DSCR
- —
- Eligible?
- —
No personal income docs; deal must DSCR.
Hard money
10% down · 12.0% · 12mo
- Down + closing
- —
- Monthly P&I
- —
- Monthly cashflow
- —
- DSCR
- —
- Eligible?
- —
Short-term bridge; refi at stabilization.
Rent comps 6 comps
| Address | Beds | Baths | Sqft | Rent | $/sqft | DOM | Units | Dist |
|---|---|---|---|---|---|---|---|---|
| 319 W 14th St Columbia, TN | 2.0 | 1.0 | 1350 | $1,375 | $1.02 | 25d | 1 | 0.20mi |
| 329 E 18th St Columbia, TN | 3.0 | 3.0 | 1720 | $1,795 | $1.04 | 45d | 1 | 0.67mi |
| 107 E 9th St Unit D-7 Columbia, TN | 3.0 | 3.5 | 2060 | $2,550 | $1.24 | 19d | 1 | 0.84mi |
| 505 Washington St Columbia, TN | 3.0 | 2.0 | 1241 | $1,950 | $1.57 | 45d | 1 | 0.93mi |
| 915 Mapleash Ave Columbia, TN | 4.0 | 2.0 | 1308 | $1,995 | $1.53 | 45d | 1 | 1.12mi |
| 2411 Pulaski Hwy Columbia, TN | 1.0–3.0 | 1.0–2.0 | 1042 | $1,749 | $1.68 | 3d | 12 | 1.25mi |
Listing history 18 events
-
2026-06-21days on market $214,900 Active 34 DOM
-
2026-06-18days on market $214,900 Active 31 DOM
-
2026-06-17days on market $214,900 Active 30 DOM
-
2026-06-16days on market $214,900 Active 29 DOM
-
2026-06-15statusdays on market $214,900 Active 28 DOM
-
2026-06-09days on market $214,900 Active Under Contract 24 DOM
-
2026-06-08days on market $214,900 Active Under Contract 23 DOM
-
2026-06-07days on market $214,900 Active Under Contract 22 DOM
-
2026-06-03statusdays on market $214,900 Active Under Contract 18 DOM
-
2026-06-02days on market $214,900 Active 17 DOM
-
2026-06-01days on market $214,900 Active 16 DOM
-
2026-05-31days on market $214,900 Active 15 DOM
-
2026-05-16$214,900 Active
-
2026-04-15historical
-
2026-04-09price $174,900
-
2026-03-14$200,000 Active
-
2010-11-08soldstatus $32,000
-
2006-03-07soldstatus $40,000
ⓘ Source: listings_history table (triggers on properties + properties_extension) + one-shot
backfill from property_details.listing_events for pre-trigger history.
Tax reassessment forecast TN · Resets to sale price
- Current annual tax
- $1,236 · $103/mo
- Projected year-2 tax
- $1,526 · $127/mo
- Expected delta
- +$290/yr (+$24/mo · 23.4%)
ⓘ Screening estimate from a state-policy table — verify with the county assessor before closing.
Climate risk First Street
- Flood 1/10 Low FEMA zone X (unshaded) · 0% chance over 30 yrs
- Wildfire 3/10 Moderate
- Heat 5/10 Major 7 d/yr ≥106°F today · 19 d/yr by 30 yrs out
- Wind 4/10 Moderate 14% chance of damaging wind over 30 yrs
- Air quality 1/10 Low 0 unhealthy d/yr today · 0 by 30 yrs out
Nearby sold comps map
Loading sold comps map…
Walkable amenities ~0.75 mi
Loading nearby amenities…
Taxation est. · year 1
- Rental income
- $21,688
- − Mortgage interest
- −$12,038
- − Property taxes
- −$1,236
- − Insurance
- −$1,074
- − Repairs & maintenance
- −$1,735
- − Management
- −$1,735
- − Depreciation
- −$6,252
- Taxable loss
- −$2,382
- Est. tax savings @ 24.0%
- +$572
- After-tax cash flow
- $1,871/yr
For passive investors: Depreciation is non-cash, so a rental often shows a tax loss while cash-flowing — sheltering income. Rental losses are passive: they offset passive income freely, and up to $25,000/yr can offset ordinary (W-2) income if you actively participate and your MAGI is under $100k (phasing out to $0 by $150k); unused losses carry forward. On sale, claimed depreciation is recaptured at up to 25%, and gains may owe capital-gains tax (a 1031 exchange can defer both). Figures are a year-1 estimate at your 24.0% rate — not tax advice; consult a CPA.
Schools (NCES district)
- District
- Maury County
- NCES district ID
- 4702760
- Math proficiency
- 19% ▼ -5.00%
- Reading proficiency
- 21% ▼ -4.00%
- Median HH income
- $47,668
- Composite
- 17.69/100
- National rank
- #9024
- State rank
- #108 of 139 in TN
Livability — Columbia
- Score
- 63/100
- State rank
- #207
- US rank
- #16090
Category grades
Schools grade is shown separately in the Schools card above.
Census & demographics
- Census place
- Columbia, TN
- County
- Maury County · 121,382 people
- City population
- 67,482
- Metro
- Nashville-Davidson--Murfreesboro--Franklin, TN
- Population (ZIP)
- 67,482
- Household income
- $68,475
- Rent vs Own
- Severe rent burden
- 2026.0
Population outlook (Maury County) Hauer SSP2
- Today (2025)
- 102,894 people
- By 2030
- 110,269 · +7.2%
- By 2040
- 124,426 · +20.9%
- By 2050
- 137,543 · +33.7%
- By 2075
- 167,438 · +62.7%
- By 2100
- 184,489 · +79.3%
Race, ethnicity, and origin ACS 2023
- Neighborhood character
- Predominantly White (74%)
- Race & ethnicity
- White 74% Black 12% Hispanic / Latino 9% Two or more races 7%
- Hispanic origin (detail)
- Mexican 7%
- Common ancestry
- Slovak 1% Serbian 1% Romanian 1%
- Foreign-born
- 4% · Canada
- Languages at home
- 94% English-only · Spanish 5%
Political lean MEDSL · Maury
- 2024 margin
- Solid R (+44.6) · D 27.1% · R 71.8% · Other 1.1%
- 2008→2024 swing
- -6.2pp toward R · 2008: -38.4pp · 2024: -44.6pp
- All cycles
- 2024: R+44.6 2020: R+36.5 2016: R+39.2 2012: R+26.9 2008: R+38.4
Not yet ingested
- Civics
- —
Market trends
- HPI YoY
- ▼ -100.75%
- Current HPI
- 343.0362
- Rent YoY
- ▲ 4.97%
- Metro
- Nashville-Davidson--Murfreesboro--Franklin, TN
- State GDP YoY
- ▲ 2.78%
- F500 in state
- 22
Industry mix (Fortune 500 HQ in TN)
| Industry | F500 HQs | Revenue |
|---|---|---|
| Healthcare | 3 | $91B |
|
||
| Retail | 3 | $72B |
|
||
| Transportation / Logistics | 1 | $88B |
|
||
| Paper / Packaging | 1 | $19B |
|
||
| Insurance | 1 | $13B |
|
||
| Energy | 1 | $12B |
|
||
Price history
+437.2% since first listed6 events — show timeline
- 2026-05-16 Listed $214,900 REALTRACS as Distributed by MLS Grid
- 2026-04-15 Listing Removed — REALTRACS as Distributed by MLS Grid
- 2026-04-09 Price Changed $174,900 REALTRACS as Distributed by MLS Grid
- 2026-03-14 Listed $200,000 REALTRACS as Distributed by MLS Grid
- 2010-11-08 Sold (Public Records) $32,000 Public Records
- 2006-03-07 Sold (Public Records) $40,000 Public Records
Property tax history
+7.9%/yrLatest (2025): $1,236 · +0.0% YoY. Source: county tax records.
Cash-flow waterfall
monthlySold comps — $/sqft
last 12 mo · ≤1 miLoading sold comps…