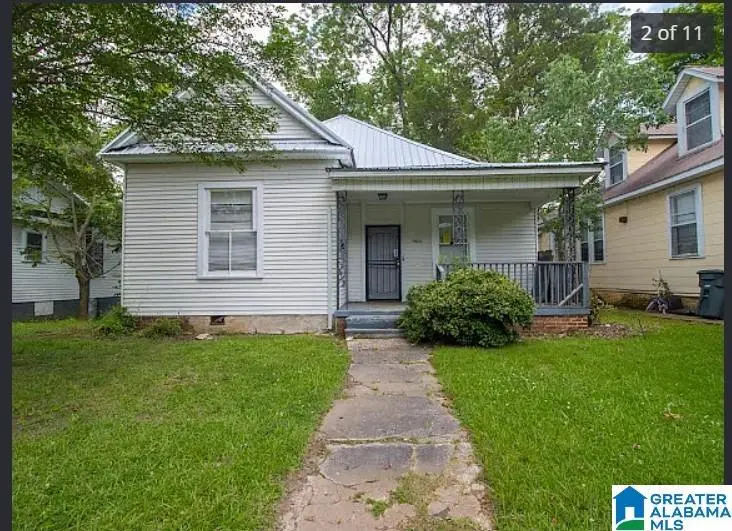
7524 2nd Ave S · Birmingham, AL
Flood risk 1/10 · Minimal
- FEMA flood zone
- X (unshaded)
- Chance of flooding over 30 yrs
- 0.0%
- Est. flood insurance / yr
- $507 – $1,088
Fire risk 3/10 · Minor
- Est. fire insurance / yr
- $916 – $1,700
Heat risk 6/10 · Moderate
- Hot days now (above 106°F)
- 7 days/yr
- Hot days in 30 yrs
- 19 days/yr
Wind risk 6/10 · Moderate
- Chance of severe wind over 30 yrs
- 27.0%
Air-quality risk 5/10 · Moderate
- Unhealthy air days now
- 7 days/yr
- Unhealthy air days in 30 yrs
- 9 days/yr
Risk factors via First Street. Map © Google.
Why this score? — see what drove the C- grade
The composite is a weighted blend of 9 inputs, each scored 0–100. Each bar is that input's sub-score; the figure is the points it added to the 100-point composite (weight × sub-score).
- Cash flow +19.9/30.0
- ARV discount +13.7/15.0
- DSCR +6.3/10.0
- 1% rule +5.3/10.0
- Livability +3.4/5.0
- Rent growth +3.0/5.0
- Condition / age +2.5/5.0
- Schools +0.9/10.0
- Appreciation +0.0/10.0
$115,000
🖨 Deal sheet 📄 Offer letter ✓ Due diligence
Listing remarks MLS
Renovated & Move-In Ready with Major Updates! This updated home offers space, functionality, and peace of mind with improvements throughout. Now featuring a new 4th bedroom and added closet space, this home provides flexibility for family, guests, or a home office. Enjoy a brand-new metal roof, updated electrical with grounded and GFI outlets, and plumbing serviced to meet Section 8 guidelines. Inside, you’ll find refreshed drywall, repaired woodwork, new ceiling tiles, and a bathroom upgrade with a new vanity, toilet, and refinished tub. Additional improvements include repaired windows, new locks, closet doors, smoke and carbon monoxide detectors, and full interior and exterior cleanup. Exterior updates include siding repairs, paint touch-ups, and trimmed trees for added curb appeal. Updated to meet Section 8 standards, this home offers value and livability. Seller owns multiple properties and is open to selling as a package deal 1254 Lewis St and 5301 Main St.
Key facts
- Updated electrical
- Added closet space
- Plumbing serviced
Tags
Neighborhood map
What this means for you Summary
Snapshot
- This is a 3-bed/1.0-bath single-family listed at $115k.
Deal economics
- At list price, monthly cash flow is $138 ($2k/yr) — positive.
- The deal already cash-flows at list — no discount required.
- Meets the 1% rule at list price ($1k rent vs $115k).
- Recommended offer: $105k (9.0% below list) — sets the bar for market timing.
- Cap rate 7.7% vs local median 6.2% in Birmingham — meaningfully above typical; check what's discounted (condition, days-on-market, listing class) to confirm the premium yield is real.
Location & tenants
- Location reads 67/100 on livability (#78 in AL) — a middle-class / working-renter tenant base. Strengths: commute A+, cost of living A+, housing A+; Watch: amenities C-, schools F, crime F.
- Birmingham City (urban): math 4% / reading 20% proficiency, ranked #116 of 129 in AL (top 90%) — low school quality limits family demand, transient renter base, plan for 1-2y turnover; 82% free/reduced lunch — lower-income household profile, screen leases tightly.
- Market conditions: Rents rising (+1.8%/yr); 128 active listings in the ZIP; 40 comparable units currently listed for rent nearby; rentals lingering (median 44d on market — plan ~5-8 weeks vacancy on turnover, expect pricing pressure); 52% of comp listings sitting > 30 days — soft ceiling on asking rent; lower-income renter base — watch delinquency; 2,114 units permitted in Jefferson County in 2024 (556 in 5+ unit buildings).
- This rent runs 33% of the median local income ($43k/yr) — at the standard rent-burdened threshold; future hikes will face affordability resistance.
Forward outlook
- Local home prices are declining (-3.0%/yr); year-one equity from $795 of loan paydown is wiped out by about $3k of value loss. Plan a longer hold.
- Jefferson County population projected to shrink 4% by 2050 — rents likely to lag national; underwrite the cash flow, not the appreciation.
Negotiation context
- It's been on market 91 days — a 9% lower offer ($105k) is reasonable based on typical stale-listing flexibility.
- 9 sale attempts since 12y ago with the ask held roughly flat each time — persistent listings suggest the price (not the market) is what's stuck; bring a comps-based counter.
- Current owner paid $79k; 46% above their basis — modest negotiation headroom, anchor on the comps not their cost.
Risks & watch-outs
- Watch-outs: built in 1920 — expect roof / HVAC / electrical / plumbing capex.
- Climate carrying-cost: major wind risk, 27% chance of damaging wind over 30y; extreme-heat days projected 7→19/yr by 2055 (HVAC capex compounding) — expect insurance premiums to compound above CPI over the hold.
Questions for the listing agent
- It's been on market 91 days. Have you received any prior offers? Is the seller open to a 9% concession, seller financing, or rate buy-down credit?
- Built in 1920 — when were the roof, HVAC, electrical panel, plumbing, and water heater last replaced?
- Why hasn't it sold? Are there any deal-killer items the seller is aware of (foundation, flood, title, zoning, code violations)?
- Is there a deadline driving the sale (1031 exchange, divorce, estate, relocation)? That informs how much negotiation room exists.
- Schools are F-rated, which usually means shorter tenancies and higher turnover. Who's the typical renter profile here, and what's been the actual vacancy rate?
- Crime grade is F in this area — have there been break-ins, vandalism, or insurance claims at this property in the last 3 years? What carrier currently insures it and at what premium?
- What's the average days-on-market for RENTAL listings here right now (not sales)? A rising rental-DOM trend means longer vacancies and softer asking-rent achievability than the comps imply.
- What's the recent tenant-quality profile in this submarket — average credit score on applications, eviction rate, late-payment / NSF rate, and stable-employment percentage? A property-management company in the area should have these aggregated.
- How much new for-sale + rental construction is in the pipeline within 1–3 miles? Heavy new supply typically softens prices + rents 12–24 months out; constrained supply supports both.
Investment metrics
- 1% rule
- 1.03% ✓
- Cap rate
- 7.73%
- Cash-on-cash
- 5.15%
- DSCR
- 1.23
- GRM
- 8.1
CMA / ARV
- ARV (median comp)
- $133,412
- List price
- $115,000
- Delta
- -13.80%
- Verdict
- UNDERPRICED
- Comps
- 20 within 1.0 mi
Show comp detail 12 sales within ~0.75 mi
| Address | Dist | Beds/Ba | Sqft | Sold | Price | $/sf | Match |
|---|---|---|---|---|---|---|---|
| 229 73rd St N | 0.47mi | 3/1.0 | 1,448 (-0%) | 3mo | $157,000 | $108 | 75 |
| 7506 1st Ave S | 0.09mi | 4/1.0 (+1) | 1,324 (-9%) | 1mo | $60,000 | $45 | 75 |
| 7836 Division Ave | 0.42mi | 3/2.0 | 1,462 (+0%) | 3mo | $154,000 | $105 | 73 |
| 7815 4th Ave S | 0.41mi | 3/2.0 | 1,496 (+3%) | 3mo | $74,000 | $49 | 70 |
| 7305 Division Ave | 0.26mi | 3/2.0 | 1,561 (+7%) | 3mo | $177,900 | $114 | 69 |
| 319 80th St N | 0.69mi | 3/1.0 | 1,456 (+0%) | 2mo | $65,000 | $45 | 66 |
| 713 77th Pl S | 0.52mi | 3/1.0 | 1,364 (-6%) | 2mo | $215,000 | $158 | 64 |
| 7729 Belmont Ave | 0.57mi | 3/1.0 | 1,606 (+10%) | 2mo | $122,000 | $76 | 54 |
| 7705 Belmont Ave | 0.59mi | 3/1.0 | 1,324 (-9%) | 5mo | $60,000 | $45 | 53 |
| 7923 4th Ave N | 0.66mi | 3/2.0 | 1,320 (-9%) | 1mo | $145,000 | $110 | 49 |
| 7212 Oporto Madrid Blvd | 0.66mi | 3/1.0 | 1,604 (+10%) | 4mo | $160,000 | $100 | 49 |
| 214 74th St N | 0.40mi | 3/3.0 | 1,648 (+13%) | 5mo | $179,900 | $109 | 47 |
Match score weights: distance 35% · size 25% · config 20% · recency 20%. Top-matched comps best support the ARV.
Projected returns pro-forma
-3.0% appreciation · 1.82% rent growth · sell at horizon
- IRR
- -9.6%
- Equity multiple
- 0.65×
- Total profit
- $-11,203
- Equity at exit
- $17,147
- IRR
- -1.9%
- Equity multiple
- 0.88×
- Total profit
- $-3,901
- Equity at exit
- $9,943
Cash invested: $32,200 (down + closing). Projections, not guarantees.
Landlord ↔ Tenant lean methodology
- Overall (STATE)
- 90 Strongly Landlord-Friendly
- State Alabama
- 90 Strongly Landlord-Friendly · R+15
- County
- — inherits STATE
- City
- — inherits STATE
ZIP-level market 35206
- Home prices YoY
- -32.0%
- Rents YoY
- 1.8%
- Active inventory
- 128
- Price-to-rent
- 8.1×
Monthly cashflow live
- Estimated rent
- $1,179 high interval (Pro) →
- Mortgage (P&I)
- −$603
- Tax from tax record
- −$142 /mo · $1,710/yr
- Insurance
- −$48
- HOA
- −$0
- Vacancy / Maint / Mgmt
- −$248
- Net cashflow
- $138
Break-even live
UW: 25.0% down · 7.5% · 30yr · 1.5% tax · 5.0% vac · 8.0% maint · 8.0% mgmt
Financing live
Cash to close
- Down payment
- $28,750
- Closing costs
- $3,450
- Reserves months
- —
- Total cash needed
- —
Loan-product check · same deal, 3 products live
Conventional
25% down · 7.5% · 30yr
- Down + closing
- —
- Monthly P&I
- —
- Monthly cashflow
- —
- DSCR
- —
- Eligible?
- —
Personal DTI + credit; lowest rate.
DSCR
20% down · 8.5% · 30yr
- Down + closing
- —
- Monthly P&I
- —
- Monthly cashflow
- —
- DSCR
- —
- Eligible?
- —
No personal income docs; deal must DSCR.
Hard money
10% down · 12.0% · 12mo
- Down + closing
- —
- Monthly P&I
- —
- Monthly cashflow
- —
- DSCR
- —
- Eligible?
- —
Short-term bridge; refi at stabilization.
Rent comps 40 comps
| Address | Beds | Baths | Sqft | Rent | $/sqft | DOM | Units | Dist |
|---|---|---|---|---|---|---|---|---|
| 7420 3rd Ave S Birmingham, AL | 4.0 | 2.0 | 1705 | $1,450 | $0.85 | 1d | 1 | 0.14mi |
| 7620 4th Ave S Birmingham, AL | 3.0 | 1.0 | 1144 | $1,025 | $0.90 | 43d | 1 | 0.16mi |
| 7721 1st Ave S Birmingham, AL | 3.0 | 1.0 | 956 | $949 | $0.99 | 23d | 1 | 0.19mi |
| 7330 1st Ave S Birmingham, AL | 3.0 | 1.0 | 1299 | $1,000 | $0.77 | 2d | 1 | 0.21mi |
| 7728 1st Ave S Apt C Birmingham, AL | 2.0 | 1.0 | 950 | $950 | $1.00 | 43d | 1 | 0.22mi |
| 7801 3rd Ave S Unit B Birmingham, AL | 2.0 | 1.5 | 1100 | $1,000 | $0.91 | 43d | 1 | 0.33mi |
| 7815 4th Ave S Birmingham, AL | 3.0 | 2.0 | 1496 | $1,650 | $1.10 | 1d | 1 | 0.39mi |
| 7829 3rd Ave S Birmingham, AL | 3.0 | 1.5 | 1005 | $1,025 | $1.02 | 43d | 1 | 0.39mi |
| 7129 3rd Ave S Birmingham, AL | 3.0 | 2.0 | 1264 | $1,095 | $0.87 | 3d | 1 | 0.40mi |
| 630 77th St S Birmingham, AL | 2.0 | 2.0 | 1100 | $983 | $0.89 | 3d | 1 | 0.44mi |
| 7125 6th Ave S Birmingham, AL | 3.0 | 2.0 | 1584 | $1,188 | $0.75 | 3d | 1 | 0.51mi |
| 7025 4th Ave S Birmingham, AL | 3.0 | 1.0 | 1090 | $845 | $0.78 | 43d | 1 | 0.53mi |
| 7017 Division Ave Birmingham, AL | 3.0 | 1.0 | 1100 | $1,050 | $0.95 | 43d | 1 | 0.53mi |
| 7005 2nd Ave S Birmingham, AL | 2.0 | 1.0 | 939 | $950 | $1.01 | 43d | 1 | 0.55mi |
| 605 71st St S Birmingham, AL | 3.0 | 1.5 | 1024 | $1,303 | $1.27 | 2d | 1 | 0.56mi |
| 201 70th St S Birmingham, AL | 2.0 | 1.0 | 989 | $950 | $0.96 | 43d | 1 | 0.57mi |
| 8021 1st Ave S Unit A Birmingham, AL | 3.0 | 1.0 | 980 | $950 | $0.97 | 23d | 1 | 0.57mi |
| 756 Vanderbilt St Birmingham, AL | 3.0 | 2.0 | 1096 | $1,000 | $0.91 | 43d | 1 | 0.61mi |
| 7823 Rugby Ave Birmingham, AL | 3.0 | 1.0 | 1023 | $1,175 | $1.15 | 43d | 1 | 0.63mi |
| 8035 4th Ave S Birmingham, AL | 3.0 | 2.0 | 1096 | $1,050 | $0.96 | 43d | 1 | 0.63mi |
| 7827 Rugby Ave Birmingham, AL | 3.0 | 1.0 | 1365 | $850 | $0.62 | 3d | 1 | 0.64mi |
| 7931 7th Ave S Birmingham, AL | 3.0 | 1.0 | 1320 | $1,450 | $1.10 | 43d | 1 | 0.65mi |
| 7824 Rugby Ct Birmingham, AL | 4.0 | 1.5 | 1650 | $1,275 | $0.77 | 43d | 1 | 0.67mi |
| 7825 Rugby Ct Birmingham, AL | 2.0 | 1.0 | 929 | $875 | $0.94 | 21d | 1 | 0.69mi |
| 512 81st St S Birmingham, AL | 3.0 | 1.0 | 1156 | $1,150 | $0.99 | 43d | 1 | 0.70mi |
| 7213 Naples Ave Birmingham, AL | 3.0 | 1.5 | 937 | $1,100 | $1.17 | 11d | 1 | 0.70mi |
| 7213 Naples Ave Birmingham, AL | 3.0 | 1.5 | 925 | $1,100 | $1.19 | 43d | 1 | 0.70mi |
| 805 Vanderbilt St Birmingham, AL | 4.0 | 2.0 | 1692 | $1,291 | $0.76 | 21d | 1 | 0.70mi |
| 514 81st St S Birmingham, AL | 4.0 | 2.0 | 1174 | $1,295 | $1.10 | 43d | 1 | 0.70mi |
| 8129 2nd Ave S Unit B Birmingham, AL | 2.0 | 1.0 | 900 | $800 | $0.89 | 43d | 1 | 0.71mi |
| 8108 4th Ave S Birmingham, AL | 3.0 | 2.0 | 1384 | $1,200 | $0.87 | 43d | 1 | 0.71mi |
| 7313 Paris Ave Birmingham, AL | 3.0 | 2.0 | 1000 | $1,395 | $1.40 | 3d | 1 | 0.71mi |
| 6820 Division Ave Birmingham, AL | 3.0 | 2.0 | 1122 | $1,050 | $0.94 | 23d | 1 | 0.72mi |
| 8128 2nd Ave S Birmingham, AL | 4.0 | 1.0 | 1390 | $1,150 | $0.83 | 23d | 1 | 0.72mi |
| 224 69th Pl N Birmingham, AL | 3.0 | 1.0 | 894 | $975 | $1.09 | 43d | 1 | 0.75mi |
| 8020 4th Ave N Birmingham, AL | 3.0 | 1.0 | 1200 | $1,200 | $1.00 | 43d | 1 | 0.76mi |
| 7216 Paris Ave Birmingham, AL | 3.0 | 1.5 | 966 | $1,125 | $1.16 | 19d | 1 | 0.77mi |
| 8149 1st Ave S Birmingham, AL | 3.0 | 2.0 | 1300 | $1,200 | $0.92 | 43d | 1 | 0.77mi |
| 836 Vanderbilt St Birmingham, AL | 3.0 | 1.0 | 1072 | $850 | $0.79 | 23d | 1 | 0.77mi |
| 8013 Rugby Ave Birmingham, AL | 3.0 | 2.0 | 1460 | $1,150 | $0.79 | 23d | 1 | 0.79mi |
Listing history 33 events
-
2026-06-18days on market $115,000 Active 91 DOM
-
2026-06-17days on market $115,000 Active 90 DOM
-
2026-06-16days on market $115,000 Active 89 DOM
-
2026-06-15days on market $115,000 Active 88 DOM
-
2026-06-13days on market $115,000 Active 86 DOM
-
2026-06-10days on market $115,000 Active 83 DOM
-
2026-06-09days on market $115,000 Active 82 DOM
-
2026-06-08days on market $115,000 Active 81 DOM
-
2026-06-07days on market $115,000 Active 80 DOM
-
2026-06-03days on market $115,000 Active 76 DOM
-
2026-06-02days on market $115,000 Active 75 DOM
-
2026-06-01days on market $115,000 Active 74 DOM
-
2026-05-31days on market $115,000 Active 73 DOM
-
2026-05-01historical $950
-
2026-03-17$115,000 Active 989-char remark
Show marketing remark (989 chars)
Renovated & Move-In Ready with Major Updates! This updated home offers space, functionality, and peace of mind with improvements throughout. Now featuring a new 4th bedroom and added closet space, this home provides flexibility for family, guests, or a home office. Enjoy a brand-new metal roof, updated electrical with grounded and GFI outlets, and plumbing serviced to meet Section 8 guidelines. Inside, you’ll find refreshed drywall, repaired woodwork, new ceiling tiles, and a bathroom upgrade with a new vanity, toilet, and refinished tub. Additional improvements include repaired windows, new locks, closet doors, smoke and carbon monoxide detectors, and full interior and exterior cleanup. Exterior updates include siding repairs, paint touch-ups, and trimmed trees for added curb appeal. Updated to meet Section 8 standards, this home offers value and livability. Seller owns multiple properties and is open to selling as a package deal 1254 Lewis St and 5301 Main St.
-
2026-02-26price $950
-
2026-02-03price $1,100
-
2025-12-31$1,150
-
2025-12-31historical $1,200
-
2025-10-23$1,200
-
2025-09-18historical $1,200
-
2025-07-10$1,200
-
2025-07-09historical $1,200
-
2025-07-02$1,200
-
2025-06-27historical $1,300
-
2025-06-21$1,300
-
2025-01-24soldstatus $79,000 Sold 120-char remark
Show marketing remark (120 chars)
Situated in Eastlake. Soaring ceilings. Lots of charm. With a little TLC this home will be gorgeous! No seller financing
-
2025-01-08historical Contingent 120-char remark
Show marketing remark (120 chars)
Situated in Eastlake. Soaring ceilings. Lots of charm. With a little TLC this home will be gorgeous! No seller financing
-
2024-12-05status Active 120-char remark
Show marketing remark (120 chars)
Situated in Eastlake. Soaring ceilings. Lots of charm. With a little TLC this home will be gorgeous! No seller financing
-
2024-11-09historical Contingent 120-char remark
Show marketing remark (120 chars)
Situated in Eastlake. Soaring ceilings. Lots of charm. With a little TLC this home will be gorgeous! No seller financing
-
2024-10-29$89,900 Active 120-char remark
Show marketing remark (120 chars)
Situated in Eastlake. Soaring ceilings. Lots of charm. With a little TLC this home will be gorgeous! No seller financing
-
2014-11-14soldstatus $11,000
-
2014-08-29$14,000
ⓘ Source: listings_history table (triggers on properties + properties_extension) + one-shot
backfill from property_details.listing_events for pre-trigger history.
Tax reassessment forecast AL · Resets to sale price
- Current annual tax
- $1,710 · $142/mo
- Projected year-2 tax
- $1,710 · $142/mo
- Expected delta
- $0/yr ($0/mo · 0.0%)
ⓘ Screening estimate from a state-policy table — verify with the county assessor before closing.
Climate risk First Street
- Flood 1/10 Low FEMA zone X (unshaded) · 0% chance over 30 yrs
- Wildfire 3/10 Moderate
- Heat 6/10 Major 7 d/yr ≥106°F today · 19 d/yr by 30 yrs out
- Wind 6/10 Major 27% chance of damaging wind over 30 yrs
- Air quality 5/10 Major 7 unhealthy d/yr today · 9 by 30 yrs out
Nearby sold comps map
Loading sold comps map…
Walkable amenities ~0.75 mi
Loading nearby amenities…
Taxation est. · year 1
- Rental income
- $14,151
- − Mortgage interest
- −$6,442
- − Property taxes
- −$1,710
- − Insurance
- −$575
- − Repairs & maintenance
- −$1,132
- − Management
- −$1,132
- − Depreciation
- −$3,345
- Taxable loss
- −$185
- Est. tax savings @ 24.0%
- +$44
- After-tax cash flow
- $1,702/yr
For passive investors: Depreciation is non-cash, so a rental often shows a tax loss while cash-flowing — sheltering income. Rental losses are passive: they offset passive income freely, and up to $25,000/yr can offset ordinary (W-2) income if you actively participate and your MAGI is under $100k (phasing out to $0 by $150k); unused losses carry forward. On sale, claimed depreciation is recaptured at up to 25%, and gains may owe capital-gains tax (a 1031 exchange can defer both). Figures are a year-1 estimate at your 24.0% rate — not tax advice; consult a CPA.
Schools (NCES district)
- District
- Birmingham City
- NCES district ID
- 0100390
- Math proficiency
- 4% ▼ -17.00%
- Reading proficiency
- 20% ▼ -4.00%
- Median HH income
- $31,988
- Composite
- 9.49/100
- National rank
- #9850
- State rank
- #116 of 129 in AL
Livability — Birmingham
- Score
- 67/100
- State rank
- #78
- US rank
- #10412
Category grades
Schools grade is shown separately in the Schools card above.
Census & demographics
- Census place
- Birmingham, AL
- County
- Jefferson County · 527,445 people
- City population
- 210,422
- Metro
- Birmingham-Hoover, AL
- Population (ZIP)
- 15,621
- Household income
- $42,549
- Rent vs Own
- Severe rent burden
- 1169.0
Population outlook (Jefferson County) Hauer SSP2
- Today (2025)
- 669,185 people
- By 2030
- 669,694 · +0.1%
- By 2040
- 661,388 · -1.2%
- By 2050
- 643,086 · -3.9%
- By 2075
- 577,267 · -13.7%
- By 2100
- 474,758 · -29.1%
Race, ethnicity, and origin ACS 2023
- Neighborhood character
- Predominantly Black (73%)
- Race & ethnicity
- Black 73% White 22% Two or more races 3% Hispanic / Latino 2%
- Common ancestry
- Slovak 1%
- Foreign-born
- 3% · Canada
- Languages at home
- 97% English-only · Spanish 2% Other Indo-European 0%
Political lean MEDSL · Jefferson
- 2024 margin
- D (+10.4) · D 54.6% · R 44.2% · Other 1.2%
- 2008→2024 swing
- +5.4pp toward D · 2008: 5.1pp · 2024: 10.4pp
- All cycles
- 2024: D+10.4 2020: D+13.2 2016: D+7.2 2012: D+6.0 2008: D+5.1
Not yet ingested
- Civics
- —
Market trends
- HPI YoY
- ▼ -68.70%
- Current HPI
- 146.2168
- Rent YoY
- ▲ 1.82%
- Metro
- Birmingham-Hoover, AL
- State GDP YoY
- ▲ 2.94%
- F500 in state
- 4
Industry mix (Fortune 500 HQ in AL)
| Industry | F500 HQs | Revenue |
|---|---|---|
| Financial Services | 1 | $8B |
|
||
| Healthcare | 1 | $5B |
|
||
Price history
+721.4% since first listed20 events — show timeline
- 2026-05-01 Rental Removed $950 BUILDIUM
- 2026-03-17 Listed $115,000 Greater Alabama MLS
- 2026-02-26 Price Changed $950 BUILDIUM
- 2026-02-03 Price Changed $1,100 BUILDIUM
- 2025-12-31 Listed for Rent $1,150 BUILDIUM
- 2025-12-31 Rental Removed $1,200 TENANTTURNER2
- 2025-10-23 Listed for Rent $1,200 TENANTTURNER2
- 2025-09-18 Rental Removed $1,200 BUILDIUM
- 2025-07-10 Listed for Rent $1,200 BUILDIUM
- 2025-07-09 Rental Removed $1,200 TENANTTURNER2
- 2025-07-02 Listed for Rent $1,200 TENANTTURNER2
- 2025-06-27 Rental Removed $1,300 TENANTTURNER2
- 2025-06-21 Listed for Rent $1,300 TENANTTURNER2
- 2025-01-24 Sold (MLS) $79,000 Greater Alabama MLS
- 2025-01-08 Contingent — Greater Alabama MLS
- 2024-12-05 Relisted — Greater Alabama MLS
- 2024-11-09 Contingent — Greater Alabama MLS
- 2024-10-29 Listed $89,900 Greater Alabama MLS
- 2014-11-14 Sold (MLS) $11,000 Greater Alabama MLS
- 2014-08-29 Listed $14,000 Greater Alabama MLS
Property tax history
+4.3%/yrLatest (2025): $1,710 · +0.8% YoY. Source: county tax records.
Cash-flow waterfall
monthlySold comps — $/sqft
last 12 mo · ≤1 miLoading sold comps…