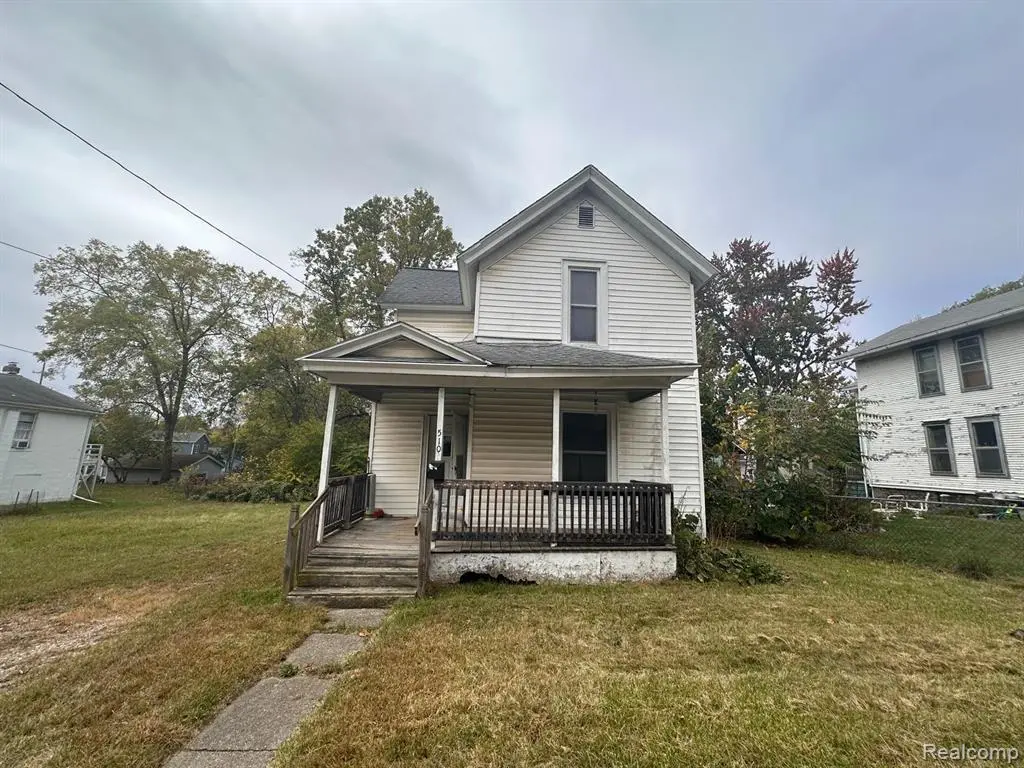
510 Harris St · Jackson, MI
Flood risk 1/10 · Minimal
- FEMA flood zone
- X (unshaded)
- Chance of flooding over 30 yrs
- 0.0%
- Est. flood insurance / yr
- $473 – $860
Fire risk 1/10 · Minimal
- Est. fire insurance / yr
- $784 – $1,456
Heat risk 3/10 · Minor
- Hot days now (above 98°F)
- 7 days/yr
- Hot days in 30 yrs
- 15 days/yr
Wind risk 2/10 · Minimal
- Chance of severe wind over 30 yrs
- —
Air-quality risk 2/10 · Minimal
- Unhealthy air days now
- 1 days/yr
- Unhealthy air days in 30 yrs
- 1 days/yr
Risk factors via First Street. Map © Google.
Why this score? — see what drove the D+ grade
The composite is a weighted blend of 9 inputs, each scored 0–100. Each bar is that input's sub-score; the figure is the points it added to the 100-point composite (weight × sub-score).
- Cash flow +15.0/30.0
- ARV discount +7.5/15.0
- 1% rule +5.0/10.0
- DSCR +5.0/10.0
- Rent growth +5.0/5.0
- Livability +3.7/5.0
- Condition / age +2.5/5.0
- Schools +1.8/10.0
- Appreciation +0.0/10.0
$30,000
🖨 Deal sheet 📄 Offer letter ✓ Due diligence
Listing remarks MLS
Investor special in Jackson city. This 3-bedroom, 1-bath Colonial-style 2-story offers 1,455 sq ft built in 1890 with original hardwood subfloors and tall ceilings. Electrical has been updated and passed city inspection. Furnace and central AC are operational. Property needs a full cosmetic renovation - kitchen, bath, drywall, flooring, and paint. Ready for the right investor to bring it back. Sold as-is. Do not walk the property without a confirmed showing appointment.
Key facts
- 4,792 sq ft lot
- Built 1890
- Listed 8 days
Property features AI
Exterior
- Parking: No garage
- Utilities: Public water; Public sewer
- Home design: Single family residence; Two levels; Ground-level entry with steps
- Construction: Aluminum siding; Block and stone foundation; Built prior to present (year not provided)
- Exterior features: Paved road access; Asphalt roof
Interior
- Bathrooms: 1 full bathroom
- Heating & cooling: Forced air heating (natural gas); No central cooling
- Interior features: Full, unfinished basement
Neighborhood map
What this means for you Summary
Snapshot
- This is a 3-bed/1.0-bath single-family listed at $30k.
Deal economics
- At list price, monthly cash flow is $792 ($10k/yr) — positive.
- The deal already cash-flows at list — no discount required.
- Meets the 1% rule at list price ($1k rent vs $30k).
- Cap rate 38.0% vs local median 5.4% in Jackson — top-decile yield for the area; either an underpriced asset or a hidden risk that comps aren't pricing in. Stress-test before assuming the spread holds.
Location & tenants
- Location reads 74/100 on livability (#197 in MI, #4,970 nationally) — a middle-class / working-renter tenant base. Strengths: cost of living A+, housing A+, health & safety A+; Watch: schools D, crime F, employment F.
- Jackson Public Schools (urban): math 15% / reading 28% proficiency, ranked #458 of 540 in MI (top 85%) — low school quality limits family demand, transient renter base, plan for 1-2y turnover; 63% free/reduced lunch — lower-income household profile, screen leases tightly.
- Market conditions: Rents rising fast (+10.3%/yr); 362 active listings in the ZIP; 4 comparable units currently listed for rent nearby; rentals lingering (median 44d on market — plan ~5-8 weeks vacancy on turnover, expect pricing pressure); 100% of comp listings sitting > 30 days — soft ceiling on asking rent; 317 units permitted in Jackson County in 2024 (103 in 5+ unit buildings).
Forward outlook
- Local home prices are declining (-3.0%/yr); year-one equity from $207 of loan paydown is wiped out by about $900 of value loss. Plan a longer hold.
- Jackson County population projected at -13% by 2050 — secular population decline; favor cash flow + early exit over multi-decade hold.
- At projected returns (-3.0% appreciation + 8.0% rent growth), your $8k cash investment doubles in ~1 year — after that, you're playing with house money.
Negotiation context
- Only 8 days on market — expect competitive offers; lowballing is unlikely to land.
- 8 sale attempts; this cycle's ask has dropped $8k (20%) from the opening price — seller is motivated, your offer sets the floor, not the list.
- Current owner paid $14k; list at $30k implies a 114% gain — meaningful room to come down on a strong offer.
Risks & watch-outs
- Watch-outs: built in 1890 — expect roof / HVAC / electrical / plumbing capex.
Questions for the listing agent
- Built in 1890 — when were the roof, HVAC, electrical panel, plumbing, and water heater last replaced?
- Is there a deadline driving the sale (1031 exchange, divorce, estate, relocation)? That informs how much negotiation room exists.
- Schools are D-rated, which usually means shorter tenancies and higher turnover. Who's the typical renter profile here, and what's been the actual vacancy rate?
- Crime grade is F in this area — have there been break-ins, vandalism, or insurance claims at this property in the last 3 years? What carrier currently insures it and at what premium?
- The area grade is low — what's the realistic commute time and amenity access for the typical tenant pool here? Any planned neighborhood developments (good or bad) we should know about?
- What's the average days-on-market for RENTAL listings here right now (not sales)? A rising rental-DOM trend means longer vacancies and softer asking-rent achievability than the comps imply.
- What's the recent tenant-quality profile in this submarket — average credit score on applications, eviction rate, late-payment / NSF rate, and stable-employment percentage? A property-management company in the area should have these aggregated.
- How much new for-sale + rental construction is in the pipeline within 1–3 miles? Heavy new supply typically softens prices + rents 12–24 months out; constrained supply supports both.
Investment metrics
- 1% rule
- 4.22% ✓
- Cap rate
- 37.98%
- Cash-on-cash
- 113.17%
- DSCR
- 6.04
- GRM
- 2.0
CMA / ARV
- ARV (on-the-fly)
- $113,490
- Comps found
- 12
Show comp detail 12 sales within ~0.75 mi
| Address | Dist | Beds/Ba | Sqft | Sold | Price | $/sf | Match |
|---|---|---|---|---|---|---|---|
| 510 Harris St | 0.00mi | 3/1.0 | 1,455 (0%) | 1mo | $25,000 | $17 | 99 |
| 827 Wells St | 0.26mi | 3/1.0 | 1,435 (-1%) | 5mo | $110,500 | $77 | 81 |
| 828 Maltby St | 0.24mi | 3/2.0 | 1,343 (-8%) | 7mo | $105,000 | $78 | 66 |
| 1308 Leroy St | 0.60mi | 4/1.0 (+1) | 1,450 (-0%) | 2mo | $185,000 | $128 | 65 |
| 409 Gilbert St | 0.65mi | 3/1.0 | 1,476 (+1%) | 4mo | $60,000 | $41 | 64 |
| 604 Edgewood St | 0.51mi | 4/1.5 (+1) | 1,435 (-1%) | 6mo | $135,000 | $94 | 62 |
| 613 Gilbert St | 0.70mi | 3/1.0 | 1,392 (-4%) | 3mo | $112,000 | $80 | 58 |
| 315 E Trail St | 0.19mi | 2/3.0 (-1) | 1,646 (+13%) | 3mo | $185,000 | $112 | 54 |
| 730 N Waterloo St | 0.38mi | 4/2.0 (+1) | 1,660 (+14%) | 4mo | $13,500 | $8 | 47 |
| 1025 Hamilton St | 0.59mi | 2/1.0 (-1) | 1,283 (-12%) | 3mo | $59,500 | $46 | 45 |
| 314 W Ganson St | 0.72mi | 3/1.0 | 1,592 (+9%) | 7mo | $118,000 | $74 | 45 |
| 839 N East Ave | 0.62mi | 4/2.0 (+1) | 1,304 (-10%) | 1mo | $206,000 | $158 | 44 |
Match score weights: distance 35% · size 25% · config 20% · recency 20%. Top-matched comps best support the ARV.
Projected returns pro-forma
-3.0% appreciation · 8.0% rent growth · sell at horizon
- IRR
- —
- Equity multiple
- 7.23×
- Total profit
- $52,300
- Equity at exit
- $4,473
- IRR
- —
- Equity multiple
- 17.79×
- Total profit
- $141,022
- Equity at exit
- $2,594
Cash invested: $8,400 (down + closing). Projections, not guarantees.
Landlord ↔ Tenant lean methodology
- Overall (STATE)
- 62 Landlord-Friendly
- State Michigan
- 62 Landlord-Friendly · EVEN
- County
- — inherits STATE
- City
- — inherits STATE
ZIP-level market 49201
- Rents YoY
- 10.3%
- Active inventory
- 362
- Price-to-rent
- 2.0×
Monthly cashflow live
- Estimated rent
- $1,265 medium interval (Pro) →
- Mortgage (P&I)
- −$157
- Tax est. 1.5%
- −$38 /mo · $450/yr
- Insurance
- −$12
- HOA
- −$0
- Vacancy / Maint / Mgmt
- −$266
- Net cashflow
- $792
Break-even live
UW: 25.0% down · 7.5% · 30yr · 1.5% tax · 5.0% vac · 8.0% maint · 8.0% mgmt
Financing live
Cash to close
- Down payment
- $7,500
- Closing costs
- $900
- Reserves months
- —
- Total cash needed
- —
Loan-product check · same deal, 3 products live
Conventional
25% down · 7.5% · 30yr
- Down + closing
- —
- Monthly P&I
- —
- Monthly cashflow
- —
- DSCR
- —
- Eligible?
- —
Personal DTI + credit; lowest rate.
DSCR
20% down · 8.5% · 30yr
- Down + closing
- —
- Monthly P&I
- —
- Monthly cashflow
- —
- DSCR
- —
- Eligible?
- —
No personal income docs; deal must DSCR.
Hard money
10% down · 12.0% · 12mo
- Down + closing
- —
- Monthly P&I
- —
- Monthly cashflow
- —
- DSCR
- —
- Eligible?
- —
Short-term bridge; refi at stabilization.
Rent comps 4 comps
| Address | Beds | Baths | Sqft | Rent | $/sqft | DOM | Units | Dist |
|---|---|---|---|---|---|---|---|---|
| 408 N Perrine St Jackson, MI | 3.0 | 1.0 | 990 | $1,350 | $1.36 | 43d | 1 | 0.06mi |
| 159 W Pearl St Unit 202 Jackson, MI | 2.0 | 1.0 | 1000 | $1,350 | $1.35 | 43d | 1 | 0.57mi |
| 720 W Michigan Ave Jackson, MI | 2.0 | 1.0 | 972 | $900 | $0.93 | 43d | 1 | 1.13mi |
| 653 Oakhill Ave Jackson, MI | 2.0 | 1.0 | 900 | $950 | $1.06 | 43d | 1 | 1.14mi |
Listing history 23 events
-
2026-05-01status Pending 476-char remark
Show marketing remark (476 chars)
Investor special in Jackson city. This 3-bedroom, 1-bath Colonial-style 2-story offers 1,455 sq ft built in 1890 with original hardwood subfloors and tall ceilings. Electrical has been updated and passed city inspection. Furnace and central AC are operational. Property needs a full cosmetic renovation - kitchen, bath, drywall, flooring, and paint. Ready for the right investor to bring it back. Sold as-is. Do not walk the property without a confirmed showing appointment.
-
2026-05-01status Pending
Show marketing remark (476 chars)
Investor special in Jackson city. This 3-bedroom, 1-bath Colonial-style 2-story offers 1,455 sq ft built in 1890 with original hardwood subfloors and tall ceilings. Electrical has been updated and passed city inspection. Furnace and central AC are operational. Property needs a full cosmetic renovation - kitchen, bath, drywall, flooring, and paint. Ready for the right investor to bring it back. Sold as-is. Do not walk the property without a confirmed showing appointment.
-
2026-04-30price $30,000 476-char remark
Show marketing remark (476 chars)
Investor special in Jackson city. This 3-bedroom, 1-bath Colonial-style 2-story offers 1,455 sq ft built in 1890 with original hardwood subfloors and tall ceilings. Electrical has been updated and passed city inspection. Furnace and central AC are operational. Property needs a full cosmetic renovation - kitchen, bath, drywall, flooring, and paint. Ready for the right investor to bring it back. Sold as-is. Do not walk the property without a confirmed showing appointment.
-
2026-04-30price $30,000
Show marketing remark (476 chars)
Investor special in Jackson city. This 3-bedroom, 1-bath Colonial-style 2-story offers 1,455 sq ft built in 1890 with original hardwood subfloors and tall ceilings. Electrical has been updated and passed city inspection. Furnace and central AC are operational. Property needs a full cosmetic renovation - kitchen, bath, drywall, flooring, and paint. Ready for the right investor to bring it back. Sold as-is. Do not walk the property without a confirmed showing appointment.
-
2026-04-23$37,500 Active
Show marketing remark (476 chars)
Investor special in Jackson city. This 3-bedroom, 1-bath Colonial-style 2-story offers 1,455 sq ft built in 1890 with original hardwood subfloors and tall ceilings. Electrical has been updated and passed city inspection. Furnace and central AC are operational. Property needs a full cosmetic renovation - kitchen, bath, drywall, flooring, and paint. Ready for the right investor to bring it back. Sold as-is. Do not walk the property without a confirmed showing appointment.
-
2026-04-23$37,500 Active 476-char remark
Show marketing remark (476 chars)
Investor special in Jackson city. This 3-bedroom, 1-bath Colonial-style 2-story offers 1,455 sq ft built in 1890 with original hardwood subfloors and tall ceilings. Electrical has been updated and passed city inspection. Furnace and central AC are operational. Property needs a full cosmetic renovation - kitchen, bath, drywall, flooring, and paint. Ready for the right investor to bring it back. Sold as-is. Do not walk the property without a confirmed showing appointment.
-
2025-12-24historical
-
2025-11-10status Active
-
2025-11-10status Active
-
2025-11-04status Pending
-
2025-11-04status Pending
-
2025-10-30$39,900 Active
-
2025-10-30$39,900 Active
-
2025-05-27historical
-
2025-04-15price $45,000
-
2025-04-15price $45,000
-
2025-04-15price $45,000
-
2025-03-14price $49,500
-
2025-03-14price $49,500
-
2025-03-14price $49,500
-
2025-03-04$65,000 Active
-
2025-03-03$65,000 Active
-
2024-12-23soldstatus $14,000
ⓘ Source: listings_history table (triggers on properties + properties_extension) + one-shot
backfill from property_details.listing_events for pre-trigger history.
Climate risk First Street
- Flood 1/10 Low FEMA zone X (unshaded) · 0% chance over 30 yrs
- Wildfire 1/10 Low
- Heat 3/10 Moderate 7 d/yr ≥98°F today · 15 d/yr by 30 yrs out
- Wind 2/10 Low
- Air quality 2/10 Low 1 unhealthy d/yr today · 1 by 30 yrs out
Nearby sold comps map
Loading sold comps map…
Walkable amenities ~0.75 mi
Loading nearby amenities…
Taxation est. · year 1
- Rental income
- $15,183
- − Mortgage interest
- −$1,680
- − Property taxes
- −$450
- − Insurance
- −$150
- − Repairs & maintenance
- −$1,215
- − Management
- −$1,215
- − Depreciation
- −$873
- Taxable income
- $9,600
- Est. tax owed @ 24.0%
- −$2,304
- After-tax cash flow
- $7,202/yr
For passive investors: Depreciation is non-cash, so a rental often shows a tax loss while cash-flowing — sheltering income. Rental losses are passive: they offset passive income freely, and up to $25,000/yr can offset ordinary (W-2) income if you actively participate and your MAGI is under $100k (phasing out to $0 by $150k); unused losses carry forward. On sale, claimed depreciation is recaptured at up to 25%, and gains may owe capital-gains tax (a 1031 exchange can defer both). Figures are a year-1 estimate at your 24.0% rate — not tax advice; consult a CPA.
Schools (NCES district)
- District
- Jackson Public Schools
- NCES district ID
- 2619620
- Math proficiency
- 15% ▼ -6.00%
- Reading proficiency
- 28% ▼ -3.00%
- Median HH income
- $38,344
- Composite
- 17.99/100
- National rank
- #8986
- State rank
- #458 of 540 in MI
Livability — Jackson
- Score
- 74/100
- State rank
- #197
- US rank
- #4970
Category grades
Schools grade is shown separately in the Schools card above.
Census & demographics
- Census place
- Jackson, MI
- County
- Jackson County · 85,581 people
- City population
- 85,581
- Metro
- Jackson, MI
- Population (ZIP)
- 49,107
- Household income
- $74,484
- Rent vs Own
- Severe rent burden
- 840.0
Population outlook (Jackson County) Hauer SSP2
- Today (2025)
- 156,365 people
- By 2030
- 153,123 · -2.1%
- By 2040
- 144,981 · -7.3%
- By 2050
- 135,671 · -13.2%
- By 2075
- 113,833 · -27.2%
- By 2100
- 86,592 · -44.6%
Race, ethnicity, and origin ACS 2023
- Neighborhood character
- Predominantly White (80%)
- Race & ethnicity
- White 80% Black 9% Two or more races 6% Hispanic / Latino 5%
- Hispanic origin (detail)
- Mexican 4%
- Common ancestry
- Romanian 7% Lithuanian 3% Slovak 2%
- Foreign-born
- 3% · Canada
- Languages at home
- 96% English-only · Spanish 2% Other Indo-European 1% Russian/Polish/Slavic 1%
Political lean MEDSL · Jackson
- 2024 margin
- Strong R (+21.3) · D 38.6% · R 59.9% · Other 1.5%
- 2008→2024 swing
- -23.7pp toward R · 2008: 2.4pp · 2024: -21.3pp
- All cycles
- 2024: R+21.3 2020: R+19.0 2016: R+20.1 2012: R+5.8 2008: D+2.4
Not yet ingested
- Civics
- —
Market trends
- HPI YoY
- ▼ -198.89%
- Current HPI
- 185.3773
- Rent YoY
- ▲ 10.32%
- Metro
- Jackson, MI
- State GDP YoY
- ▲ 1.37%
- F500 in state
- 28
Industry mix (Fortune 500 HQ in MI)
| Industry | F500 HQs | Revenue |
|---|---|---|
| Automotive Parts | 3 | $48B |
|
||
| Automotive | 2 | $372B |
|
||
| Chemicals | 1 | $45B |
|
||
| Automotive Retail | 1 | $29B |
|
||
| Healthcare / Medical Devices | 1 | $23B |
|
||
| Automotive Technology | 1 | $20B |
|
||
Price history
+114.3% since first listed23 events — show timeline
- 2026-05-01 Pending — MiRealSource-MiMLS
- 2026-05-01 Pending — REALCOMP
- 2026-04-30 Price Changed $30,000 MiRealSource-MiMLS
- 2026-04-30 Price Changed $30,000 REALCOMP
- 2026-04-23 Listed $37,500 REALCOMP
- 2026-04-23 Listed $37,500 MiRealSource-MiMLS
- 2025-12-24 Listing Removed — MiRealSource-MiMLS
- 2025-11-10 Relisted — MiRealSource-MiMLS
- 2025-11-10 Relisted — REALCOMP
- 2025-11-04 Pending — MiRealSource-MiMLS
- 2025-11-04 Pending — REALCOMP
- 2025-10-30 Listed $39,900 REALCOMP
- 2025-10-30 Listed $39,900 MiRealSource-MiMLS
- 2025-05-27 Listing Removed — MiRealSource-MiMLS
- 2025-04-15 Price Changed $45,000 MiRealSource-MiMLS
- 2025-04-15 Price Changed $45,000 REALCOMP
- 2025-04-15 Price Changed $45,000 SW Michigan MLS
- 2025-03-14 Price Changed $49,500 MiRealSource-MiMLS
- 2025-03-14 Price Changed $49,500 REALCOMP
- 2025-03-14 Price Changed $49,500 SW Michigan MLS
- 2025-03-04 Listed $65,000 REALCOMP
- 2025-03-03 Listed $65,000 MiRealSource-MiMLS
- 2024-12-23 Sold (Public Records) $14,000 Public Records
Property tax history
+16.6%/yrLatest (2025): $3,182 · +174.5% YoY. Source: county tax records.
Cash-flow waterfall
monthlySold comps — $/sqft
last 12 mo · ≤1 miLoading sold comps…