38 NE 575th St · Cross City, FL
Flood risk 1/10 · Minimal
- FEMA flood zone
- X (unshaded)
- Chance of flooding over 30 yrs
- 0.0%
- Est. flood insurance / yr
- $507 – $1,088
Fire risk 8/10 · Major
- Est. fire insurance / yr
- $947 – $1,759
Heat risk 8/10 · Major
- Hot days now (above 106°F)
- 7 days/yr
- Hot days in 30 yrs
- 20 days/yr
Wind risk 9/10 · Severe
- Chance of severe wind over 30 yrs
- 99.0%
Air-quality risk 3/10 · Minor
- Unhealthy air days now
- 3 days/yr
- Unhealthy air days in 30 yrs
- 4 days/yr
Risk factors via First Street. Map © Google.
Why this score? — see what drove the F grade
The composite is a weighted blend of 9 inputs, each scored 0–100. Each bar is that input's sub-score; the figure is the points it added to the 100-point composite (weight × sub-score).
- Appreciation +10.0/10.0
- Cash flow +7.0/30.0
- Schools +4.2/10.0
- Livability +3.5/5.0
- Rent growth +2.5/5.0
- Condition / age +2.5/5.0
- 1% rule +1.3/10.0
- DSCR +1.2/10.0
- ARV discount +0.0/15.0
$253,000
🖨 Deal sheet 📄 Offer letter ✓ Due diligence
Listing remarks
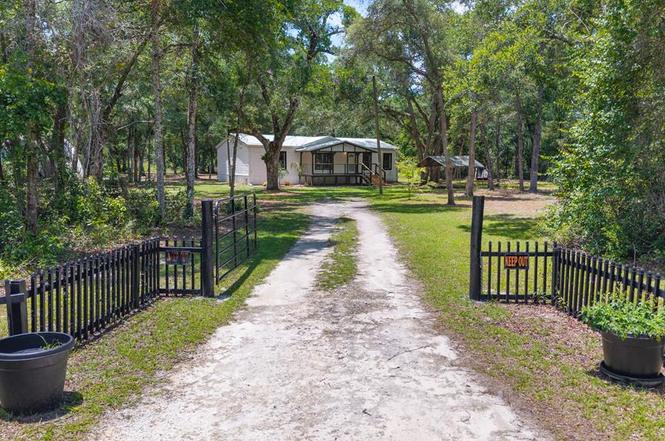
Welcome to 38 NE 575th Street in Old Town, Florida — a newly renovated mobile home nestled on over 4 acres of peaceful, private land. This move-in ready property features brand-new appliances, a modern tankless water heater, and an electric fireplace for cozy evenings. Step onto the spacious front porch and take in the quiet surroundings, perfect for relaxing or entertaining. Outside, you'll find a large metal shed ideal for storage, hobbies, or equipment. A new well ensures reliable water access, and the beautiful mix of cleared space and natural landscape offers endless possibilities for gardening, recreation, or even expansion. Whether you're looking for a homestead, weekend escape
Key facts
- New well
- Large metal shed
- Spacious front porch
Tags
Neighborhood map
What this means for you Summary
Snapshot
- This is a 3-bed/2.0-bath manufactured listed at $253k.
Deal economics
- At list price, monthly cash flow is $-376 ($-5k/yr) — negative.
- To cash-flow at today's rent, offer at most $187k (26.2% below list).
- To meet the 1% rule (rent ≥ 1% of price), the offer needs to be $158k (37.5% below list).
- Recommended offer: $158k (37.5% below list) — sets the bar for 1% rule.
Location & tenants
- Location reads 70/100 on livability (#412 in FL) — a middle-class / working-renter tenant base. Strengths: cost of living A+, housing A+, health & safety A+; Watch: amenities F, commute F, employment F.
- Dixie (rural): math 52% / reading 50% proficiency, ranked #36 of 73 in FL (top 49%) — acceptable for families but not a draw, mixed tenant base, ~2y average lease; 85% free/reduced lunch — lower-income household profile, screen leases tightly.
- Market conditions: 260 active listings in the ZIP; 49 units permitted in Dixie County in 2024 (0 in 5+ unit buildings).
Forward outlook
- In year one you build about $27k of equity ($2k loan paydown + $25k appreciation (10.0% local appreciation)).
- Dixie County population projected at -16% by 2050 — secular population decline; favor cash flow + early exit over multi-decade hold.
- By year 2, paydown + projected appreciation supports a ~$43k cash-out refi (75% LTV) — recoverable capital for the next deal without selling this one.
Negotiation context
- It's been on market 50 days — a 3% lower offer ($245k) is reasonable based on typical stale-listing flexibility.
- 3 sale attempts with the ask held roughly flat each time — persistent listings suggest the price (not the market) is what's stuck; bring a comps-based counter.
- Current owner paid $13k; list at $253k implies a 1877% gain — meaningful room to come down on a strong offer.
Risks & watch-outs
- Climate carrying-cost: severe wind risk, 99% chance of damaging wind over 30y; severe wildfire risk; extreme-heat days projected 7→20/yr by 2055 (HVAC capex compounding) — expect insurance premiums to compound above CPI over the hold.
Questions for the listing agent
- What do current leases actually rent for vs. the listed asking? Can we see a recent rent roll and the last 12 months of T-12 income?
- It's been on market 50 days. Have you received any prior offers? Is the seller open to a 37% concession, seller financing, or rate buy-down credit?
- Is there a deadline driving the sale (1031 exchange, divorce, estate, relocation)? That informs how much negotiation room exists.
- The area grade is low — what's the realistic commute time and amenity access for the typical tenant pool here? Any planned neighborhood developments (good or bad) we should know about?
- What's the average days-on-market for RENTAL listings here right now (not sales)? A rising rental-DOM trend means longer vacancies and softer asking-rent achievability than the comps imply.
- What's the recent tenant-quality profile in this submarket — average credit score on applications, eviction rate, late-payment / NSF rate, and stable-employment percentage? A property-management company in the area should have these aggregated.
- How much new for-sale + rental construction is in the pipeline within 1–3 miles? Heavy new supply typically softens prices + rents 12–24 months out; constrained supply supports both.
Investment metrics
- 1% rule
- 0.63% ✗
- Cap rate
- 4.51%
- Cash-on-cash
- -6.37%
- DSCR
- 0.72
- GRM
- 13.3
CMA / ARV
- ARV (on-the-fly)
- $196,248
- Comps found
- 3
Show comp detail 3 sales within ~0.75 mi
| Address | Dist | Beds/Ba | Sqft | Sold | Price | $/sf | Match |
|---|---|---|---|---|---|---|---|
| 528 NE 389 Ave | 0.22mi | 3/2.0 | 1,475 (+11%) | 1mo | $190,000 | $129 | 70 |
| 316 NE 576th St | 0.54mi | 3/2.0 | 1,248 (-6%) | 4mo | $235,500 | $189 | 62 |
| 120 NE 438th Ave | 0.47mi | 3/2.0 | 1,216 (-8%) | 6mo | $180,000 | $148 | 59 |
Match score weights: distance 35% · size 25% · config 20% · recency 20%. Top-matched comps best support the ARV.
Projected returns pro-forma
10.0% appreciation · 3.0% rent growth · sell at horizon
- IRR
- 19.8%
- Equity multiple
- 2.61×
- Total profit
- $113,801
- Equity at exit
- $227,922
- IRR
- 18.1%
- Equity multiple
- 6.00×
- Total profit
- $353,847
- Equity at exit
- $491,523
Cash invested: $70,840 (down + closing). Projections, not guarantees.
Landlord ↔ Tenant lean methodology
- Overall (STATE)
- 87 Strongly Landlord-Friendly
- State Florida
- 87 Strongly Landlord-Friendly · R+3
- County
- — inherits STATE
- City
- — inherits STATE
ZIP-level market 32680
- Home prices YoY
- 2.5%
- Active inventory
- 260
- Price-to-rent
- 13.3×
Monthly cashflow live
- Estimated rent
- $1,582 medium interval (Pro) →
- Mortgage (P&I)
- −$1,327
- Tax from tax record
- −$193 /mo · $2,318/yr
- Insurance
- −$105
- HOA
- −$0
- Vacancy / Maint / Mgmt
- −$332
- Net cashflow
- $-376
Break-even live
UW: 25.0% down · 7.5% · 30yr · 1.5% tax · 5.0% vac · 8.0% maint · 8.0% mgmt
Financing live
Cash to close
- Down payment
- $63,250
- Closing costs
- $7,590
- Reserves months
- —
- Total cash needed
- —
Loan-product check · same deal, 3 products live
Conventional
25% down · 7.5% · 30yr
- Down + closing
- —
- Monthly P&I
- —
- Monthly cashflow
- —
- DSCR
- —
- Eligible?
- —
Personal DTI + credit; lowest rate.
DSCR
20% down · 8.5% · 30yr
- Down + closing
- —
- Monthly P&I
- —
- Monthly cashflow
- —
- DSCR
- —
- Eligible?
- —
No personal income docs; deal must DSCR.
Hard money
10% down · 12.0% · 12mo
- Down + closing
- —
- Monthly P&I
- —
- Monthly cashflow
- —
- DSCR
- —
- Eligible?
- —
Short-term bridge; refi at stabilization.
Listing history 14 events
-
2026-06-18days on market $253,000 Active 50 DOM
-
2026-06-17days on market $253,000 Active 49 DOM
-
2026-06-16days on market $253,000 Active 48 DOM
-
2026-06-15days on market $253,000 Active 47 DOM
-
2026-06-13days on market $253,000 Active 45 DOM
-
2026-06-12days on market $253,000 Active 44 DOM
-
2026-06-09days on market $253,000 Active 41 DOM
-
2026-06-09status $253,000 Active 40 DOM
-
2026-04-14status Pending
-
2026-03-06$253,000 Active
-
2026-02-18status Active
-
2026-01-29status Pending
-
2025-06-29$253,000 Active
-
2003-09-15soldstatus $12,800
ⓘ Source: listings_history table (triggers on properties + properties_extension) + one-shot
backfill from property_details.listing_events for pre-trigger history.
Tax reassessment forecast FL · Resets to sale price
- Current annual tax
- $2,318 · $193/mo
- Projected year-2 tax
- $2,318 · $193/mo
- Expected delta
- $0/yr ($0/mo · 0.0%)
ⓘ Screening estimate from a state-policy table — verify with the county assessor before closing.
Climate risk First Street
- Flood 1/10 Low FEMA zone X (unshaded) · 0% chance over 30 yrs
- Wildfire 8/10 Severe
- Heat 8/10 Severe 7 d/yr ≥106°F today · 20 d/yr by 30 yrs out
- Wind 9/10 Extreme 99% chance of damaging wind over 30 yrs
- Air quality 3/10 Moderate 3 unhealthy d/yr today · 4 by 30 yrs out
Nearby sold comps map
Loading sold comps map…
Walkable amenities ~0.75 mi
Loading nearby amenities…
Taxation est. · year 1
- Rental income
- $18,979
- − Mortgage interest
- −$14,172
- − Property taxes
- −$2,318
- − Insurance
- −$1,265
- − Repairs & maintenance
- −$1,518
- − Management
- −$1,518
- − Depreciation
- −$7,360
- Taxable loss
- −$9,172
- Est. tax savings @ 24.0%
- +$2,201
- After-tax cash flow
- $-2,309/yr
For passive investors: Depreciation is non-cash, so a rental often shows a tax loss while cash-flowing — sheltering income. Rental losses are passive: they offset passive income freely, and up to $25,000/yr can offset ordinary (W-2) income if you actively participate and your MAGI is under $100k (phasing out to $0 by $150k); unused losses carry forward. On sale, claimed depreciation is recaptured at up to 25%, and gains may owe capital-gains tax (a 1031 exchange can defer both). Figures are a year-1 estimate at your 24.0% rate — not tax advice; consult a CPA.
Schools (NCES district)
- District
- Dixie
- NCES district ID
- 1200450
- Math proficiency
- 52% ▼ -3.00%
- Reading proficiency
- 50% ▼ -4.00%
- Median HH income
- $34,799
- Composite
- 42.18/100
- National rank
- #3290
- State rank
- #36 of 73 in FL
Livability — Cross City
- Score
- 70/100
- State rank
- #412
- US rank
- #7340
Category grades
Schools grade is shown separately in the Schools card above.
Census & demographics
- Population (ZIP)
- 10,445
Population outlook (Dixie County) Hauer SSP2
- Today (2025)
- 15,122 people
- By 2030
- 14,521 · -4.0%
- By 2040
- 13,503 · -10.7%
- By 2050
- 12,671 · -16.2%
- By 2075
- 10,857 · -28.2%
- By 2100
- 8,344 · -44.8%
Race, ethnicity, and origin ACS 2023
- Neighborhood character
- Predominantly White (94%)
- Race & ethnicity
- White 94% Two or more races 4% Hispanic / Latino 3% Black 1%
- Common ancestry
- Romanian 2% Slovak 1% Italian 1%
- Foreign-born
- 3% · Canada
- Languages at home
- 99% English-only · Spanish 1%
Political lean MEDSL · Dixie
- 2024 margin
- Solid R (+70.4) · D 14.5% · R 84.9%
- 2008→2024 swing
- -25.4pp toward R · 2008: -45.0pp · 2024: -70.4pp
- All cycles
- 2024: R+70.4 2020: R+66.0 2016: R+63.2 2012: R+46.9 2008: R+45.0
Not yet ingested
- Civics
- —
Market trends
- HPI YoY
- ▲ 10.22%
- Current HPI
- 424.0037
- Rent YoY
- —
- Metro
- —
- State GDP YoY
- ▲ 3.28%
- F500 in state
- 36
Industry mix (Fortune 500 HQ in FL)
| Industry | F500 HQs | Revenue |
|---|---|---|
| Industrial Technology | 2 | $29B |
|
||
| Insurance | 2 | $17B |
|
||
| Retail | 1 | $60B |
|
||
| Technology Distribution | 1 | $58B |
|
||
| Homebuilding | 1 | $35B |
|
||
| Technology Manufacturing | 1 | $35B |
|
||
Price history
+1876.6% since first listed6 events — show timeline
- 2026-04-14 Pending — DGLMLS
- 2026-03-06 Listed $253,000 DGLMLS
- 2026-02-18 Relisted — DGLMLS
- 2026-01-29 Pending — DGLMLS
- 2025-06-29 Listed $253,000 DGLMLS
- 2003-09-15 Sold (Public Records) $12,800 Public Records
Property tax history
+193.5%/yrLatest (2025): $2,318 · +193.5% YoY. Source: county tax records.
Cash-flow waterfall
monthlySold comps — $/sqft
last 12 mo · ≤1 miLoading sold comps…