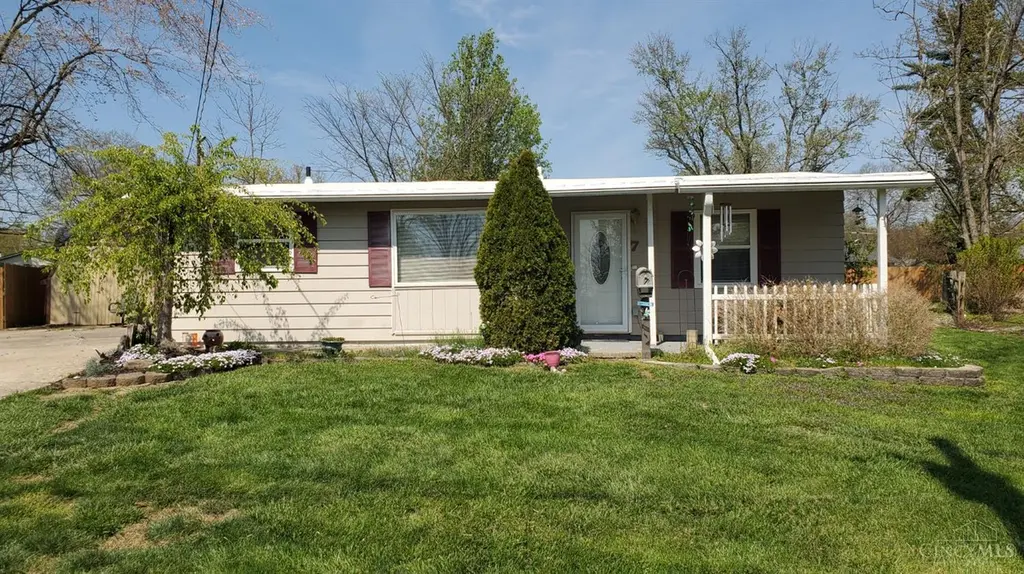
7 Apache Ct · Loveland, OH
Flood risk 1/10 · Minimal
- FEMA flood zone
- X (unshaded)
- Chance of flooding over 30 yrs
- 0.0%
- Est. flood insurance / yr
- $507 – $1,088
Fire risk 1/10 · Minimal
- Est. fire insurance / yr
- $713 – $1,323
Heat risk 4/10 · Minor
- Hot days now (above 101°F)
- 7 days/yr
- Hot days in 30 yrs
- 19 days/yr
Wind risk 2/10 · Minimal
- Chance of severe wind over 30 yrs
- 1.0%
Air-quality risk 4/10 · Minor
- Unhealthy air days now
- 5 days/yr
- Unhealthy air days in 30 yrs
- 7 days/yr
Risk factors via First Street. Map © Google.
Why this score? — see what drove the C- grade
The composite is a weighted blend of 9 inputs, each scored 0–100. Each bar is that input's sub-score; the figure is the points it added to the 100-point composite (weight × sub-score).
- Cash flow +15.6/30.0
- ARV discount +10.6/15.0
- Schools +6.9/10.0
- DSCR +4.8/10.0
- Livability +4.2/5.0
- 1% rule +3.8/10.0
- Rent growth +3.6/5.0
- Condition / age +2.5/5.0
- Appreciation +0.0/10.0
$259,000
🖨 Deal sheet 📄 Offer letter ✓ Due diligence
Listing remarks MLS
Come check out this charming cul-de sac ranch in the desirable Loveland Heights. Including over 1500 sq ft (per auditor), 3 bedrooms, 2 full baths, hardwood floors in family room - dining area, and closets galore throughout the home. Real masonry fireplace with wood stove insert ho help with those winter heating bills. The large addition provides a large living room and master bedroom unique compared to most homes in the neighborhood. With it's private generous sized, yard, shed, and carport its a rare find in this area. New rubber roof in 2025.
Key facts
- Large addition
- Cul-de sac ranch
- New rubber roof
Tags
Neighborhood map
What this means for you Summary
Snapshot
- This is a 3-bed/2.0-bath single-family listed at $259k.
Deal economics
- At list price, monthly cash flow is $108 ($1k/yr) — positive.
- The deal already cash-flows at list — no discount required.
- To meet the 1% rule (rent ≥ 1% of price), the offer needs to be $229k (11.5% below list).
- Recommended offer: $229k (11.5% below list) — sets the bar for 1% rule.
- Cap rate 6.8% vs local median 3.1% in Loveland — top-decile yield for the area; either an underpriced asset or a hidden risk that comps aren't pricing in. Stress-test before assuming the spread holds.
Location & tenants
- Location reads 84/100 on livability (#49 in OH, #696 nationally) — a professional / high-income tenant draw. Strengths: schools A+, crime A+, amenities A+; Watch: commute F.
- Loveland City (suburban): math 76% / reading 78% proficiency, ranked #50 of 656 in OH (top 8%) — strong family-tenant draw, lease renewals of 3-5y typical; only 12% free/reduced lunch — higher-income household profile.
- Market conditions: Rents rising fast (+4.4%/yr); 161 active listings in the ZIP; 8 comparable units currently listed for rent nearby; rentals at typical pace (median 24d on market — plan ~3-4 weeks tenant-placement turnaround); high-income renter base; 801 units permitted in Hamilton County in 2024 (190 in 5+ unit buildings).
Forward outlook
- Local home prices are declining (-3.0%/yr); year-one equity from $2k of loan paydown is wiped out by about $8k of value loss. Plan a longer hold.
Negotiation context
- Only 14 days on market — expect competitive offers; lowballing is unlikely to land.
- 3 sale attempts since 19y ago; this cycle's ask has dropped $21k (8%) from the opening price — seller is motivated, your offer sets the floor, not the list.
Risks & watch-outs
- Watch-outs: built in 1956 — expect roof / HVAC / electrical / plumbing capex.
Questions for the listing agent
- Built in 1956 — when were the roof, HVAC, electrical panel, plumbing, and water heater last replaced?
- Is there a deadline driving the sale (1031 exchange, divorce, estate, relocation)? That informs how much negotiation room exists.
- Schools are A-rated — typically a magnet for longer-tenancy family renters. What's the average tenant stay here, and is there a school-zone premium baked into asking?
- What's the average days-on-market for RENTAL listings here right now (not sales)? A rising rental-DOM trend means longer vacancies and softer asking-rent achievability than the comps imply.
- What's the recent tenant-quality profile in this submarket — average credit score on applications, eviction rate, late-payment / NSF rate, and stable-employment percentage? A property-management company in the area should have these aggregated.
- How much new for-sale + rental construction is in the pipeline within 1–3 miles? Heavy new supply typically softens prices + rents 12–24 months out; constrained supply supports both.
Investment metrics
- 1% rule
- 0.88% ✗
- Cap rate
- 6.79%
- Cash-on-cash
- 1.79%
- DSCR
- 1.08
- GRM
- 9.4
CMA / ARV
- ARV (median comp)
- $278,326
- List price
- $259,000
- Delta
- -3.35%
- Verdict
- FAIR
- Comps
- 20 within 1.0 mi
Show comp detail 12 sales within ~0.75 mi
| Address | Dist | Beds/Ba | Sqft | Sold | Price | $/sf | Match |
|---|---|---|---|---|---|---|---|
| 1525 W Loveland Ave | 0.17mi | 3/1.0 | 1,602 (+2%) | 10mo | $275,000 | $172 | 76 |
| 3 Apache Ct | 0.03mi | 3/1.0 | 1,357 (-13%) | 4mo | $257,500 | $190 | 69 |
| 4 Highridge Cir | 0.49mi | 3/1.5 | 1,540 (-2%) | 10mo | $309,995 | $201 | 64 |
| 22 Iroquois Dr | 0.42mi | 3/2.5 | 1,456 (-7%) | 6mo | $350,000 | $240 | 62 |
| 812 Debra Ln | 0.62mi | 3/1.5 | 1,567 (+0%) | 9mo | $345,000 | $220 | 62 |
| 20 Miamiview Dr | 0.56mi | 3/2.0 | 1,434 (-8%) | 8mo | $254,000 | $177 | 54 |
| 18 Miamiview Dr | 0.56mi | 3/2.0 | 1,392 (-11%) | 6mo | $270,000 | $194 | 50 |
| 1707 Stockton Dr | 0.63mi | 4/1.5 (+1) | 1,612 (+3%) | 12mo | $330,000 | $205 | 48 |
| 475 Pintail Dr | 0.57mi | 3/3.0 | 1,760 (+12%) | 1mo | $486,000 | $276 | 48 |
| 10057 Fox Chase Dr | 0.74mi | 3/2.5 | 1,655 (+6%) | 9mo | $370,000 | $224 | 46 |
| 19 Miamiview Dr | 0.59mi | 3/1.0 | 1,346 (-14%) | 0mo | $196,000 | $146 | 45 |
| 816 Sunrise Dr | 0.49mi | 3/1.0 | 1,338 (-14%) | 10mo | $250,000 | $187 | 41 |
Match score weights: distance 35% · size 25% · config 20% · recency 20%. Top-matched comps best support the ARV.
Projected returns pro-forma
-3.0% appreciation · 4.36% rent growth · sell at horizon
- IRR
- -12.0%
- Equity multiple
- 0.56×
- Total profit
- $-31,937
- Equity at exit
- $38,618
- IRR
- -1.1%
- Equity multiple
- 0.92×
- Total profit
- $-5,628
- Equity at exit
- $22,394
Cash invested: $72,520 (down + closing). Projections, not guarantees.
Landlord ↔ Tenant lean methodology
- Overall (STATE)
- 73 Landlord-Friendly
- State Ohio
- 73 Landlord-Friendly · R+6
- County
- — inherits STATE
- City
- — inherits STATE
ZIP-level market 45140
- Rents YoY
- 4.4%
- Active inventory
- 161
- Price-to-rent
- 9.4×
Monthly cashflow live
- Estimated rent
- $2,292 high interval (Pro) →
- Mortgage (P&I)
- −$1,358
- Tax from tax record
- −$236 /mo · $2,837/yr
- Insurance
- −$108
- HOA
- −$0
- Vacancy / Maint / Mgmt
- −$481
- Net cashflow
- $108
Break-even live
UW: 25.0% down · 7.5% · 30yr · 1.5% tax · 5.0% vac · 8.0% maint · 8.0% mgmt
Financing live
Cash to close
- Down payment
- $64,750
- Closing costs
- $7,770
- Reserves months
- —
- Total cash needed
- —
Loan-product check · same deal, 3 products live
Conventional
25% down · 7.5% · 30yr
- Down + closing
- —
- Monthly P&I
- —
- Monthly cashflow
- —
- DSCR
- —
- Eligible?
- —
Personal DTI + credit; lowest rate.
DSCR
20% down · 8.5% · 30yr
- Down + closing
- —
- Monthly P&I
- —
- Monthly cashflow
- —
- DSCR
- —
- Eligible?
- —
No personal income docs; deal must DSCR.
Hard money
10% down · 12.0% · 12mo
- Down + closing
- —
- Monthly P&I
- —
- Monthly cashflow
- —
- DSCR
- —
- Eligible?
- —
Short-term bridge; refi at stabilization.
Rent comps 8 comps
| Address | Beds | Baths | Sqft | Rent | $/sqft | DOM | Units | Dist |
|---|---|---|---|---|---|---|---|---|
| 204 Highland St Loveland, OH | 1.0–2.0 | 1.0 | 912 | $1,499 | $1.64 | 1d | 3 | 0.56mi |
| 1837 Vanderbilt Dr Loveland, OH | 4.0 | 2.5 | 1926 | $3,300 | $1.71 | 43d | 1 | 0.76mi |
| 1854 Lindenhall Dr Loveland, OH | 4.0 | 2.5 | 1928 | $2,525 | $1.31 | 23d | 1 | 0.87mi |
| 3030 Stratford Ct Loveland, OH | 2.0 | 2.5 | 1500 | $2,100 | $1.40 | 14d | 1 | 1.30mi |
| 3021 Stratford Ct Unit 1 Loveland, OH | 3.0 | 2.0 | 1550 | $2,125 | $1.37 | 23d | 1 | 1.31mi |
| 3029 Stratford Ct Loveland, OH | 3.0 | 2.0 | 1315 | $2,250 | $1.71 | 17d | 1 | 1.32mi |
| 2071 Stratford Ct Loveland, OH | 3.0 | 1.5 | 1120 | $1,895 | $1.69 | 43d | 1 | 1.38mi |
| 8713 Harper Point Dr Cincinnati, OH | 1.0–3.0 | 1.0–2.5 | 1050 | $2,596 | $2.47 | 1d | 19 | 1.41mi |
Listing history 21 events
-
2026-06-18days on market $259,000 Active 14 DOM
-
2026-06-17days on market $259,000 Active 13 DOM
-
2026-06-16days on market $259,000 Active 12 DOM
-
2026-06-15days on market $259,000 Active 11 DOM
-
2026-06-13days on market $259,000 Active 9 DOM
-
2026-06-13days on market $259,000 Active 8 DOM
-
2026-06-09days on market $259,000 Active 5 DOM
-
2026-06-08days on market $259,000 Active 4 DOM
-
2026-06-07days on market $259,000 Active 3 DOM
-
2026-06-05remarks 684-char remark
-
2026-06-05pricedays on market $259,000 Active 1 DOM
-
2026-06-03days on market $269,000 Active 52 DOM
-
2026-06-02days on market $269,000 Active 51 DOM
-
2026-06-01days on market $269,000 Active 50 DOM
-
2026-05-31days on market $269,000 Active 49 DOM
-
2026-04-25price $269,000 551-char remark
Show marketing remark (551 chars)
Come check out this charming cul-de sac ranch in the desirable Loveland Heights. Including over 1500 sq ft (per auditor), 3 bedrooms, 2 full baths, hardwood floors in family room - dining area, and closets galore throughout the home. Real masonry fireplace with wood stove insert ho help with those winter heating bills. The large addition provides a large living room and master bedroom unique compared to most homes in the neighborhood. With it's private generous sized, yard, shed, and carport its a rare find in this area. New rubber roof in 2025.
-
2026-04-11$280,000 Active 551-char remark
Show marketing remark (551 chars)
Come check out this charming cul-de sac ranch in the desirable Loveland Heights. Including over 1500 sq ft (per auditor), 3 bedrooms, 2 full baths, hardwood floors in family room - dining area, and closets galore throughout the home. Real masonry fireplace with wood stove insert ho help with those winter heating bills. The large addition provides a large living room and master bedroom unique compared to most homes in the neighborhood. With it's private generous sized, yard, shed, and carport its a rare find in this area. New rubber roof in 2025.
-
2008-02-08historical
-
2007-08-08$138,500
-
2007-08-07historical
-
2007-05-17$144,900
ⓘ Source: listings_history table (triggers on properties + properties_extension) + one-shot
backfill from property_details.listing_events for pre-trigger history.
Tax reassessment forecast OH · Partial reset (capped growth)
- Current annual tax
- $2,837 · $236/mo
- Projected year-2 tax
- $3,439 · $287/mo
- Expected delta
- +$602/yr (+$50/mo · 21.2%)
ⓘ Screening estimate from a state-policy table — verify with the county assessor before closing.
Climate risk First Street
- Flood 1/10 Low FEMA zone X (unshaded) · 0% chance over 30 yrs
- Wildfire 1/10 Low
- Heat 4/10 Moderate 7 d/yr ≥101°F today · 19 d/yr by 30 yrs out
- Wind 2/10 Low 100% chance of damaging wind over 30 yrs
- Air quality 4/10 Moderate 5 unhealthy d/yr today · 7 by 30 yrs out
Nearby sold comps map
Loading sold comps map…
Walkable amenities ~0.75 mi
Loading nearby amenities…
Taxation est. · year 1
- Rental income
- $27,501
- − Mortgage interest
- −$14,508
- − Property taxes
- −$2,837
- − Insurance
- −$1,295
- − Repairs & maintenance
- −$2,200
- − Management
- −$2,200
- − Depreciation
- −$7,535
- Taxable loss
- −$3,074
- Est. tax savings @ 24.0%
- +$738
- After-tax cash flow
- $2,033/yr
For passive investors: Depreciation is non-cash, so a rental often shows a tax loss while cash-flowing — sheltering income. Rental losses are passive: they offset passive income freely, and up to $25,000/yr can offset ordinary (W-2) income if you actively participate and your MAGI is under $100k (phasing out to $0 by $150k); unused losses carry forward. On sale, claimed depreciation is recaptured at up to 25%, and gains may owe capital-gains tax (a 1031 exchange can defer both). Figures are a year-1 estimate at your 24.0% rate — not tax advice; consult a CPA.
Schools (NCES district)
- District
- Loveland City
- NCES district ID
- 3904427
- Math proficiency
- 76% ▼ -8.00%
- Reading proficiency
- 78% ▼ -5.00%
- Median HH income
- $93,598
- Composite
- 69.34/100
- National rank
- #314
- State rank
- #50 of 656 in OH
Livability — Loveland
- Score
- 84/100
- State rank
- #49
- US rank
- #696
Category grades
Schools grade is shown separately in the Schools card above.
Census & demographics
- Census place
- Loveland, OH
- County
- Clermont County · 173,169 people
- City population
- 57,211
- Metro
- Cincinnati, OH-KY-IN
- Population (ZIP)
- 57,211
- Household income
- $114,827
- Rent vs Own
- Severe rent burden
- 928.0
Population outlook (Hamilton County) Hauer SSP2
- Today (2025)
- 826,054 people
- By 2030
- 830,947 · +0.6%
- By 2040
- 832,319 · +0.8%
- By 2050
- 822,428 · -0.4%
- By 2075
- 788,688 · -4.5%
- By 2100
- 710,674 · -14.0%
Race, ethnicity, and origin ACS 2023
- Neighborhood character
- Predominantly White (87%)
- Race & ethnicity
- White 87% Two or more races 5% Hispanic / Latino 4% Asian 4% Black 2%
- Common ancestry
- Slovak 3% Romanian 3% Italian 3%
- Foreign-born
- 6% · Canada, South Korea
- Languages at home
- 92% English-only · Other Asian/Pacific 2% Spanish 2% Russian/Polish/Slavic 1%
Political lean MEDSL · Hamilton
- 2024 margin
- D (+14.9) · D 57.0% · R 42.1%
- 2008→2024 swing
- +7.9pp toward D · 2008: 7.0pp · 2024: 14.9pp
- All cycles
- 2024: D+14.9 2020: D+15.9 2016: D+9.5 2012: D+4.9 2008: D+7.0
Not yet ingested
- Civics
- —
Market trends
- HPI YoY
- ▼ -240.61%
- Current HPI
- 243.9481
- Rent YoY
- ▲ 4.36%
- Metro
- Cincinnati, OH-KY-IN
- State GDP YoY
- ▲ 1.98%
- F500 in state
- 48
Industry mix (Fortune 500 HQ in OH)
| Industry | F500 HQs | Revenue |
|---|---|---|
| Insurance | 3 | $145B |
|
||
| Industrial Machinery | 3 | $49B |
|
||
| Financial Services | 3 | $24B |
|
||
| Consumer Goods | 2 | $93B |
|
||
| Aerospace / Defense | 2 | $47B |
|
||
| Utilities | 2 | $33B |
|
||
Price history
+85.6% since first listed6 events — show timeline
- 2026-04-25 Price Changed $269,000 Cincy MLS
- 2026-04-11 Listed $280,000 Cincy MLS
- 2008-02-08 Listing Removed — Cincy MLS
- 2007-08-08 Listed $138,500 Cincy MLS
- 2007-08-07 Listing Removed — Cincy MLS
- 2007-05-17 Listed $144,900 Cincy MLS
Property tax history
+4.0%/yrLatest (2025): $2,837 · +2.4% YoY. Source: county tax records.
Cash-flow waterfall
monthlySold comps — $/sqft
last 12 mo · ≤1 miLoading sold comps…