 🏷️ Likely Rental
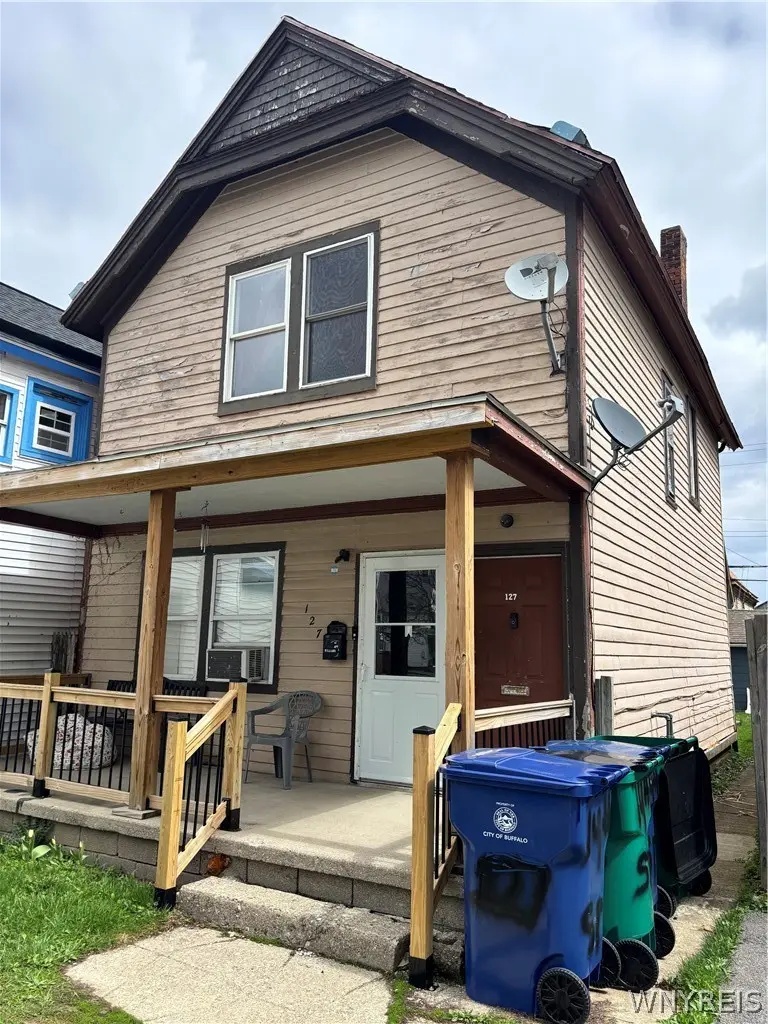
127 14th St · Buffalo, NY
Flood risk 1/10 · Minimal
- FEMA flood zone
- X (unshaded)
- Chance of flooding over 30 yrs
- 0.0%
- Est. flood insurance / yr
- $473 – $860
Fire risk 1/10 · Minimal
- Est. fire insurance / yr
- $691 – $1,283
Heat risk 3/10 · Minor
- Hot days now (above 91°F)
- 7 days/yr
- Hot days in 30 yrs
- 15 days/yr
Wind risk 1/10 · Minimal
- Chance of severe wind over 30 yrs
- —
Air-quality risk 4/10 · Minor
- Unhealthy air days now
- 4 days/yr
- Unhealthy air days in 30 yrs
- 9 days/yr
Risk factors via First Street. Map © Google.
Why this score? — see what drove the A grade
The composite is a weighted blend of 9 inputs, each scored 0–100. Each bar is that input's sub-score; the figure is the points it added to the 100-point composite (weight × sub-score).
- Cash flow +30.0/30.0
- ARV discount +15.0/15.0
- 1% rule +10.0/10.0
- DSCR +10.0/10.0
- Appreciation +8.8/10.0
- Livability +3.9/5.0
- Schools +3.3/10.0
- Condition / age +2.5/5.0
- Rent growth +2.4/5.0
$175,000
🖨 Deal sheet 📄 Offer letter ✓ Due diligence
Multi-family units
County records classify this as Multi-Family (2-4 Unit). Listing-text estimate: 2 units. confirmed
Listing remarks
Offers will be reviewed on Wednesday, 6/17 after 12 pm. Situated on the West Side, this 2 family is fully rented with long term tenants. The lower unit consists of living room, dining room, spacious eat-in kitchen with pantry, & 2 bedroom - recent flooring - has a forced air furnace. Upper unit consists of living room, formal dining room, eat-in kitchen & 2 bedrooms - recent space heater. Both units have access to back storage & basement. Photos have been altered to exclude some of the tenant's personal belongings.
Key facts
- Recent flooring
- Formal dining room
- Long term tenants
Tags
Property features AI
Finance
- Other: Owner pays trash collection and water; rent may include trash collection and water
- Financial info: Two total units (multi-family); Separate gas and electric meters for each unit; Operating expenses include rent and water/sewer
Exterior
- Parking: On-street parking
- Utilities: Public water connected; Sewer connected; Circuit breaker electrical service
- Home design: Two-story building; Existing property condition
- Construction: Wood siding; Asphalt roof; Stone foundation; Built previously (existing)
- Exterior features: Near public transit; Rectangular lot (approximately 25 x 100 feet)
Interior
- Flooring: Carpet; Linoleum; Tile; Vinyl; Varies
- Bathrooms: Two full bathrooms
- Heating & cooling: Gas heating; Forced air; Space heater
- Interior features: Partial basement; Carpet, linoleum, tile, vinyl and varying flooring throughout
- Laundry & utility: Gas water heater
Neighborhood map
What this means for you Summary
Snapshot
- This is a 2 × 2-bed/1.0-bath units multifamily listed at $175k.
Deal economics
- At list price, monthly cash flow is $1k ($17k/yr) — positive. Per door: $710/mo.
- The deal already cash-flows at list — no discount required.
- Meets the 1% rule at list price ($3k rent vs $175k).
- Cap rate 16.0% vs local median 8.0% in Buffalo — top-decile yield for the area; either an underpriced asset or a hidden risk that comps aren't pricing in. Stress-test before assuming the spread holds.
Location & tenants
- Location reads 77/100 on livability (#195 in NY, #3,011 nationally) — a middle-class / working-renter tenant base. Strengths: commute A+, housing A+, health & safety A+; Watch: crime F, employment D-.
- Buffalo City School District (urban): math 41% / reading 40% proficiency, ranked #535 of 590 in NY (top 91%) — families likely to look elsewhere, expect single-tenant / working-renter base with shorter leases; 75% free/reduced lunch — lower-income household profile, screen leases tightly.
- Market conditions: Rents soft (-0.5%/yr); 137 active listings in the ZIP; 13 comparable units currently listed for rent nearby; rentals at typical pace (median 24d on market — plan ~3-4 weeks tenant-placement turnaround); 1,244 units permitted in Erie County in 2024 (563 in 5+ unit buildings).
- At $3,150/mo this rent would consume 70% of the median local household income ($54k/yr) (locally 1501% of renters already pay >50% of income on rent) — very limited rent-growth headroom before tenants either downsize or default.
Forward outlook
- In year one you build about $14k of equity ($1k loan paydown + $13k appreciation (7.5% local appreciation)).
- At projected returns (7.5% appreciation + 0.0% rent growth), your $49k cash investment doubles in ~2 years — after that, you're playing with house money.
- By year 3, paydown + projected appreciation supports a ~$36k cash-out refi (75% LTV) — recoverable capital for the next deal without selling this one.
Negotiation context
- Only 9 days on market — expect competitive offers; lowballing is unlikely to land.
- 2 sale attempts since 7y ago with the ask held roughly flat each time — persistent listings suggest the price (not the market) is what's stuck; bring a comps-based counter.
- Current owner paid $22k; list at $175k implies a 678% gain — meaningful room to come down on a strong offer.
Risks & watch-outs
- Watch-outs: built in 1900 — expect roof / HVAC / electrical / plumbing capex.
Questions for the listing agent
- Can we see the unit-by-unit rent roll, current vacancy, and any below-market leases? What's the average tenancy length?
- What capital expenditures (roof, boiler, parking lot, exteriors) have been made in the last 5 years, and what's planned in the next 2?
- Built in 1900 — when were the roof, HVAC, electrical panel, plumbing, and water heater last replaced?
- Is there a deadline driving the sale (1031 exchange, divorce, estate, relocation)? That informs how much negotiation room exists.
- Crime grade is F in this area — have there been break-ins, vandalism, or insurance claims at this property in the last 3 years? What carrier currently insures it and at what premium?
- What's the average days-on-market for RENTAL listings here right now (not sales)? A rising rental-DOM trend means longer vacancies and softer asking-rent achievability than the comps imply.
- What's the recent tenant-quality profile in this submarket — average credit score on applications, eviction rate, late-payment / NSF rate, and stable-employment percentage? A property-management company in the area should have these aggregated.
- How much new apartment / multifamily construction is in the pipeline within 1–3 miles? Heavy new supply (>2% of stock underway) typically softens rents 12–24 months out; light construction supports rent growth.
Investment metrics
- 1% rule
- 1.80% ✓
- Cap rate
- 16.03%
- Cash-on-cash
- 34.76%
- DSCR
- 2.55
- GRM
- 4.6
CMA / ARV
- ARV (on-the-fly)
- $310,758
- Comps found
- 12
Show comp detail 12 sales within ~0.75 mi
| Address | Dist | Beds/Ba | Sqft | Sold | Price | $/sf | Match |
|---|---|---|---|---|---|---|---|
| 193 14th St | 0.13mi | 3/2.0 (-1) | 2,040 (-1%) | 6mo | $156,000 | $76 | 83 |
| 375 Plymouth Ave | 0.36mi | 4/2.0 | 2,121 (+3%) | 4mo | $265,000 | $125 | 74 |
| 192 York St | 0.14mi | 3/2.5 (-1) | 1,884 (-8%) | 1mo | $285,000 | $151 | 72 |
| 147 Mariner St | 0.44mi | 4/3.0 | 2,098 (+2%) | 4mo | $365,000 | $174 | 69 |
| 132 Ashland Ave | 0.40mi | 4/2.0 | 2,002 (-3%) | 12mo | $293,200 | $146 | 67 |
| 411 Summer St | 0.09mi | 4/2.0 | 2,308 (+12%) | 12mo | $357,500 | $155 | 66 |
| 651 Prospect Ave | 0.42mi | 5/2.0 (+1) | 2,026 (-2%) | 9mo | $278,500 | $137 | 65 |
| 291 West Ave | 0.29mi | 5/2.0 (+1) | 2,140 (+4%) | 12mo | $325,500 | $152 | 65 |
| 729 Prospect Ave | 0.52mi | 5/3.0 (+1) | 2,049 (-0%) | 12mo | $330,000 | $161 | 56 |
| 298 Massachusetts Ave | 0.55mi | 5/2.0 (+1) | 2,221 (+8%) | 1mo | $220,000 | $99 | 56 |
| 125 Whitney Pl | 0.74mi | 4/3.0 | 1,976 (-4%) | 6mo | $310,000 | $157 | 49 |
| 23 Sherwood St | 0.70mi | 3/2.0 (-1) | 1,830 (-11%) | 4mo | $150,000 | $82 | 41 |
Match score weights: distance 35% · size 25% · config 20% · recency 20%. Top-matched comps best support the ARV.
Projected returns pro-forma
7.51% appreciation · 0.0% rent growth · sell at horizon
- IRR
- 45.3%
- Equity multiple
- 4.02×
- Total profit
- $147,804
- Equity at exit
- $127,185
- IRR
- 39.8%
- Equity multiple
- 8.03×
- Total profit
- $344,634
- Equity at exit
- $247,151
Cash invested: $49,000 (down + closing). Projections, not guarantees.
Landlord ↔ Tenant lean methodology
- Overall (STATE)
- 15 Strongly Tenant-Friendly
- State New York
- 15 Strongly Tenant-Friendly · D+10
- County
- — inherits STATE
- City
- — inherits STATE
ZIP-level market 14213
- Home prices YoY
- 1.7%
- Rents YoY
- -0.5%
- Active inventory
- 137
- Price-to-rent
- 9.3×
Monthly cashflow live
- Estimated rent
- $3,150 high interval (Pro) →
- Mortgage (P&I)
- −$918
- Tax from tax record
- −$78 /mo · $941/yr
- Insurance
- −$73
- HOA
- −$0
- Vacancy / Maint / Mgmt
- −$662
- Net cashflow
- $1,419
Break-even live
2-unit breakdown (identical units grouped — click to expand)
| Units | Beds | Baths | Est. rent |
|---|---|---|---|
| 2× units | 2 | 1 | $3,150 |
| #1 | 2 | 1 | $1,575 |
| #2 | 2 | 1 | $1,575 |
| Total (2 units) | $3,150 | ||
UW: 25.0% down · 7.5% · 30yr · 1.5% tax · 5.0% vac · 8.0% maint · 8.0% mgmt
Financing live
Cash to close
- Down payment
- $43,750
- Closing costs
- $5,250
- Reserves months
- —
- Total cash needed
- —
Loan-product check · same deal, 3 products live
Conventional
25% down · 7.5% · 30yr
- Down + closing
- —
- Monthly P&I
- —
- Monthly cashflow
- —
- DSCR
- —
- Eligible?
- —
Personal DTI + credit; lowest rate.
DSCR
20% down · 8.5% · 30yr
- Down + closing
- —
- Monthly P&I
- —
- Monthly cashflow
- —
- DSCR
- —
- Eligible?
- —
No personal income docs; deal must DSCR.
Hard money
10% down · 12.0% · 12mo
- Down + closing
- —
- Monthly P&I
- —
- Monthly cashflow
- —
- DSCR
- —
- Eligible?
- —
Short-term bridge; refi at stabilization.
Rent comps 13 comps
| Address | Beds | Baths | Sqft | Rent | $/sqft | DOM | Units | Dist |
|---|---|---|---|---|---|---|---|---|
| 184 14th St Buffalo, NY | 4.0 | 2.0 | 1950 | $4,400 | $2.26 | 24d | 1 | 0.10mi |
| 124 Normal Ave Unit 2 Buffalo, NY | 3.0 | 1.0 | 1727 | $2,000 | $1.16 | 24d | 1 | 0.10mi |
| 161 16th St Buffalo, NY | 3.0 | 1.5 | 1500 | $2,000 | $1.33 | 24d | 1 | 0.25mi |
| 501 West Ave Buffalo, NY | 3.0 | 1.0 | 2552 | $1,850 | $0.72 | 20d | 1 | 0.29mi |
| 501 West Ave Buffalo, NY | 3.0 | 1.0 | 2552 | $1,700 | $0.67 | 14d | 1 | 0.29mi |
| 330 Bryant St Buffalo, NY | 3.0 | 2.0 | 2224 | $2,200 | $0.99 | 20d | 1 | 0.39mi |
| 550 Busti Ave Unit 2 Buffalo, NY | 3.0 | 1.0 | 1638 | $1,500 | $0.92 | 44d | 1 | 0.61mi |
| 405 W Ferry St Unit Lower Buffalo, NY | 3.0 | 1.0 | 2480 | $1,500 | $0.60 | 44d | 1 | 0.71mi |
| 11 Hoyt St Buffalo, NY | 4.0 | 1.0 | 2848 | $1,775 | $0.62 | 14d | 1 | 0.75mi |
| 83 Baynes St Unit Lower Buffalo, NY | 3.0 | 1.0 | 2550 | $1,850 | $0.73 | 14d | 1 | 0.88mi |
| 40 Putnam St Buffalo, NY | 4.0 | 1.0 | 1600 | $2,100 | $1.31 | 24d | 1 | 0.90mi |
| 740 Elmwood Ave Buffalo, NY | 3.0 | 1.0 | 2000 | $1,995 | $1.00 | 14d | 1 | 0.93mi |
| 836 Richmond Ave Buffalo, NY | 4.0 | 3.5 | 1982 | $4,500 | $2.27 | 44d | 1 | 1.47mi |
Listing history 8 events
-
2026-06-18days on market $175,000 Active 9 DOM
-
2026-06-17days on market $175,000 Active 8 DOM
-
2026-06-16days on market $175,000 Active 7 DOM
-
2026-06-15days on market $175,000 Active 6 DOM
-
2026-06-13days on market $175,000 Active 4 DOM
-
2026-06-13days on market $175,000 Active 3 DOM
-
2026-06-10remarks 525-char remark
-
2026-06-10$175,000 Active 1 DOM
ⓘ Source: listings_history table (triggers on properties + properties_extension) + one-shot
backfill from property_details.listing_events for pre-trigger history.
Tax reassessment forecast NY · Partial reset (capped growth)
- Current annual tax
- $941 · $78/mo
- Projected year-2 tax
- $1,949 · $162/mo
- Expected delta
- +$1,008/yr (+$84/mo · 107.1%)
ⓘ Screening estimate from a state-policy table — verify with the county assessor before closing.
Climate risk First Street
- Flood 1/10 Low FEMA zone X (unshaded) · 0% chance over 30 yrs
- Wildfire 1/10 Low
- Heat 3/10 Moderate 7 d/yr ≥91°F today · 15 d/yr by 30 yrs out
- Wind 1/10 Low
- Air quality 4/10 Moderate 4 unhealthy d/yr today · 9 by 30 yrs out
Nearby sold comps map
Loading sold comps map…
Walkable amenities ~0.75 mi
Loading nearby amenities…
Taxation est. · year 1
- Rental income
- $37,800
- − Mortgage interest
- −$9,803
- − Property taxes
- −$941
- − Insurance
- −$875
- − Repairs & maintenance
- −$3,024
- − Management
- −$3,024
- − Depreciation
- −$5,091
- Taxable income
- $15,042
- Est. tax owed @ 24.0%
- −$3,610
- After-tax cash flow
- $13,423/yr
For passive investors: Depreciation is non-cash, so a rental often shows a tax loss while cash-flowing — sheltering income. Rental losses are passive: they offset passive income freely, and up to $25,000/yr can offset ordinary (W-2) income if you actively participate and your MAGI is under $100k (phasing out to $0 by $150k); unused losses carry forward. On sale, claimed depreciation is recaptured at up to 25%, and gains may owe capital-gains tax (a 1031 exchange can defer both). Figures are a year-1 estimate at your 24.0% rate — not tax advice; consult a CPA.
Schools (NCES district)
- District
- Buffalo City School District
- NCES district ID
- 3605850
- Math proficiency
- 41% ▲ 11.00%
- Reading proficiency
- 40% ▲ 7.00%
- Median HH income
- $31,665
- Composite
- 33.17/100
- National rank
- #5544
- State rank
- #535 of 590 in NY
Livability — Buffalo
- Score
- 77/100
- State rank
- #195
- US rank
- #3011
Category grades
Schools grade is shown separately in the Schools card above.
Census & demographics
- Census place
- Buffalo, NY
- County
- Erie County · 714,559 people
- City population
- 440,021
- Metro
- Buffalo-Cheektowaga, NY
- Population (ZIP)
- 24,107
- Household income
- $53,870
- Rent vs Own
- Severe rent burden
- 1501.0
Population outlook (Erie County) Hauer SSP2
- Today (2025)
- 933,037 people
- By 2030
- 935,181 · +0.2%
- By 2040
- 928,531 · -0.5%
- By 2050
- 905,725 · -2.9%
- By 2075
- 834,037 · -10.6%
- By 2100
- 708,033 · -24.1%
Race, ethnicity, and origin ACS 2023
- Neighborhood character
- Highly diverse neighborhood (Simpson 0.70)
- Race & ethnicity
- White 46% Hispanic / Latino 20% Black 18% Asian 12% Two or more races 10%
- Hispanic origin (detail)
- Mexican 1% Puerto Rican 16% Dominican 1%
- Common ancestry
- Romanian 6% Slovak 3% Lithuanian 3%
- Foreign-born
- 16% · Philippines, Canada, India
- Languages at home
- 68% English-only · Spanish 12% Other Asian/Pacific 7% Arabic 3%
Political lean MEDSL · Erie
- 2024 margin
- Lean D (+9.7) · D 54.8% · R 45.2%
- 2008→2024 swing
- -7.9pp toward R · 2008: 17.5pp · 2024: 9.7pp
- All cycles
- 2024: D+9.7 2020: D+14.7 2016: D+4.8 2012: D+15.6 2008: D+17.5
Not yet ingested
- Civics
- —
Market trends
- HPI YoY
- ▲ 7.51%
- Current HPI
- 448.4879
- Rent YoY
- ▼ -0.49%
- Metro
- Buffalo-Cheektowaga, NY
- State GDP YoY
- ▲ 2.60%
- F500 in state
- 92
Industry mix (Fortune 500 HQ in NY)
| Industry | F500 HQs | Revenue |
|---|---|---|
| Financial Services | 10 | $950B |
|
||
| Consumer Goods | 9 | $162B |
|
||
| Insurance | 4 | $225B |
|
||
| Telecommunications | 2 | $144B |
|
||
| Pharmaceuticals | 2 | $112B |
|
||
| Media / Entertainment | 2 | $69B |
|
||
Price history
+929.4% since first listed5 events — show timeline
- 2026-06-08 Listed $175,000 WNYREIS
- 2020-01-31 Listing Removed — WNYREIS
- 2019-07-31 Listed $125,000 WNYREIS
- 2012-01-31 Sold (Public Records) $22,500 Public Records
- 2007-10-03 Sold (Public Records) $17,000 Public Records
Property tax history
+21.7%/yrLatest (2025): $941 · -1.2% YoY. Source: county tax records.
Cash-flow waterfall
monthlySold comps — $/sqft
last 12 mo · ≤1 miLoading sold comps…