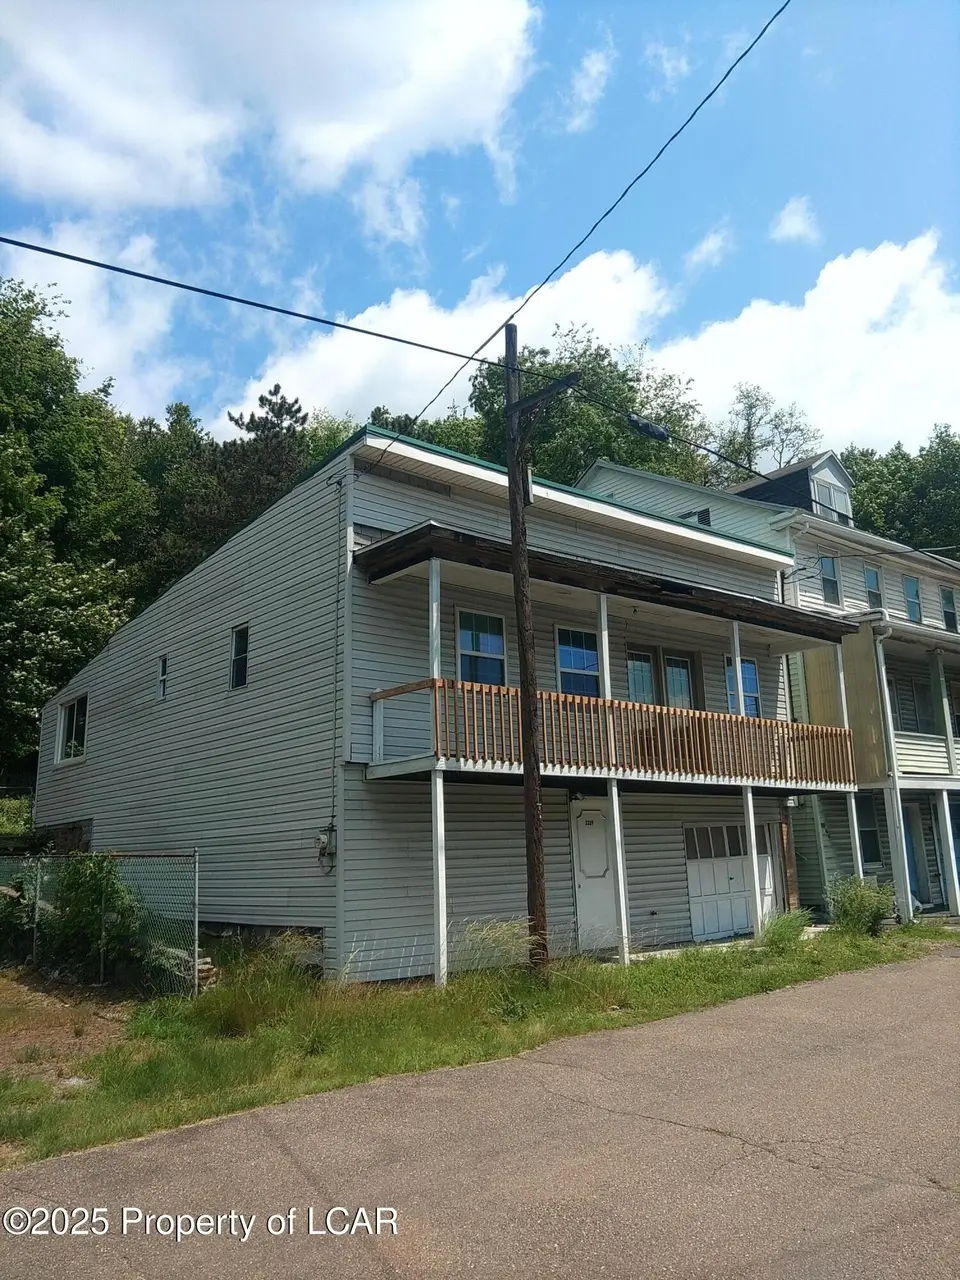
2219 High St · Gilberton, PA
Flood risk 10/10 · Severe
- FEMA flood zone
- X (unshaded)
- Chance of flooding over 30 yrs
- 0.99%
- Est. flood insurance / yr
- $507 – $1,088
Fire risk 1/10 · Minimal
- Est. fire insurance / yr
- $511 – $949
Heat risk 4/10 · Minor
- Hot days now (above 92°F)
- 8 days/yr
- Hot days in 30 yrs
- 17 days/yr
Wind risk 3/10 · Minor
- Chance of severe wind over 30 yrs
- 6.0%
Air-quality risk 2/10 · Minimal
- Unhealthy air days now
- 1 days/yr
- Unhealthy air days in 30 yrs
- 1 days/yr
Risk factors via First Street. Map © Google.
Why this score? — see what drove the B grade
The composite is a weighted blend of 9 inputs, each scored 0–100. Each bar is that input's sub-score; the figure is the points it added to the 100-point composite (weight × sub-score).
- Cash flow +30.0/30.0
- 1% rule +10.0/10.0
- DSCR +10.0/10.0
- ARV discount +7.5/15.0
- Appreciation +5.0/10.0
- Livability +3.0/5.0
- Condition / age +2.8/5.0
- Rent growth +2.5/5.0
- Schools +1.7/10.0
$38,000
🖨 Deal sheet 📄 Offer letter ✓ Due diligence
Listing remarks MLS
Mahanoy Plane Single Home w/ Recent Upgrades! 2 BR Home with Large Backyard and Oversized 1 Car Garage. Upgrades Include, Kitchen & Bath Metal Roof, New Floors, Windows & Doors. Home is located on leased land with very reasonable fee. Call Today for Private Showing. Owner is related to Listing Agent.
Key facts
- New floors
- Recent upgrades
- Metal roof
Tags
Neighborhood map
What this means for you Summary
Snapshot
- This is a 2-bed/1.0-bath single-family listed at $38k. Condition is rated average.
Deal economics
- At list price, monthly cash flow is $566 ($7k/yr) — positive.
- The deal already cash-flows at list — no discount required.
- Meets the 1% rule at list price ($1k rent vs $38k).
- Recommended offer: $33k (12.0% below list) — sets the bar for market timing.
Location & tenants
- Location reads 59/100 on livability (#1,531 in PA) — a working-class tenant base; expect higher turnover. Strengths: cost of living A+, health & safety A+, housing A-; Watch: crime D+, schools F, amenities F.
- Mahanoy Area SD (town): math 11% / reading 30% proficiency, ranked #494 of 539 in PA (top 92%) — low school quality limits family demand, transient renter base, plan for 1-2y turnover.
- Market conditions: 3 active listings in the ZIP; 169 units permitted in Schuylkill County in 2024 (0 in 5+ unit buildings).
Forward outlook
- In year one you build about $1k of equity ($263 loan paydown + $1k appreciation (3.0% local appreciation)).
- Schuylkill County population projected at -16% by 2050 — secular population decline; favor cash flow + early exit over multi-decade hold.
- At projected returns (3.0% appreciation + 3.0% rent growth), your $11k cash investment doubles in ~2 years — after that, you're playing with house money.
Negotiation context
- It's been on market 345 days — a 12% lower offer ($33k) is reasonable based on typical stale-listing flexibility.
Risks & watch-outs
- Watch-outs: flood insurance adds $66/mo.
- Climate carrying-cost: severe flood risk — expect insurance premiums to compound above CPI over the hold.
Questions for the listing agent
- It's been on market 345 days. Have you received any prior offers? Is the seller open to a 12% concession, seller financing, or rate buy-down credit?
- What's the actual annual flood-insurance premium (NFIP or private), and is the property in a SFHA with mandatory coverage?
- Why hasn't it sold? Are there any deal-killer items the seller is aware of (foundation, flood, title, zoning, code violations)?
- Is there a deadline driving the sale (1031 exchange, divorce, estate, relocation)? That informs how much negotiation room exists.
- Schools are F-rated, which usually means shorter tenancies and higher turnover. Who's the typical renter profile here, and what's been the actual vacancy rate?
- Crime grade is D in this area — have there been break-ins, vandalism, or insurance claims at this property in the last 3 years? What carrier currently insures it and at what premium?
- What's the average days-on-market for RENTAL listings here right now (not sales)? A rising rental-DOM trend means longer vacancies and softer asking-rent achievability than the comps imply.
- What's the recent tenant-quality profile in this submarket — average credit score on applications, eviction rate, late-payment / NSF rate, and stable-employment percentage? A property-management company in the area should have these aggregated.
- How much new for-sale + rental construction is in the pipeline within 1–3 miles? Heavy new supply typically softens prices + rents 12–24 months out; constrained supply supports both.
Investment metrics
- 1% rule
- 2.98% ✓
- Cap rate
- 26.26%
- Cash-on-cash
- 71.32%
- DSCR
- 4.17
- GRM
- 2.8
CMA / ARV
- ARV (median comp)
- $157,374
- List price
- $38,000
- Delta
- -75.85%
- Verdict
- UNDERPRICED
- Comps
- 20 within 1.0 mi
Show comp detail 3 sales within ~0.75 mi
| Address | Dist | Beds/Ba | Sqft | Sold | Price | $/sf | Match |
|---|---|---|---|---|---|---|---|
| 2409 Water St | 0.12mi | 3/1.0 (+1) | 1,248 (-8%) | 11mo | $34,000 | $27 | 68 |
| 308 N Center St | 0.52mi | 3/1.0 (+1) | 1,528 (+13%) | 14mo | $200,000 | $131 | 38 |
| 214 N Broad Mt Ave | 0.73mi | 3/2.0 (+1) | 1,478 (+10%) | 11mo | $223,000 | $151 | 32 |
Match score weights: distance 35% · size 25% · config 20% · recency 20%. Top-matched comps best support the ARV.
Projected returns pro-forma
3.0% appreciation · 3.0% rent growth · sell at horizon
- IRR
- 68.7%
- Equity multiple
- 4.82×
- Total profit
- $40,679
- Equity at exit
- $17,086
- IRR
- 68.2%
- Equity multiple
- 9.87×
- Total profit
- $94,384
- Equity at exit
- $26,332
Cash invested: $10,640 (down + closing). Projections, not guarantees.
Landlord ↔ Tenant lean methodology
- Overall (STATE)
- 62 Landlord-Friendly
- State Pennsylvania
- 62 Landlord-Friendly · EVEN
- County
- — inherits STATE
- City
- — inherits STATE
ZIP-level market 17934
- Active inventory
- 3
- Price-to-rent
- 2.8×
Monthly cashflow live
- Estimated rent
- $1,133 medium interval (Pro) →
- Mortgage (P&I)
- −$199
- Tax est. 1.5%
- −$48 /mo · $570/yr
- Insurance
- −$16
- Flood insurance flood zone
- −$66 /mo · $798/yr
- HOA
- −$0
- Vacancy / Maint / Mgmt
- −$238
- Net cashflow
- $566
Break-even live
UW: 25.0% down · 7.5% · 30yr · 1.5% tax · 5.0% vac · 8.0% maint · 8.0% mgmt
Financing live
Cash to close
- Down payment
- $9,500
- Closing costs
- $1,140
- Reserves months
- —
- Total cash needed
- —
Loan-product check · same deal, 3 products live
Conventional
25% down · 7.5% · 30yr
- Down + closing
- —
- Monthly P&I
- —
- Monthly cashflow
- —
- DSCR
- —
- Eligible?
- —
Personal DTI + credit; lowest rate.
DSCR
20% down · 8.5% · 30yr
- Down + closing
- —
- Monthly P&I
- —
- Monthly cashflow
- —
- DSCR
- —
- Eligible?
- —
No personal income docs; deal must DSCR.
Hard money
10% down · 12.0% · 12mo
- Down + closing
- —
- Monthly P&I
- —
- Monthly cashflow
- —
- DSCR
- —
- Eligible?
- —
Short-term bridge; refi at stabilization.
Listing history 6 events
-
2026-06-01days on market $38,000 Active 345 DOM
-
2026-05-31days on market $38,000 Active 344 DOM
-
2026-05-31price $38,000 Active 343 DOM
-
2025-10-09price $44,900 313-char remark
Show marketing remark (313 chars)
Mahanoy Plane Single Home w/ Recent Upgrades! 2 BR Home with Large Backyard and Oversized 1 Car Garage. Upgrades Include, Kitchen & Bath Metal Roof, New Floors, Windows & Doors. Home is located on leased land with very reasonable fee. Call Today for Private Showing. Owner is related to Listing Agent.
-
2025-06-21$54,900 Active 313-char remark
Show marketing remark (313 chars)
Mahanoy Plane Single Home w/ Recent Upgrades! 2 BR Home with Large Backyard and Oversized 1 Car Garage. Upgrades Include, Kitchen & Bath Metal Roof, New Floors, Windows & Doors. Home is located on leased land with very reasonable fee. Call Today for Private Showing. Owner is related to Listing Agent.
-
2024-07-26price $59,000
ⓘ Source: listings_history table (triggers on properties + properties_extension) + one-shot
backfill from property_details.listing_events for pre-trigger history.
Climate risk First Street
- Flood 10/10 Extreme FEMA zone X (unshaded) · 99% chance over 30 yrs
- Wildfire 1/10 Low
- Heat 4/10 Moderate 8 d/yr ≥92°F today · 17 d/yr by 30 yrs out
- Wind 3/10 Moderate 6% chance of damaging wind over 30 yrs
- Air quality 2/10 Low 1 unhealthy d/yr today · 1 by 30 yrs out
Nearby sold comps map
Loading sold comps map…
Walkable amenities ~0.75 mi
Loading nearby amenities…
Taxation est. · year 1
- Rental income
- $13,595
- − Mortgage interest
- −$2,129
- − Property taxes
- −$570
- − Insurance
- −$987
- − Repairs & maintenance
- −$1,088
- − Management
- −$1,088
- − Depreciation
- −$1,105
- Taxable income
- $6,628
- Est. tax owed @ 24.0%
- −$1,591
- After-tax cash flow
- $5,200/yr
For passive investors: Depreciation is non-cash, so a rental often shows a tax loss while cash-flowing — sheltering income. Rental losses are passive: they offset passive income freely, and up to $25,000/yr can offset ordinary (W-2) income if you actively participate and your MAGI is under $100k (phasing out to $0 by $150k); unused losses carry forward. On sale, claimed depreciation is recaptured at up to 25%, and gains may owe capital-gains tax (a 1031 exchange can defer both). Figures are a year-1 estimate at your 24.0% rate — not tax advice; consult a CPA.
Condition & rehab AI · 1 photo
The home requires moderate repairs and maintenance, with a focus on exterior siding and landscaping. Upgrades to the kitchen and bath would significantly enhance its value.
Repairs flagged
- Moderate Exterior siding — Siding shows signs of wear and tear.
- Minor Landscaping — Overgrown grass and shrubs need trimming.
Value-add opportunities
- Both Paint exterior walls — Fresh paint enhances curb appeal and value.
- Both Trim landscaping — Well-maintained landscaping improves curb appeal and rental value.
- Both Replace exterior siding — New siding improves the home's appearance and value.
- Both Upgrade kitchen and bath — Modernizing these spaces increases both resale and rental value.
Renovation cost estimate screening
| Repair item | Severity | Est. cost |
|---|---|---|
| Exterior siding · Siding shows signs of wear and tear. | Moderate | $3,000–15,000 |
| Landscaping · Overgrown grass and shrubs need trimming. | Minor | $500–3,000 |
| Total estimated repair cost · 2 items | $3,500–18,000 |
Value-add ROI direction
- Both Paint exterior walls — Fresh paint enhances curb appeal and value. ↑
- Both Trim landscaping — Well-maintained landscaping improves curb appeal and rental value. ↑
- Both Replace exterior siding — New siding improves the home's appearance and value. ↑
- Both Upgrade kitchen and bath — Modernizing these spaces increases both resale and rental value. ↑
ⓘ Cost ranges are severity-bucket heuristics (US national rule-of-thumb). Get contractor quotes + a written scope before underwriting a rehab budget.
Schools (NCES district)
- District
- Mahanoy Area SD
- NCES district ID
- 4214430
- Math proficiency
- 11% ▼ -9.00%
- Reading proficiency
- 30% ▼ -13.00%
- Median HH income
- $36,347
- Composite
- 16.95/100
- National rank
- #9136
- State rank
- #494 of 539 in PA
Livability — Gilberton
- Score
- 59/100
- State rank
- #1531
- US rank
- #20085
Category grades
Schools grade is shown separately in the Schools card above.
Census & demographics
- Census place
- Gilberton, PA
- City population
- 585
- Population (ZIP)
- 442
Population outlook (Schuylkill County) Hauer SSP2
- Today (2025)
- 137,447 people
- By 2030
- 133,121 · -3.1%
- By 2040
- 124,172 · -9.7%
- By 2050
- 115,611 · -15.9%
- By 2075
- 100,796 · -26.7%
- By 2100
- 86,667 · -36.9%
Race, ethnicity, and origin ACS 2023
- Neighborhood character
- Predominantly White (79%)
- Race & ethnicity
- White 79% Hispanic / Latino 20% Two or more races 8%
- Hispanic origin (detail)
- Mexican 7% Cuban 1% Dominican 11%
- Common ancestry
- Romanian 18% Subsaharan African 7% Lithuanian 3%
- Foreign-born
- 5% · Canada
- Languages at home
- 89% English-only · Spanish 11%
Political lean MEDSL · Schuylkill
- 2024 margin
- Solid R (+42.1) · D 28.5% · R 70.6%
- 2008→2024 swing
- -33.4pp toward R · 2008: -8.7pp · 2024: -42.1pp
- All cycles
- 2024: R+42.1 2020: R+39.9 2016: R+43.4 2012: R+13.4 2008: R+8.7
Not yet ingested
- Civics
- —
Market trends
- HPI YoY
- —
- Current HPI
- —
- Rent YoY
- —
- Metro
- —
- State GDP YoY
- ▲ 1.68%
- F500 in state
- 34
Industry mix (Fortune 500 HQ in PA)
| Industry | F500 HQs | Revenue |
|---|---|---|
| Healthcare | 2 | $309B |
|
||
| Insurance | 2 | $27B |
|
||
| Telecommunications / Media | 1 | $124B |
|
||
| Industrial Distribution | 1 | $22B |
|
||
| Financial Services | 1 | $20B |
|
||
| Chemicals / Materials | 1 | $18B |
|
||
Price history
-23.9% since first listed3 events — show timeline
- 2025-10-09 Price Changed $44,900 LCAR
- 2025-06-21 Listed $54,900 LCAR
- 2024-07-26 Price Changed $59,000 LCAR
Cash-flow waterfall
monthlySold comps — $/sqft
last 12 mo · ≤1 miLoading sold comps…