 Duplex
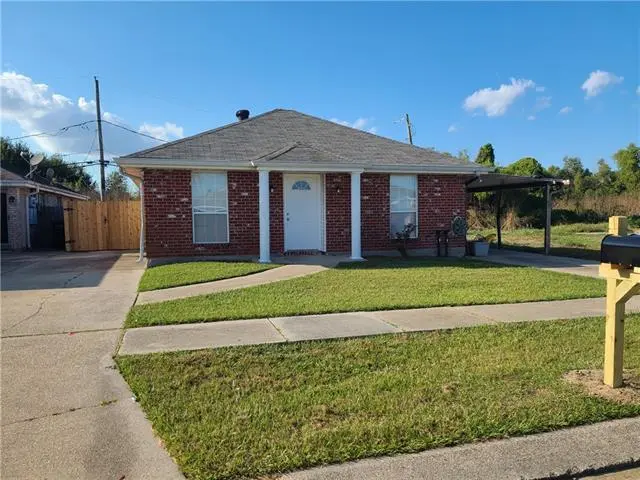
3820-3822 Juno Dr · Chalmette, LA
Flood risk 8/10 · Major
- FEMA flood zone
- X (shaded)
- Chance of flooding over 30 yrs
- 0.6%
- Est. flood insurance / yr
- $507 – $1,088
Fire risk 1/10 · Minimal
- Est. fire insurance / yr
- $1,269 – $2,357
Heat risk 10/10 · Severe
- Hot days now (above 108°F)
- 7 days/yr
- Hot days in 30 yrs
- 22 days/yr
Wind risk 10/10 · Severe
- Chance of severe wind over 30 yrs
- 99.0%
Air-quality risk 3/10 · Minor
- Unhealthy air days now
- 3 days/yr
- Unhealthy air days in 30 yrs
- 3 days/yr
Risk factors via First Street. Map © Google.
Why this score? — see what drove the B- grade
The composite is a weighted blend of 9 inputs, each scored 0–100. Each bar is that input's sub-score; the figure is the points it added to the 100-point composite (weight × sub-score).
- Cash flow +28.3/30.0
- DSCR +10.0/10.0
- ARV discount +7.1/15.0
- 1% rule +7.0/10.0
- Schools +5.0/10.0
- Rent growth +3.3/5.0
- Livability +3.2/5.0
- Condition / age +2.5/5.0
- Appreciation +0.0/10.0
$250,000
🖨 Deal sheet 📄 Offer letter ✓ Due diligence
Multi-family units
County records classify this as Multi-Family (2-4 Unit). Listing-text estimate: 2 units. confirmed
Listing remarks MLS
Double Opportunity, first time home buyers also owner occupants also investors. No Carpet, Live in one side and let the other side go towards your mortgage. Great Opportunity. X Flood
Key facts
- Parking
- Built 1984
- Listed 31 days
Property features AI
Finance
- Financial info: Income/expense and investor-specific details not provided
Exterior
- Parking: Driveway
- Utilities: Public water; Public sewer
- Home design: Single-story building; Two-unit property
- Construction: Brick construction; Shingle roof; Slab foundation; Built/maintained in very good condition
- Exterior features: City lot; Rectangular lot; Lot dimensions approx. 50 x 102
Interior
- Bedrooms: Two-unit property (number of individual bedrooms per unit not specified)
- Bathrooms: 3 full bathrooms (total)
- Heating & cooling: Central heating; Central air conditioning
- Interior features: Total of 12 rooms; Very good condition
- Laundry & utility: Tenants pay electricity and water
Neighborhood map
What this means for you Summary
Snapshot
- This is a 2 × 2-bed/1-bath units multifamily listed at $250k.
Deal economics
- At list price, monthly cash flow is $736 ($9k/yr) — positive. Per door: $368/mo.
- The deal already cash-flows at list — no discount required.
- Meets the 1% rule at list price ($3k rent vs $250k).
- Recommended offer: $242k (3.0% below list) — sets the bar for market timing.
- Cap rate 10.1% vs local median 5.5% in Chalmette — top-decile yield for the area; either an underpriced asset or a hidden risk that comps aren't pricing in. Stress-test before assuming the spread holds.
Location & tenants
- Location reads 65/100 on livability (#137 in LA) — a middle-class / working-renter tenant base. Strengths: cost of living A+, housing A+, health & safety A; Watch: crime F, amenities F, commute F.
- Market conditions: Rents rising (+3.1%/yr); 209 active listings in the ZIP; 12 comparable units currently listed for rent nearby; rentals leasing fast (median 12d on market — plan ~1-2 weeks tenant-placement turnaround); 112 units permitted in St. Bernard Parish in 2024 (0 in 5+ unit buildings).
- At $2,997/mo this rent would consume 65% of the median local household income ($55k/yr) (locally 881% of renters already pay >50% of income on rent) — very limited rent-growth headroom before tenants either downsize or default.
Forward outlook
- Local home prices are declining (-3.0%/yr); year-one equity from $2k of loan paydown is wiped out by about $8k of value loss. Plan a longer hold.
- St. Bernard County population projected at +89% by 2050 — long-run rental-demand tailwind backs the buy-and-hold thesis.
- At projected returns (-3.0% appreciation + 3.1% rent growth), your $70k cash investment doubles in ~9 years — after that, you're playing with house money.
Negotiation context
- It's been on market 31 days — a 3% lower offer ($242k) is reasonable based on typical stale-listing flexibility.
- 4 sale attempts with the ask held roughly flat each time — persistent listings suggest the price (not the market) is what's stuck; bring a comps-based counter.
- Current owner paid $132k; list at $250k implies a 90% gain — meaningful room to come down on a strong offer.
Risks & watch-outs
- Watch-outs: flood insurance adds $66/mo.
- Climate carrying-cost: severe flood risk; severe wind risk, 99% chance of damaging wind over 30y; extreme-heat days projected 7→22/yr by 2055 (HVAC capex compounding) — expect insurance premiums to compound above CPI over the hold.
Questions for the listing agent
- It's been on market 31 days. Have you received any prior offers? Is the seller open to a 3% concession, seller financing, or rate buy-down credit?
- Can we see the unit-by-unit rent roll, current vacancy, and any below-market leases? What's the average tenancy length?
- What capital expenditures (roof, boiler, parking lot, exteriors) have been made in the last 5 years, and what's planned in the next 2?
- What's the actual annual flood-insurance premium (NFIP or private), and is the property in a SFHA with mandatory coverage?
- Is there a deadline driving the sale (1031 exchange, divorce, estate, relocation)? That informs how much negotiation room exists.
- Crime grade is F in this area — have there been break-ins, vandalism, or insurance claims at this property in the last 3 years? What carrier currently insures it and at what premium?
- What's the average days-on-market for RENTAL listings here right now (not sales)? A rising rental-DOM trend means longer vacancies and softer asking-rent achievability than the comps imply.
- What's the recent tenant-quality profile in this submarket — average credit score on applications, eviction rate, late-payment / NSF rate, and stable-employment percentage? A property-management company in the area should have these aggregated.
- How much new apartment / multifamily construction is in the pipeline within 1–3 miles? Heavy new supply (>2% of stock underway) typically softens rents 12–24 months out; light construction supports rent growth.
Investment metrics
- 1% rule
- 1.20% ✓
- Cap rate
- 10.14%
- Cash-on-cash
- 13.76%
- DSCR
- 1.61
- GRM
- 7.0
CMA / ARV
- ARV (on-the-fly)
- $248,000
- Comps found
- 12
Show comp detail 12 sales within ~0.75 mi
| Address | Dist | Beds/Ba | Sqft | Sold | Price | $/sf | Match |
|---|---|---|---|---|---|---|---|
| 9109 Atreus St | 0.19mi | 4/3.5 | 1,980 (-1%) | 9mo | $170,000 | $86 | 80 |
| 3521 23 Kings Dr | 0.20mi | 5/4.0 (+1) | 1,996 (-0%) | 3mo | $354,000 | $177 | 79 |
| 9025-27 Atreus St | 0.18mi | 4/4.0 | 2,000 (0%) | 14mo | $196,000 | $98 | 76 |
| 74-76 Phillip Ct | 0.33mi | 4/2.0 | 1,920 (-4%) | 1mo | $240,000 | $125 | 73 |
| 4005-07 Jupiter Dr | 0.16mi | 5/2.5 (+1) | 2,048 (+2%) | 11mo | $230,000 | $112 | 72 |
| 4017-19 Jupiter Dr | 0.18mi | 4/2.0 | 1,804 (-10%) | 11mo | $207,000 | $115 | 62 |
| 3509-3511 Jupiter Dr | 0.27mi | 5/3.0 (+1) | 2,250 (+12%) | 2mo | $263,000 | $117 | 60 |
| 8512 14 Valor Dr | 0.49mi | 4/2.0 | 1,933 (-3%) | 11mo | $250,000 | $129 | 58 |
| 3817 19 Juno Dr | 0.03mi | 4/2.0 | 1,700 (-15%) | 14mo | $255,000 | $150 | 58 |
| 125 27 W Philip Ct | 0.35mi | 5/3.0 (+1) | 2,100 (+5%) | 16mo | $259,000 | $123 | 57 |
| 9101-9103 Atreus St | 0.18mi | 4/4.0 | 1,700 (-15%) | 11mo | $243,500 | $143 | 53 |
| 9029 31 Oz Dr | 0.25mi | 5/3.0 (+1) | 2,196 (+10%) | 17mo | $272,400 | $124 | 53 |
Match score weights: distance 35% · size 25% · config 20% · recency 20%. Top-matched comps best support the ARV.
Projected returns pro-forma
-3.0% appreciation · 3.11% rent growth · sell at horizon
- IRR
- 2.5%
- Equity multiple
- 1.10×
- Total profit
- $6,682
- Equity at exit
- $37,276
- IRR
- 12.2%
- Equity multiple
- 1.96×
- Total profit
- $67,488
- Equity at exit
- $21,615
Cash invested: $70,000 (down + closing). Projections, not guarantees.
Landlord ↔ Tenant lean methodology
- Overall (STATE)
- 90 Strongly Landlord-Friendly
- State Louisiana
- 90 Strongly Landlord-Friendly · R+12
- County
- — inherits STATE
- City
- — inherits STATE
ZIP-level market 70043
- Rents YoY
- 3.1%
- Active inventory
- 209
- Price-to-rent
- 13.9×
Monthly cashflow live
- Estimated rent
- $2,997 high interval (Pro) →
- Mortgage (P&I)
- −$1,311
- Tax from tax record
- −$150 /mo · $1,800/yr
- Insurance
- −$104
- Flood insurance flood zone
- −$66 /mo · $798/yr
- HOA
- −$0
- Vacancy / Maint / Mgmt
- −$629
- Net cashflow
- $736
Break-even live
2-unit breakdown (identical units grouped — click to expand)
| Units | Beds | Baths | Est. rent |
|---|---|---|---|
| 2× units | 2 | 1 | $2,998 |
| #1 | 2 | 1 | $1,499 |
| #2 | 2 | 1 | $1,499 |
| Total (2 units) | $2,997 | ||
UW: 25.0% down · 7.5% · 30yr · 1.5% tax · 5.0% vac · 8.0% maint · 8.0% mgmt
Financing live
Cash to close
- Down payment
- $62,500
- Closing costs
- $7,500
- Reserves months
- —
- Total cash needed
- —
Loan-product check · same deal, 3 products live
Conventional
25% down · 7.5% · 30yr
- Down + closing
- —
- Monthly P&I
- —
- Monthly cashflow
- —
- DSCR
- —
- Eligible?
- —
Personal DTI + credit; lowest rate.
DSCR
20% down · 8.5% · 30yr
- Down + closing
- —
- Monthly P&I
- —
- Monthly cashflow
- —
- DSCR
- —
- Eligible?
- —
No personal income docs; deal must DSCR.
Hard money
10% down · 12.0% · 12mo
- Down + closing
- —
- Monthly P&I
- —
- Monthly cashflow
- —
- DSCR
- —
- Eligible?
- —
Short-term bridge; refi at stabilization.
Rent comps 12 comps
| Address | Beds | Baths | Sqft | Rent | $/sqft | DOM | Units | Dist |
|---|---|---|---|---|---|---|---|---|
| 3606 Pakenham Dr Unit 3606 Chalmette, LA | 3.0 | 2.0 | 1400 | $1,800 | $1.29 | 11d | 1 | 0.26mi |
| 8413 Benjamin Dr Chalmette, LA | 3.0 | 2.0 | 1800 | $2,300 | $1.28 | 3d | 1 | 0.41mi |
| 2707 Jackson Blvd Chalmette, LA | 3.0 | 3.0 | 1733 | $2,300 | $1.33 | 43d | 1 | 0.88mi |
| 2707 Jackson Blvd Chalmette, LA | 3.0 | 2.5 | 1733 | $2,300 | $1.33 | 23d | 1 | 0.88mi |
| 424 Chinchilla Dr Arabi, LA | 3.0 | 2.0 | 1735 | $3,500 | $2.02 | 16d | 1 | 1.25mi |
| 3321 Plaza Dr Chalmette, LA | 3.0 | 2.0 | 1400 | $1,650 | $1.18 | 10d | 1 | 1.28mi |
| 3708 Veronica Dr Chalmette, LA | 3.0 | 2.0 | 1818 | $2,550 | $1.40 | 1d | 1 | 1.33mi |
| 2518 Delambert St Chalmette, LA | 3.0 | 2.0 | 1617 | $1,825 | $1.13 | 43d | 1 | 1.35mi |
| 309 Fawn Dr Arabi, LA | 3.0 | 2.5 | 1745 | $2,500 | $1.43 | 1d | 1 | 1.36mi |
| 7532 Patricia St Arabi, LA | 3.0 | 2.0 | 1850 | $1,900 | $1.03 | 2d | 1 | 1.43mi |
| 7532 Patricia St Arabi, LA | 3.0 | 2.0 | 1850 | $1,900 | $1.03 | 2d | 1 | 1.43mi |
| 7532 Patricia St Arabi, LA | 4.0 | 3.0 | 2099 | $2,200 | $1.05 | 43d | 1 | 1.45mi |
Listing history 27 events
-
2026-06-18days on market $250,000 Active 31 DOM
-
2026-06-17days on market $250,000 Active 30 DOM
-
2026-06-16days on market $250,000 Active 29 DOM
-
2026-06-15days on market $250,000 Active 28 DOM
-
2026-06-13days on market $250,000 Active 26 DOM
-
2026-06-10days on market $250,000 Active 23 DOM
-
2026-06-09days on market $250,000 Active 22 DOM
-
2026-06-08days on market $250,000 Active 21 DOM
-
2026-06-07days on market $250,000 Active 20 DOM
-
2026-06-03days on market $250,000 Active 16 DOM
-
2026-06-02days on market $250,000 Active 15 DOM
-
2026-06-01days on market $250,000 Active 14 DOM
-
2026-05-31days on market $250,000 Active 13 DOM
-
2026-05-18$250,000 Active 183-char remark
Show marketing remark (183 chars)
Double Opportunity, first time home buyers also owner occupants also investors. No Carpet, Live in one side and let the other side go towards your mortgage. Great Opportunity. X Flood
-
2026-05-18$250,000 Active
Show marketing remark (183 chars)
Double Opportunity, first time home buyers also owner occupants also investors. No Carpet, Live in one side and let the other side go towards your mortgage. Great Opportunity. X Flood
-
2025-12-21historical $1,250
-
2025-12-17price $245,000
-
2025-12-17price $245,000
-
2025-11-27price $1,250
-
2025-11-25price $1,285
-
2025-11-23$1,425
-
2025-11-12price $249,000
-
2025-11-09price $249,000
-
2025-11-01$255,000 Active
-
2024-03-15soldstatus $131,500
-
2006-09-13soldstatus $33,500
-
2004-04-12soldstatus $125,000
ⓘ Source: listings_history table (triggers on properties + properties_extension) + one-shot
backfill from property_details.listing_events for pre-trigger history.
Tax reassessment forecast LA · Resets to sale price
- Current annual tax
- $1,800 · $150/mo
- Projected year-2 tax
- $1,800 · $150/mo
- Expected delta
- $0/yr ($0/mo · 0.0%)
ⓘ Screening estimate from a state-policy table — verify with the county assessor before closing.
Climate risk First Street
- Flood 8/10 Severe FEMA zone X (shaded) · 60% chance over 30 yrs
- Wildfire 1/10 Low
- Heat 10/10 Extreme 7 d/yr ≥108°F today · 22 d/yr by 30 yrs out
- Wind 10/10 Extreme 99% chance of damaging wind over 30 yrs
- Air quality 3/10 Moderate 3 unhealthy d/yr today · 3 by 30 yrs out
Nearby sold comps map
Loading sold comps map…
Walkable amenities ~0.75 mi
Loading nearby amenities…
Taxation est. · year 1
- Rental income
- $35,964
- − Mortgage interest
- −$14,004
- − Property taxes
- −$1,800
- − Insurance
- −$2,048
- − Repairs & maintenance
- −$2,877
- − Management
- −$2,877
- − Depreciation
- −$7,273
- Taxable income
- $5,086
- Est. tax owed @ 24.0%
- −$1,221
- After-tax cash flow
- $7,611/yr
For passive investors: Depreciation is non-cash, so a rental often shows a tax loss while cash-flowing — sheltering income. Rental losses are passive: they offset passive income freely, and up to $25,000/yr can offset ordinary (W-2) income if you actively participate and your MAGI is under $100k (phasing out to $0 by $150k); unused losses carry forward. On sale, claimed depreciation is recaptured at up to 25%, and gains may owe capital-gains tax (a 1031 exchange can defer both). Figures are a year-1 estimate at your 24.0% rate — not tax advice; consult a CPA.
Schools (NCES district)
No district data.
Livability — Chalmette
- Score
- 65/100
- State rank
- #137
- US rank
- #12500
Category grades
Schools grade is shown separately in the Schools card above.
Census & demographics
- Census place
- Chalmette, LA
- County
- Saint Bernard Parish · 22,638 people
- City population
- 22,638
- Metro
- New Orleans-Metairie, LA
- Population (ZIP)
- 22,638
- Household income
- $55,068
- Rent vs Own
- Severe rent burden
- 881.0
Population outlook (St. Bernard County) Hauer SSP2
- Today (2025)
- 66,513 people
- By 2030
- 77,768 · +16.9%
- By 2040
- 101,296 · +52.3%
- By 2050
- 125,770 · +89.1%
- By 2075
- 188,160 · +182.9%
- By 2100
- 239,339 · +259.8%
Race, ethnicity, and origin ACS 2023
- Neighborhood character
- Diverse neighborhood (Simpson 0.61)
- Race & ethnicity
- White 55% Black 26% Hispanic / Latino 12% Two or more races 10% Asian 2%
- Hispanic origin (detail)
- Mexican 2%
- Common ancestry
- Lithuanian 13% Slovak 2%
- Foreign-born
- 6% · Canada, Vietnam
- Languages at home
- 88% English-only · Spanish 8% Arabic 1% Vietnamese 1%
Political lean MEDSL · St. Bernard
- 2024 margin
- Strong R (+29.3) · D 34.5% · R 63.8% · Other 1.7%
- 2008→2024 swing
- +16.1pp toward D · 2008: -45.4pp · 2024: -29.3pp
- All cycles
- 2024: R+29.3 2020: R+28.5 2016: R+33.4 2012: R+24.7 2008: R+45.4
Not yet ingested
- Civics
- —
Market trends
- HPI YoY
- ▼ -211.77%
- Current HPI
- 194.8123
- Rent YoY
- ▲ 3.11%
- Metro
- New Orleans-Metairie, LA
- State GDP YoY
- ▲ 3.29%
- F500 in state
- 10
Industry mix (Fortune 500 HQ in LA)
| Industry | F500 HQs | Revenue |
|---|---|---|
| Telecommunications | 2 | $23B |
|
||
| Utilities | 1 | $12B |
|
||
| Wholesale / Distribution | 1 | $5B |
|
||
| Advertising | 1 | $2B |
|
||
Price history
+100.0% since first listed14 events — show timeline
- 2026-05-18 Listed $250,000 GSREIN
- 2026-05-18 Listed $250,000 AcadianaMLS
- 2025-12-21 Rental Removed $1,250 BUILDIUM
- 2025-12-17 Price Changed $245,000 AcadianaMLS
- 2025-12-17 Price Changed $245,000 GSREIN
- 2025-11-27 Price Changed $1,250 BUILDIUM
- 2025-11-25 Price Changed $1,285 BUILDIUM
- 2025-11-23 Listed for Rent $1,425 BUILDIUM
- 2025-11-12 Price Changed $249,000 AcadianaMLS
- 2025-11-09 Price Changed $249,000 GSREIN
- 2025-11-01 Listed $255,000 AcadianaMLS
- 2024-03-15 Sold (Public Records) $131,500 Public Records
- 2006-09-13 Sold (Public Records) $33,500 Public Records
- 2004-04-12 Sold (Public Records) $125,000 Public Records
Property tax history
+2.7%/yrLatest (2025): $1,800 · +15.2% YoY. Source: county tax records.
Cash-flow waterfall
monthlySold comps — $/sqft
last 12 mo · ≤1 miLoading sold comps…