 Multi-family
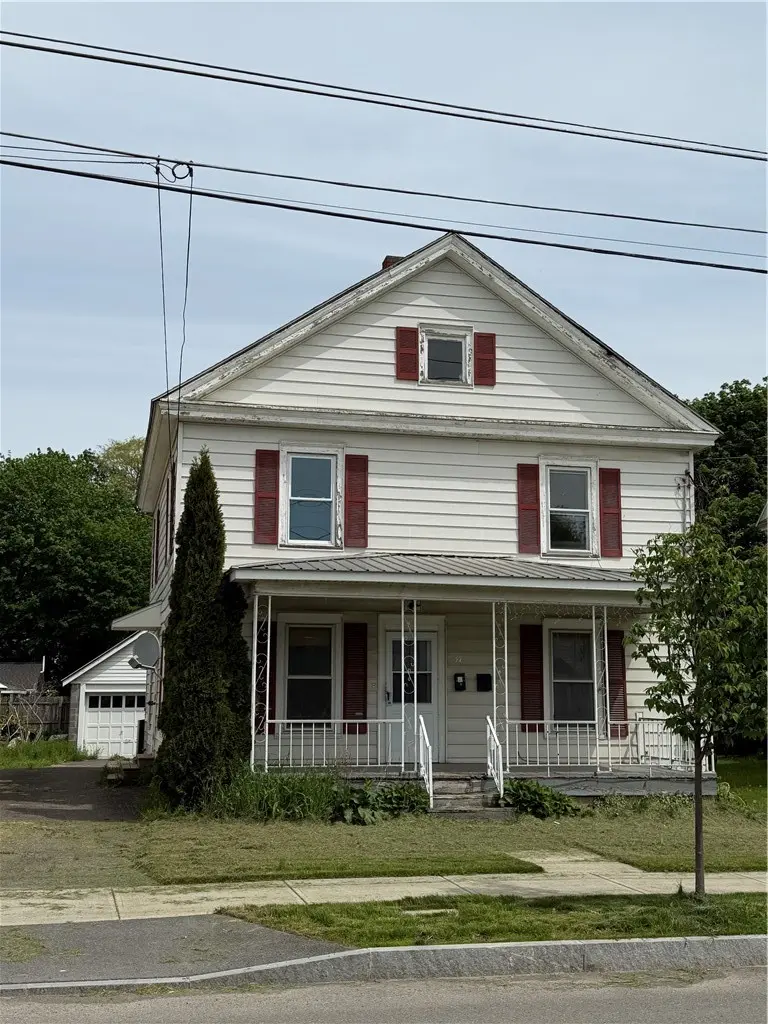
37 Rexford St · Norwich, NY
Flood risk 1/10 · Minimal
- FEMA flood zone
- X (unshaded)
- Chance of flooding over 30 yrs
- 0.0%
- Est. flood insurance / yr
- $473 – $860
Fire risk 2/10 · Minimal
- Est. fire insurance / yr
- $691 – $1,283
Heat risk 3/10 · Minor
- Hot days now (above 94°F)
- 7 days/yr
- Hot days in 30 yrs
- 17 days/yr
Wind risk 2/10 · Minimal
- Chance of severe wind over 30 yrs
- 1.0%
Air-quality risk 1/10 · Minimal
- Unhealthy air days now
- 0 days/yr
- Unhealthy air days in 30 yrs
- 0 days/yr
Risk factors via First Street. Map © Google.
Why this score? — see what drove the B grade
The composite is a weighted blend of 9 inputs, each scored 0–100. Each bar is that input's sub-score; the figure is the points it added to the 100-point composite (weight × sub-score).
- Cash flow +30.0/30.0
- 1% rule +10.0/10.0
- DSCR +10.0/10.0
- Appreciation +10.0/10.0
- Schools +3.6/10.0
- Livability +3.5/5.0
- Rent growth +2.5/5.0
- Condition / age +2.5/5.0
- ARV discount +0.0/15.0
$130,000
🖨 Deal sheet 📄 Offer letter ✓ Due diligence
Multi-family units
County records classify this as Multi-Family (2-4 Unit). Listing-text estimate: 1 unit. estimate disagrees with records
Listing remarks
Opportunity to live in one unit and rent the other unit out! Two car detached garage. House does need some work and is being sold as is! First floor apartment is a 2-bedroom/1 bath, living room, dining room, kitchen and laundry room. Second floor is a 2 bedroom/living room, 1 bath and does have access to a walk up somewhat finished 3rd floor attic level. Call today for your personal tour!
Key facts
- Walk up attic
- Detached garage
- 4,356 sq ft lot
Tags
Property features AI
Finance
- Financial info: Residential 2-unit zoning; Operating expense details: see remarks; Owner pays: other (see remarks); Rent includes: see remarks
Exterior
- Parking: Attached garage with 2 spaces; Paved parking with two or more spaces
- Utilities: Public water connected; Sewer connected
- Home design: Two-story frame building; Resale property
- Construction: Frame construction; Slab foundation; Existing (previously built) structure
- Exterior features: Rectangular lot (approx. 42 x 108); Main thoroughfare frontage
Interior
- Kitchen: Gas water heater
- Bedrooms: Two-unit property (total units: 2)
- Flooring: Hardwood; Vinyl; Varies by area
- Bathrooms: Two full bathrooms (total)
- Heating & cooling: Gas forced-air heating
- Interior features: Hardwood and vinyl flooring; some areas vary
- Laundry & utility: Separate electric meters for units (2); single gas meter
Neighborhood map
What this means for you Summary
Snapshot
- This is a 4-bed/2.0-bath multifamily listed at $130k.
Deal economics
- At list price, monthly cash flow is $812 ($10k/yr) — positive.
- The deal already cash-flows at list — no discount required.
- Meets the 1% rule at list price ($2k rent vs $130k).
- Recommended offer: $128k (1.5% below list) — sets the bar for market timing.
- Cap rate 13.8% vs local median 4.1% in Norwich — top-decile yield for the area; either an underpriced asset or a hidden risk that comps aren't pricing in. Stress-test before assuming the spread holds.
Location & tenants
- Location reads 70/100 on livability (#447 in NY) — a middle-class / working-renter tenant base. Strengths: cost of living A+, housing A+, health & safety A+; Watch: crime D, amenities F, commute F.
- Norwich City School District (town): math 42% / reading 43% proficiency, ranked #498 of 590 in NY (top 84%) — families likely to look elsewhere, expect single-tenant / working-renter base with shorter leases.
- Market conditions: 84 active listings in the ZIP; 151 units permitted in Chenango County in 2024 (96 in 5+ unit buildings).
Forward outlook
- In year one you build about $14k of equity ($899 loan paydown + $13k appreciation (10.0% local appreciation)).
- Chenango County population projected at -26% by 2050 — secular population decline; favor cash flow + early exit over multi-decade hold.
- At projected returns (10.0% appreciation + 3.0% rent growth), your $36k cash investment doubles in ~2 years — after that, you're playing with house money.
- By year 3, paydown + projected appreciation supports a ~$35k cash-out refi (75% LTV) — recoverable capital for the next deal without selling this one.
Negotiation context
- It's been on market 26 days — a 2% lower offer ($128k) is reasonable based on typical stale-listing flexibility.
Risks & watch-outs
- Watch-outs: property tax is 2.5% of price; built in 1920 — expect roof / HVAC / electrical / plumbing capex.
Questions for the listing agent
- Built in 1920 — when were the roof, HVAC, electrical panel, plumbing, and water heater last replaced?
- Property tax is high relative to price — has the assessment been appealed recently, and will the sale trigger a re-assessment?
- Is there a deadline driving the sale (1031 exchange, divorce, estate, relocation)? That informs how much negotiation room exists.
- Crime grade is D in this area — have there been break-ins, vandalism, or insurance claims at this property in the last 3 years? What carrier currently insures it and at what premium?
- What's the average days-on-market for RENTAL listings here right now (not sales)? A rising rental-DOM trend means longer vacancies and softer asking-rent achievability than the comps imply.
- What's the recent tenant-quality profile in this submarket — average credit score on applications, eviction rate, late-payment / NSF rate, and stable-employment percentage? A property-management company in the area should have these aggregated.
- How much new apartment / multifamily construction is in the pipeline within 1–3 miles? Heavy new supply (>2% of stock underway) typically softens rents 12–24 months out; light construction supports rent growth.
Investment metrics
- 1% rule
- 1.77% ✓
- Cap rate
- 13.79%
- Cash-on-cash
- 26.76%
- DSCR
- 2.19
- GRM
- 4.7
CMA / ARV
- ARV (on-the-fly)
- $100,170
- Comps found
- 4
Show comp detail 4 sales within ~0.75 mi
| Address | Dist | Beds/Ba | Sqft | Sold | Price | $/sf | Match |
|---|---|---|---|---|---|---|---|
| 31 Cortland St | 0.40mi | 4/2.0 | 1,903 (+3%) | 17mo | $50,000 | $26 | 63 |
| 42 Front St | 0.59mi | 3/2.0 (-1) | 1,858 (+0%) | 16mo | $72,000 | $39 | 54 |
| 58 Henry St | 0.54mi | 4/2.5 | 1,851 (-0%) | 22mo | $140,000 | $76 | 54 |
| 15 Adelaide St | 0.38mi | 3/2.0 (-1) | 1,604 (-14%) | 16mo | $87,000 | $54 | 41 |
Match score weights: distance 35% · size 25% · config 20% · recency 20%. Top-matched comps best support the ARV.
Projected returns pro-forma
10.0% appreciation · 3.0% rent growth · sell at horizon
- IRR
- 44.5%
- Equity multiple
- 4.37×
- Total profit
- $122,600
- Equity at exit
- $117,114
- IRR
- 38.6%
- Equity multiple
- 9.81×
- Total profit
- $320,584
- Equity at exit
- $252,561
Cash invested: $36,400 (down + closing). Projections, not guarantees.
Landlord ↔ Tenant lean methodology
- Overall (STATE)
- 15 Strongly Tenant-Friendly
- State New York
- 15 Strongly Tenant-Friendly · D+10
- County
- — inherits STATE
- City
- — inherits STATE
ZIP-level market 13815
- Home prices YoY
- 8.2%
- Active inventory
- 84
- Price-to-rent
- 9.4×
Monthly cashflow live
- Estimated rent
- $2,302 medium interval (Pro) →
- Mortgage (P&I)
- −$682
- Tax from tax record
- −$271 /mo · $3,252/yr
- Insurance
- −$54
- HOA
- −$0
- Vacancy / Maint / Mgmt
- −$483
- Net cashflow
- $812
Break-even live
2-unit breakdown (identical units grouped — click to expand)
| Units | Beds | Baths | Est. rent |
|---|---|---|---|
| 2× units | 2 | 1 | $2,302 |
| #1 | 2 | 1 | $1,151 |
| #2 | 2 | 1 | $1,151 |
| Total (2 units) | $2,302 | ||
UW: 25.0% down · 7.5% · 30yr · 1.5% tax · 5.0% vac · 8.0% maint · 8.0% mgmt
Financing live
Cash to close
- Down payment
- $32,500
- Closing costs
- $3,900
- Reserves months
- —
- Total cash needed
- —
Loan-product check · same deal, 3 products live
Conventional
25% down · 7.5% · 30yr
- Down + closing
- —
- Monthly P&I
- —
- Monthly cashflow
- —
- DSCR
- —
- Eligible?
- —
Personal DTI + credit; lowest rate.
DSCR
20% down · 8.5% · 30yr
- Down + closing
- —
- Monthly P&I
- —
- Monthly cashflow
- —
- DSCR
- —
- Eligible?
- —
No personal income docs; deal must DSCR.
Hard money
10% down · 12.0% · 12mo
- Down + closing
- —
- Monthly P&I
- —
- Monthly cashflow
- —
- DSCR
- —
- Eligible?
- —
Short-term bridge; refi at stabilization.
Listing history 15 events
-
2026-06-18days on market $130,000 Active 26 DOM
-
2026-06-17days on market $130,000 Active 25 DOM
-
2026-06-16days on market $130,000 Active 24 DOM
-
2026-06-15days on market $130,000 Active 23 DOM
-
2026-06-13days on market $130,000 Active 21 DOM
-
2026-06-12days on market $130,000 Active 20 DOM
-
2026-06-09days on market $130,000 Active 17 DOM
-
2026-06-08days on market $130,000 Active 16 DOM
-
2026-06-07days on market $130,000 Active 15 DOM
-
2026-06-07days on market $130,000 Active 14 DOM
-
2026-06-04days on market $130,000 Active 11 DOM
-
2026-06-02days on market $130,000 Active 10 DOM
-
2026-06-01days on market $130,000 Active 9 DOM
-
2026-05-31days on market $130,000 Active 8 DOM
-
2026-05-22$130,000 Active
ⓘ Source: listings_history table (triggers on properties + properties_extension) + one-shot
backfill from property_details.listing_events for pre-trigger history.
Tax reassessment forecast NY · Partial reset (capped growth)
- Current annual tax
- $3,252 · $271/mo
- Projected year-2 tax
- $3,252 · $271/mo
- Expected delta
- $0/yr ($0/mo · 0.0%)
ⓘ Screening estimate from a state-policy table — verify with the county assessor before closing.
Climate risk First Street
- Flood 1/10 Low FEMA zone X (unshaded) · 0% chance over 30 yrs
- Wildfire 2/10 Low
- Heat 3/10 Moderate 7 d/yr ≥94°F today · 17 d/yr by 30 yrs out
- Wind 2/10 Low 100% chance of damaging wind over 30 yrs
- Air quality 1/10 Low 0 unhealthy d/yr today · 0 by 30 yrs out
Nearby sold comps map
Loading sold comps map…
Walkable amenities ~0.75 mi
Loading nearby amenities…
Taxation est. · year 1
- Rental income
- $27,624
- − Mortgage interest
- −$7,282
- − Property taxes
- −$3,252
- − Insurance
- −$650
- − Repairs & maintenance
- −$2,210
- − Management
- −$2,210
- − Depreciation
- −$3,782
- Taxable income
- $8,238
- Est. tax owed @ 24.0%
- −$1,977
- After-tax cash flow
- $7,763/yr
For passive investors: Depreciation is non-cash, so a rental often shows a tax loss while cash-flowing — sheltering income. Rental losses are passive: they offset passive income freely, and up to $25,000/yr can offset ordinary (W-2) income if you actively participate and your MAGI is under $100k (phasing out to $0 by $150k); unused losses carry forward. On sale, claimed depreciation is recaptured at up to 25%, and gains may owe capital-gains tax (a 1031 exchange can defer both). Figures are a year-1 estimate at your 24.0% rate — not tax advice; consult a CPA.
Schools (NCES district)
- District
- Norwich City School District
- NCES district ID
- 3621330
- Math proficiency
- 42% ▼ -13.00%
- Reading proficiency
- 43% ▲ 1.00%
- Median HH income
- $40,687
- Composite
- 35.68/100
- National rank
- #4874
- State rank
- #498 of 590 in NY
Livability — Norwich
- Score
- 70/100
- State rank
- #447
- US rank
- #7857
Category grades
Schools grade is shown separately in the Schools card above.
Census & demographics
- Census place
- Norwich, NY
- City population
- 12,855
- Population (ZIP)
- 12,855
Population outlook (Chenango County) Hauer SSP2
- Today (2025)
- 45,669 people
- By 2030
- 43,484 · -4.8%
- By 2040
- 38,774 · -15.1%
- By 2050
- 34,000 · -25.6%
- By 2075
- 24,637 · -46.1%
- By 2100
- 16,452 · -64.0%
Race, ethnicity, and origin ACS 2023
- Neighborhood character
- Predominantly White (90%)
- Race & ethnicity
- White 90% Hispanic / Latino 5% Two or more races 4%
- Common ancestry
- Lithuanian 3% Slovak 2% Iranian 2%
- Foreign-born
- 4% · Canada
- Languages at home
- 95% English-only · Spanish 3% German/W. Germanic 0%
Political lean MEDSL · Chenango
- 2024 margin
- Strong R (+27.2) · D 36.4% · R 63.6%
- 2008→2024 swing
- -26.1pp toward R · 2008: -1.1pp · 2024: -27.2pp
- All cycles
- 2024: R+27.2 2020: R+23.3 2016: R+28.1 2012: R+3.4 2008: R+1.1
Not yet ingested
- Civics
- —
Market trends
- HPI YoY
- ▲ 21.23%
- Current HPI
- 280.463
- Rent YoY
- —
- Metro
- —
- State GDP YoY
- ▲ 2.60%
- F500 in state
- 92
Industry mix (Fortune 500 HQ in NY)
| Industry | F500 HQs | Revenue |
|---|---|---|
| Financial Services | 10 | $950B |
|
||
| Consumer Goods | 9 | $162B |
|
||
| Insurance | 4 | $225B |
|
||
| Telecommunications | 2 | $144B |
|
||
| Pharmaceuticals | 2 | $112B |
|
||
| Media / Entertainment | 2 | $69B |
|
||
Price history
1 event — show timeline
- 2026-05-22 Listed $130,000 UNYREIS
Property tax history
+1.5%/yrLatest (2025): $3,252 · +1.4% YoY. Source: county tax records.
Cash-flow waterfall
monthlySold comps — $/sqft
last 12 mo · ≤1 miLoading sold comps…