135 Liberty · Newport Beach, CA
Flood risk 1/10 · Minimal
- FEMA flood zone
- X (unshaded)
- Chance of flooding over 30 yrs
- 0.0%
- Est. flood insurance / yr
- $507 – $1,088
Fire risk 1/10 · Minimal
- Est. fire insurance / yr
- $659 – $1,223
Heat risk 5/10 · Moderate
- Hot days now (above 82°F)
- 7 days/yr
- Hot days in 30 yrs
- 23 days/yr
Wind risk 1/10 · Minimal
- Chance of severe wind over 30 yrs
- —
Air-quality risk 4/10 · Minor
- Unhealthy air days now
- 6 days/yr
- Unhealthy air days in 30 yrs
- 6 days/yr
Risk factors via First Street. Map © Google.
Why this score? — see what drove the D grade
The composite is a weighted blend of 9 inputs, each scored 0–100. Each bar is that input's sub-score; the figure is the points it added to the 100-point composite (weight × sub-score).
- Cash flow +11.4/30.0
- Appreciation +10.0/10.0
- Schools +5.0/10.0
- Livability +3.8/5.0
- Rent growth +3.5/5.0
- 1% rule +3.3/10.0
- DSCR +3.3/10.0
- Condition / age +2.5/5.0
- ARV discount +2.1/15.0
$625,000
🖨 Deal sheet 📄 Offer letter ✓ Due diligence
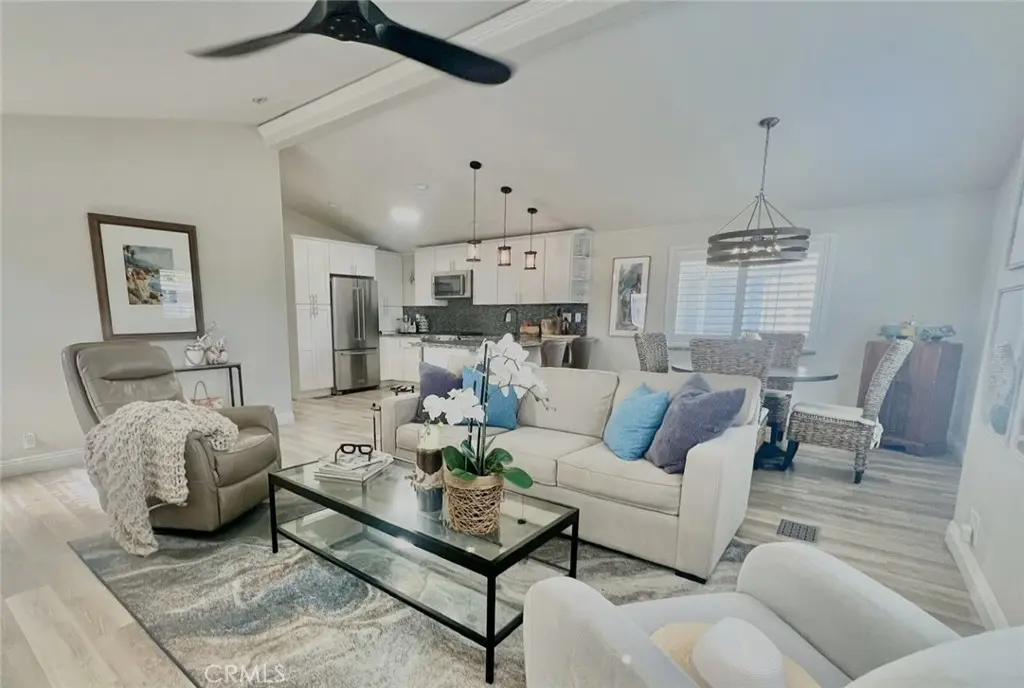
Listing remarks
Beautiful turnkey home in Bayside Village in the heart of Newport Beach. This property is just a short stroll to the bay and marina, clubhouse, pool/spa/ private beach and dog park. Enter through the dutch door into a spacious great room with high ceilings, lots of windows and an open upgraded kitchen with lots of granite top counter space, numerous cabinets (some with pull out shelves) plus bar seating. Well sized dining area finishes off this great room. Down the hall is a large private master suite with losts of windows, walk in closet and spacious bathroom with tub & shower. There is a second bedroom suite with a large bathroom and walk in shower. The separate laundry room has a
Key facts
- Turnkey home
- Short stroll to bay
- Spacious great room
Tags
Property features AI
Finance
- Other: Manager approval required for occupancy; Pets allowed with size limits and breed restrictions (dogs and cats OK)
- Financial info: Land lease (monthly) — amount listed separately by park
- HOA & community: Bayside Village community amenities: pool, spa, clubhouse, meeting/banquet rooms, gym/exercise room, picnic and barbecue/outdoor cooking areas, fire pit, dock, dog park, billiard room; Onsite property management; Trash and sewer included in community services; Watersports, biking, fishing, park access
Exterior
- Parking: Covered attached carport (1 space)
- Security: Smoke detector; Carbon monoxide detector; Onsite property management / resident manager
- Utilities: Electricity on property; Natural gas connected; Water connected (district/public); Public sewer; Cable available
- Home design: Single-story home; Mobile home model: Starcrest; Mobile home remains in place; Entry located on side; Faces southeast; No interior steps (accessible); 48-inch-or-wider halls
- Construction: Wood construction with drywall and glass elements; Wood skirting; Pillar/post/pier foundation with pier jacks
- Exterior features: Open patio; Rain gutters; Storage building/shed; Level, landscaped lot; Close to clubhouse; Marina in community; In-ground, fenced, heated community pool; Street lighting; Dock
Interior
- Kitchen: Garbage disposal; Built-in range; Gas range; Dishwasher; Kitchen open to family room; Kitchen island; Pots & pan drawers; Stone/granite counters
- Bedrooms: Main-floor primary bedroom; Walk-in closet
- Flooring: Laminate flooring
- Bathrooms: Two full bathrooms; Upgraded finishes; Shower in tub; Walk-in shower; Granite counters
- Heating & cooling: Central cooling; Central furnace heating
- Interior features: Beamed ceilings; Balcony; Built-ins; High (9+ foot) ceilings; Ceiling fan; Recessed lighting; Open floor plan; Cathedral/vaulted ceilings; Granite counters; Plantation shutters; Window screens; Resident manager; Smoke and carbon monoxide detectors; Spa on site (in-ground, community, heated)
- Laundry & utility: Washer hookup; Gas dryer hookup; Dedicated laundry room; 220V outlet in laundry
Neighborhood map
What this means for you Summary
Snapshot
- This is a 2-bed/2.0-bath manufactured listed at $625k.
Deal economics
- At list price, monthly cash flow is $-219 ($-3k/yr) — negative.
- To cash-flow at today's rent, offer at most $593k (5.1% below list).
- To meet the 1% rule (rent ≥ 1% of price), the offer needs to be $519k (17.0% below list).
- Recommended offer: $519k (17.0% below list) — sets the bar for 1% rule.
- Cap rate 5.9% vs local median 0.6% in Newport Beach — top-decile yield for the area; either an underpriced asset or a hidden risk that comps aren't pricing in. Stress-test before assuming the spread holds.
Location & tenants
- Location reads 76/100 on livability (#101 in CA, #3,645 nationally) — a middle-class / working-renter tenant base. Strengths: schools A+, amenities A+, employment A+; Watch: health & safety C-, cost of living F.
- Market conditions: Rents rising fast (+4.1%/yr); 154 active listings in the ZIP; 40 comparable units currently listed for rent nearby; rentals lingering (median 44d on market — plan ~5-8 weeks vacancy on turnover, expect pricing pressure); 55% of comp listings sitting > 30 days — soft ceiling on asking rent; high-income renter base; 6,974 units permitted in Orange County in 2024 (3,839 in 5+ unit buildings).
- This rent runs 39% of the median local income ($160k/yr) — at the standard rent-burdened threshold; future hikes will face affordability resistance.
Forward outlook
- In year one you build about $67k of equity ($4k loan paydown + $62k appreciation (10.0% local appreciation)).
- Orange County population projected at +14% by 2050 — modest demand growth; plan on rents tracking national, not racing it.
- By year 2, paydown + projected appreciation supports a ~$107k cash-out refi (75% LTV) — recoverable capital for the next deal without selling this one.
Negotiation context
- It's been on market 19 days — a 2% lower offer ($616k) is reasonable based on typical stale-listing flexibility.
- 2 sale attempts since 16y ago with the ask held roughly flat each time — persistent listings suggest the price (not the market) is what's stuck; bring a comps-based counter.
Risks & watch-outs
- Climate carrying-cost: extreme-heat days projected 7→23/yr by 2055 (HVAC capex compounding) — expect insurance premiums to compound above CPI over the hold.
Questions for the listing agent
- What do current leases actually rent for vs. the listed asking? Can we see a recent rent roll and the last 12 months of T-12 income?
- Is there a deadline driving the sale (1031 exchange, divorce, estate, relocation)? That informs how much negotiation room exists.
- Schools are A-rated — typically a magnet for longer-tenancy family renters. What's the average tenant stay here, and is there a school-zone premium baked into asking?
- The area grade is low — what's the realistic commute time and amenity access for the typical tenant pool here? Any planned neighborhood developments (good or bad) we should know about?
- What's the average days-on-market for RENTAL listings here right now (not sales)? A rising rental-DOM trend means longer vacancies and softer asking-rent achievability than the comps imply.
- What's the recent tenant-quality profile in this submarket — average credit score on applications, eviction rate, late-payment / NSF rate, and stable-employment percentage? A property-management company in the area should have these aggregated.
- How much new for-sale + rental construction is in the pipeline within 1–3 miles? Heavy new supply typically softens prices + rents 12–24 months out; constrained supply supports both.
Investment metrics
- 1% rule
- 0.83% ✗
- Cap rate
- 5.87%
- Cash-on-cash
- -1.50%
- DSCR
- 0.93
- GRM
- 10.0
CMA / ARV
- ARV (on-the-fly)
- $557,568
- Comps found
- 12
Show comp detail 12 sales within ~0.75 mi
| Address | Dist | Beds/Ba | Sqft | Sold | Price | $/sf | Match |
|---|---|---|---|---|---|---|---|
| 237 Plymouth Ave | 0.11mi | 3/2.0 (+1) | 1,152 (0%) | 1mo | $630,000 | $547 | 89 |
| 265 Mayflower | 0.11mi | 2/2.0 | 1,100 (-4%) | 0mo | $370,000 | $336 | 87 |
| 77 Yorktown | 0.09mi | 2/1.0 | 1,150 (-0%) | 5mo | $369,999 | $322 | 87 |
| 129 Liberty | 0.05mi | 2/2.0 | 1,140 (-1%) | 12mo | $539,000 | $473 | 86 |
| 4 Saratoga | 0.11mi | 2/2.0 | 1,200 (+4%) | 3mo | $1,000,000 | $833 | 85 |
| 298 Lexington Cir | 0.08mi | 2/2.0 | 1,200 (+4%) | 6mo | $439,000 | $366 | 84 |
| 24 Saratoga #24 | 0.07mi | 2/2.0 | 1,100 (-4%) | 9mo | $850,000 | $773 | 82 |
| 205 Tremont Dr | 0.06mi | 3/2.0 (+1) | 1,078 (-6%) | 6mo | $649,000 | $602 | 76 |
| 61 Saratoga | 0.04mi | 2/2.0 | 1,250 (+8%) | 13mo | $845,000 | $676 | 73 |
| 294 Mayflower Dr | 0.06mi | 2/2.0 | 1,260 (+9%) | 12mo | $610,000 | $484 | 72 |
| 90 Yorktown | 0.02mi | 3/2.0 (+1) | 1,274 (+11%) | 14mo | $520,000 | $408 | 64 |
| 274 Revere Way | 0.13mi | 3/2.0 (+1) | 1,300 (+13%) | 13mo | $585,000 | $450 | 57 |
Match score weights: distance 35% · size 25% · config 20% · recency 20%. Top-matched comps best support the ARV.
Projected returns pro-forma
10.0% appreciation · 4.11% rent growth · sell at horizon
- IRR
- 23.6%
- Equity multiple
- 2.90×
- Total profit
- $332,361
- Equity at exit
- $563,050
- IRR
- 21.2%
- Equity multiple
- 6.73×
- Total profit
- $1,002,331
- Equity at exit
- $1,214,238
Cash invested: $175,000 (down + closing). Projections, not guarantees.
Landlord ↔ Tenant lean methodology
- Overall (STATE)
- 18 Strongly Tenant-Friendly
- State California
- 18 Strongly Tenant-Friendly · D+13
- County
- — inherits STATE
- City
- — inherits STATE
ZIP-level market 92660
- Home prices YoY
- 3.4%
- Rents YoY
- 4.1%
- Active inventory
- 154
- Price-to-rent
- 10.0×
Monthly cashflow live
- Estimated rent
- $5,190 high interval (Pro) →
- Mortgage (P&I)
- −$3,278
- Tax est. 1.5%
- −$781 /mo · $9,375/yr
- Insurance
- −$260
- HOA
- −$0
- Vacancy / Maint / Mgmt
- −$1,090
- Net cashflow
- $-219
Break-even live
UW: 25.0% down · 7.5% · 30yr · 1.5% tax · 5.0% vac · 8.0% maint · 8.0% mgmt
Financing live
Cash to close
- Down payment
- $156,250
- Closing costs
- $18,750
- Reserves months
- —
- Total cash needed
- —
Loan-product check · same deal, 3 products live
Conventional
25% down · 7.5% · 30yr
- Down + closing
- —
- Monthly P&I
- —
- Monthly cashflow
- —
- DSCR
- —
- Eligible?
- —
Personal DTI + credit; lowest rate.
DSCR
20% down · 8.5% · 30yr
- Down + closing
- —
- Monthly P&I
- —
- Monthly cashflow
- —
- DSCR
- —
- Eligible?
- —
No personal income docs; deal must DSCR.
Hard money
10% down · 12.0% · 12mo
- Down + closing
- —
- Monthly P&I
- —
- Monthly cashflow
- —
- DSCR
- —
- Eligible?
- —
Short-term bridge; refi at stabilization.
Rent comps 40 comps
| Address | Beds | Baths | Sqft | Rent | $/sqft | DOM | Units | Dist |
|---|---|---|---|---|---|---|---|---|
| 94 Yorktown Newport Beach, CA | 2.0 | 2.0 | 1029 | $4,250 | $4.13 | 13d | 1 | 0.05mi |
| 200 Promontory Dr W Newport Beach, CA | 1.0–2.0 | 1.0–2.0 | 1187 | $5,385 | $4.54 | 1d | 25 | 0.41mi |
| 1063 Dover Dr Newport Beach, CA | 2.0 | 2.5 | 1152 | $4,900 | $4.25 | 43d | 1 | 0.63mi |
| 212 Garnet Ave Newport Beach, CA | 2.0 | 2.0 | 791 | $5,900 | $7.46 | 43d | 1 | 0.71mi |
| 26 Villa Point Dr Newport Beach, CA | 2.0 | 2.0 | 1410 | $5,000 | $3.55 | 43d | 1 | 0.72mi |
| 113 Emerald Ave Newport Beach, CA | 3.0 | 2.0 | 1200 | $8,000 | $6.67 | 43d | 1 | 0.72mi |
| 1728 Bedford Ln Newport Beach, CA | 1.0–2.0 | 1.0–2.0 | 954 | $3,795 | $3.98 | 1d | 2 | 0.73mi |
| 120 Garnet Ave Newport Beach, CA | 2.0 | 1.0 | 850 | $5,150 | $6.06 | 43d | 1 | 0.76mi |
| 216 Agate Ave Unit 1/2 Newport Beach, CA | 1.0 | 1.0 | 767 | $4,000 | $5.22 | 43d | 1 | 0.76mi |
| 314 Ruby Ave Newport Beach, CA | 3.0 | 2.0 | 1500 | $8,000 | $5.33 | 43d | 1 | 0.78mi |
| 320 Sapphire Ave Newport Beach, CA | 2.0 | 2.0 | 1000 | $4,200 | $4.20 | 2d | 1 | 0.80mi |
| 1009 N Bay Front Newport Beach, CA | 3.0 | 2.0 | 1200 | $12,000 | $10.00 | 24d | 1 | 0.80mi |
| 312 Saint Andrews Rd Unit B Newport Beach, CA | 2.0 | 1.0 | 1000 | $4,850 | $4.85 | 43d | 1 | 0.80mi |
| 533 Saint Andrews Rd Newport Beach, CA | 2.0 | 1.0 | 980 | $3,800 | $3.88 | 2d | 1 | 0.81mi |
| 1400 Haven Pl Unit 533 Newport Beach, CA | 2.0 | 1.0 | 980 | $3,800 | $3.88 | 2d | 1 | 0.81mi |
| 880 Irvine Ave Newport Beach, CA | 2.0 | 1.0–2.0 | 704 | $3,179 | $4.51 | 1d | 99 | 0.83mi |
| 216 Collins Ave Newport Beach, CA | 3.0 | 2.0 | 1200 | $8,000 | $6.67 | 43d | 1 | 0.84mi |
| 308 Coral Ave Newport Beach, CA | 3.0 | 2.0 | 1390 | $12,000 | $8.63 | 43d | 1 | 0.85mi |
| 122 Opal Ave Unit 2 Newport Beach, CA | 2.0 | 1.0 | 700 | $4,750 | $6.79 | 18d | 1 | 0.86mi |
| 2101 E 15th St #8 Newport Beach, CA | 2.0 | 1.5 | 1025 | $4,350 | $4.24 | 43d | 1 | 0.87mi |
| 320 Villa Point Dr Newport Beach, CA | 2.0 | 2.0 | 1307 | $6,500 | $4.97 | 43d | 1 | 0.89mi |
| 208 Villa Point Dr Newport Beach, CA | 1.0 | 1.0 | 774 | $3,490 | $4.51 | 43d | 1 | 0.89mi |
| 232 Villa Point Dr Newport Beach, CA | 1.0 | 1.0 | 851 | $4,350 | $5.11 | 24d | 1 | 0.89mi |
| 207 E Edgewater Ave Newport Beach, CA | 2.0 | 2.0 | 950 | $9,000 | $9.47 | 20d | 1 | 0.90mi |
| 310 Fernando St #105 Newport Beach, CA | 2.0 | 2.0 | 1325 | $4,700 | $3.55 | 2d | 1 | 0.94mi |
| 310 Fernando St Newport Beach, OS | 2.0 | 2.0 | 1331 | $5,198 | $3.90 | 43d | 3 | 0.94mi |
| 307 Anade Ave Newport Beach, CA | 2.0 | 2.0 | 1100 | $4,750 | $4.32 | 43d | 1 | 0.97mi |
| 203 Amethyst Ave Newport Beach, CA | 3.0 | 3.0 | 1186 | $6,500 | $5.48 | 43d | 1 | 0.97mi |
| 222 Marine Ave Unit C Newport Beach, CA | 2.0 | 2.0 | 1300 | $5,800 | $4.46 | 43d | 1 | 0.98mi |
| 1510 Abalone Pl Newport Beach, CA | 1.0 | 1.0 | 750 | $3,500 | $4.67 | 43d | 1 | 0.98mi |
| 206 Adams St #1 Newport Beach, CA | 3.0 | 3.0 | 1065 | $9,000 | $8.45 | 2d | 1 | 1.03mi |
| 114 Onyx Ave Newport Beach, CA | 3.0 | 2.0 | 1050 | $6,750 | $6.43 | 43d | 1 | 1.05mi |
| 618 W Balboa Blvd Newport Beach, CA | 2.0 | 1.0 | 780 | $4,195 | $5.38 | 43d | 1 | 1.05mi |
| 1581 Tustin Ave Costa Mesa, CA | 2.0 | 2.0 | 1100 | $5,400 | $4.91 | 18d | 1 | 1.11mi |
| 384 16th Pl Unit B Costa Mesa, CA | 2.0 | 1.0 | 1015 | $4,400 | $4.33 | 43d | 1 | 1.13mi |
| 913 W Balboa Blvd Newport Beach, CA | 3.0 | 3.0 | 1423 | $8,500 | $5.97 | 16d | 1 | 1.16mi |
| 913 W Balboa Blvd Unit C Newport Beach, CA | 3.0 | 3.0 | 1423 | $8,500 | $5.97 | 7d | 1 | 1.16mi |
| 116 Jade Ave Newport Beach, CA | 2.0 | 1.5 | 1144 | $7,000 | $6.12 | 43d | 1 | 1.18mi |
| 1114 W Balboa Blvd Unit 1114 Newport Beach, CA | 2.0 | 1.0 | 800 | $3,850 | $4.81 | 24d | 1 | 1.20mi |
| 5100 Colony Plz Newport Beach, CA | 1.0–2.0 | 1.0–2.0 | 1316 | $6,260 | $4.76 | 2d | 10 | 1.20mi |
Listing history 15 events
-
2026-06-18days on market $625,000 Active 19 DOM
-
2026-06-17days on market $625,000 Active 18 DOM
-
2026-06-16days on market $625,000 Active 17 DOM
-
2026-06-15days on market $625,000 Active 16 DOM
-
2026-06-13days on market $625,000 Active 14 DOM
-
2026-06-13days on market $625,000 Active 13 DOM
-
2026-06-09days on market $625,000 Active 10 DOM
-
2026-06-08days on market $625,000 Active 9 DOM
-
2026-06-07days on market $625,000 Active 8 DOM
-
2026-06-04days on market $625,000 Active 5 DOM
-
2026-06-03days on market $625,000 Active 4 DOM
-
2026-06-02days on market $625,000 Active 3 DOM
-
2026-06-01days on market $625,000 Active 2 DOM
-
2026-05-31remarks 695-char remark
-
2026-05-31$625,000 Active 1 DOM
ⓘ Source: listings_history table (triggers on properties + properties_extension) + one-shot
backfill from property_details.listing_events for pre-trigger history.
Climate risk First Street
- Flood 1/10 Low FEMA zone X (unshaded) · 0% chance over 30 yrs
- Wildfire 1/10 Low
- Heat 5/10 Major 7 d/yr ≥82°F today · 23 d/yr by 30 yrs out
- Wind 1/10 Low
- Air quality 4/10 Moderate 6 unhealthy d/yr today · 6 by 30 yrs out
Nearby sold comps map
Loading sold comps map…
Walkable amenities ~0.75 mi
Loading nearby amenities…
Taxation est. · year 1
- Rental income
- $62,277
- − Mortgage interest
- −$35,010
- − Property taxes
- −$9,375
- − Insurance
- −$3,125
- − Repairs & maintenance
- −$4,982
- − Management
- −$4,982
- − Depreciation
- −$18,182
- Taxable loss
- −$13,379
- Est. tax savings @ 24.0%
- +$3,211
- After-tax cash flow
- $579/yr
For passive investors: Depreciation is non-cash, so a rental often shows a tax loss while cash-flowing — sheltering income. Rental losses are passive: they offset passive income freely, and up to $25,000/yr can offset ordinary (W-2) income if you actively participate and your MAGI is under $100k (phasing out to $0 by $150k); unused losses carry forward. On sale, claimed depreciation is recaptured at up to 25%, and gains may owe capital-gains tax (a 1031 exchange can defer both). Figures are a year-1 estimate at your 24.0% rate — not tax advice; consult a CPA.
Schools (NCES district)
No district data.
Livability — Newport Beach
- Score
- 76/100
- State rank
- #101
- US rank
- #3645
Category grades
Schools grade is shown separately in the Schools card above.
Census & demographics
- Census place
- Newport Beach, CA
- County
- Orange County · 3,096,323 people
- City population
- 83,845
- Metro
- Los Angeles-Long Beach-Anaheim, CA
- Population (ZIP)
- 34,890
- Household income
- $159,564
- Rent vs Own
- Severe rent burden
- 2633.0
Population outlook (Orange County) Hauer SSP2
- Today (2025)
- 3,477,456 people
- By 2030
- 3,613,117 · +3.9%
- By 2040
- 3,835,945 · +10.3%
- By 2050
- 3,968,736 · +14.1%
- By 2075
- 4,097,053 · +17.8%
- By 2100
- 3,903,633 · +12.3%
Race, ethnicity, and origin ACS 2023
- Neighborhood character
- Predominantly White (74%)
- Race & ethnicity
- White 74% Two or more races 10% Hispanic / Latino 10% Asian 9% Black 1%
- Hispanic origin (detail)
- Mexican 6%
- Common ancestry
- Italian 4% Lithuanian 3% Slovak 3%
- Foreign-born
- 16% · Canada, China, South Korea
- Languages at home
- 81% English-only · Spanish 5% Other Indo-European 5% Chinese 2%
Political lean MEDSL · Orange
- 2024 margin
- Toss-up / Even · D 49.7% · R 47.1% · Other 3.2%
- 2008→2024 swing
- +5.2pp toward D · 2008: -2.6pp · 2024: 2.6pp
- All cycles
- 2024: D+2.6 2020: D+9.0 2016: D+7.7 2012: R+8.3 2008: R+2.6
Not yet ingested
- Civics
- —
Market trends
- HPI YoY
- ▲ 17.65%
- Current HPI
- 537.8751
- Rent YoY
- ▲ 4.11%
- Metro
- Los Angeles-Long Beach-Anaheim, CA
- State GDP YoY
- ▲ 3.21%
- F500 in state
- 116
Industry mix (Fortune 500 HQ in CA)
| Industry | F500 HQs | Revenue |
|---|---|---|
| Technology | 27 | $1,492B |
|
||
| Financial Services | 3 | $174B |
|
||
| Retail | 3 | $44B |
|
||
| Insurance | 3 | $26B |
|
||
| Media / Entertainment | 2 | $115B |
|
||
| Pharmaceuticals / Biotech | 2 | $62B |
|
||
Price history
+230.9% since first listed5 events — show timeline
- 2026-05-30 Listed $625,000 CRMLS
- 2010-08-17 Listing Removed — CRMLS
- 2010-06-13 Price Changed $159,900 CRMLS
- 2010-04-24 Price Changed $179,000 CRMLS
- 2010-02-28 Listed $188,900 CRMLS
Property tax history
+3.8%/yrLatest (2025): $445 · -0.4% YoY. Source: county tax records.
Cash-flow waterfall
monthlySold comps — $/sqft
last 12 mo · ≤1 miLoading sold comps…