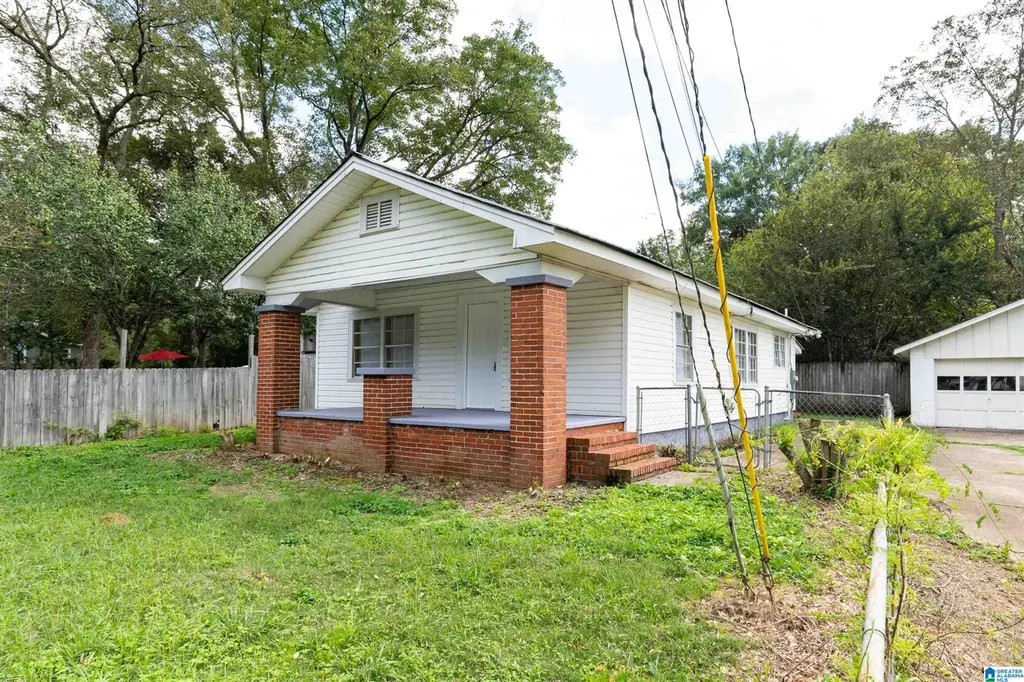
653 Sheridan Rd · Birmingham, AL
Flood risk 1/10 · Minimal
- FEMA flood zone
- X (unshaded)
- Chance of flooding over 30 yrs
- 0.0%
- Est. flood insurance / yr
- $507 – $1,088
Fire risk 4/10 · Minor
- Est. fire insurance / yr
- $916 – $1,700
Heat risk 6/10 · Moderate
- Hot days now (above 107°F)
- 7 days/yr
- Hot days in 30 yrs
- 19 days/yr
Wind risk 6/10 · Moderate
- Chance of severe wind over 30 yrs
- 27.0%
Air-quality risk 4/10 · Minor
- Unhealthy air days now
- 5 days/yr
- Unhealthy air days in 30 yrs
- 5 days/yr
Risk factors via First Street. Map © Google.
Why this score? — see what drove the C grade
The composite is a weighted blend of 9 inputs, each scored 0–100. Each bar is that input's sub-score; the figure is the points it added to the 100-point composite (weight × sub-score).
- Cash flow +25.7/30.0
- DSCR +8.6/10.0
- ARV discount +6.7/15.0
- 1% rule +6.5/10.0
- Livability +3.4/5.0
- Rent growth +2.7/5.0
- Condition / age +2.5/5.0
- Schools +0.9/10.0
- Appreciation +0.0/10.0
$110,000
🖨 Deal sheet 📄 Offer letter ✓ Due diligence
Listing remarks MLS
Come check out this beautiful 3 bedroom, 1 bath home! Featuring a fenced yard, covered front porch, 2-car detached garage and renovated with all of the extras you're looking for! Updated with modern fixtures, fresh paint are just a few things this charmer has to offer!
Key facts
- Covered front porch
- Renovated
- Fresh paint
Tags
Neighborhood map
What this means for you Summary
Snapshot
- This is a 3-bed/1.0-bath single-family listed at $110k.
Deal economics
- At list price, monthly cash flow is $263 ($3k/yr) — positive.
- The deal already cash-flows at list — no discount required.
- Meets the 1% rule at list price ($1k rent vs $110k).
- Recommended offer: $100k (9.0% below list) — sets the bar for market timing.
- Cap rate 9.2% vs local median 6.2% in Birmingham — top-decile yield for the area; either an underpriced asset or a hidden risk that comps aren't pricing in. Stress-test before assuming the spread holds.
Location & tenants
- Location reads 67/100 on livability (#78 in AL) — a middle-class / working-renter tenant base. Strengths: commute A+, cost of living A+, housing A+; Watch: amenities C-, schools F, crime F.
- Birmingham City (urban): math 4% / reading 20% proficiency, ranked #116 of 129 in AL (top 90%) — low school quality limits family demand, transient renter base, plan for 1-2y turnover; 82% free/reduced lunch — lower-income household profile, screen leases tightly.
- Market conditions: Rents flat; 116 active listings in the ZIP; 19 comparable units currently listed for rent nearby; rentals at typical pace (median 20d on market — plan ~3-4 weeks tenant-placement turnaround); 2,114 units permitted in Jefferson County in 2024 (556 in 5+ unit buildings).
Forward outlook
- Local home prices are declining (-3.0%/yr); year-one equity from $761 of loan paydown is wiped out by about $3k of value loss. Plan a longer hold.
- Jefferson County population projected to shrink 4% by 2050 — rents likely to lag national; underwrite the cash flow, not the appreciation.
Negotiation context
- It's been on market 98 days — a 9% lower offer ($100k) is reasonable based on typical stale-listing flexibility.
- 2 sale attempts since 8y ago with the ask held roughly flat each time — persistent listings suggest the price (not the market) is what's stuck; bring a comps-based counter.
- Current owner paid $92k; 19% above their basis — modest negotiation headroom, anchor on the comps not their cost.
Risks & watch-outs
- Watch-outs: built in 1940 — expect roof / HVAC / electrical / plumbing capex.
- Climate carrying-cost: major wind risk, 27% chance of damaging wind over 30y; extreme-heat days projected 7→19/yr by 2055 (HVAC capex compounding) — expect insurance premiums to compound above CPI over the hold.
Questions for the listing agent
- It's been on market 98 days. Have you received any prior offers? Is the seller open to a 9% concession, seller financing, or rate buy-down credit?
- Built in 1940 — when were the roof, HVAC, electrical panel, plumbing, and water heater last replaced?
- Why hasn't it sold? Are there any deal-killer items the seller is aware of (foundation, flood, title, zoning, code violations)?
- Is there a deadline driving the sale (1031 exchange, divorce, estate, relocation)? That informs how much negotiation room exists.
- Schools are F-rated, which usually means shorter tenancies and higher turnover. Who's the typical renter profile here, and what's been the actual vacancy rate?
- Crime grade is F in this area — have there been break-ins, vandalism, or insurance claims at this property in the last 3 years? What carrier currently insures it and at what premium?
- What's the average days-on-market for RENTAL listings here right now (not sales)? A rising rental-DOM trend means longer vacancies and softer asking-rent achievability than the comps imply.
- What's the recent tenant-quality profile in this submarket — average credit score on applications, eviction rate, late-payment / NSF rate, and stable-employment percentage? A property-management company in the area should have these aggregated.
- How much new for-sale + rental construction is in the pipeline within 1–3 miles? Heavy new supply typically softens prices + rents 12–24 months out; constrained supply supports both.
Investment metrics
- 1% rule
- 1.15% ✓
- Cap rate
- 9.16%
- Cash-on-cash
- 10.25%
- DSCR
- 1.46
- GRM
- 7.2
CMA / ARV
- ARV (median comp)
- $108,123
- List price
- $110,000
- Delta
- 1.74%
- Verdict
- FAIR
- Comps
- 20 within 1.0 mi
Show comp detail 10 sales within ~0.75 mi
| Address | Dist | Beds/Ba | Sqft | Sold | Price | $/sf | Match |
|---|---|---|---|---|---|---|---|
| 629 Lanett Ave | 0.04mi | 3/1.0 | 1,092 (-0%) | 9mo | $48,000 | $44 | 90 |
| 621 Ozark Ct | 0.18mi | 3/1.0 | 1,072 (-2%) | 15mo | $81,000 | $76 | 75 |
| 436 Henry St | 0.32mi | 3/2.0 | 1,089 (-1%) | 8mo | $75,000 | $69 | 74 |
| 320 Macon St | 0.12mi | 3/1.0 | 986 (-10%) | 5mo | $130,000 | $132 | 73 |
| 541 Telford Ln | 0.63mi | 3/1.0 | 1,080 (-2%) | 8mo | $98,000 | $91 | 62 |
| 524 Shelby St | 0.39mi | 3/2.0 | 1,159 (+6%) | 9mo | $114,000 | $98 | 61 |
| 121 Fairfax Ave | 0.22mi | 2/1.0 (-1) | 1,014 (-8%) | 20mo | $10,000 | $10 | 55 |
| 524 Piedmont Ave | 0.24mi | 3/1.0 | 1,204 (+10%) | 22mo | $91,500 | $76 | 54 |
| 17 Holt Ave | 0.27mi | 3/2.0 | 1,212 (+11%) | 14mo | $144,500 | $119 | 54 |
| 1133 Skyline Dr | 0.67mi | 3/2.0 | 1,020 (-7%) | 24mo | $110,500 | $108 | 34 |
Match score weights: distance 35% · size 25% · config 20% · recency 20%. Top-matched comps best support the ARV.
Projected returns pro-forma
-3.0% appreciation · 0.74% rent growth · sell at horizon
- IRR
- -3.4%
- Equity multiple
- 0.87×
- Total profit
- $-3,881
- Equity at exit
- $16,401
- IRR
- 3.6%
- Equity multiple
- 1.23×
- Total profit
- $7,162
- Equity at exit
- $9,511
Cash invested: $30,800 (down + closing). Projections, not guarantees.
Landlord ↔ Tenant lean methodology
- Overall (STATE)
- 90 Strongly Landlord-Friendly
- State Alabama
- 90 Strongly Landlord-Friendly · R+15
- County
- — inherits STATE
- City
- — inherits STATE
ZIP-level market 35214
- Home prices YoY
- -20.0%
- Rents YoY
- 0.7%
- Active inventory
- 116
- Price-to-rent
- 7.2×
Monthly cashflow live
- Estimated rent
- $1,268 high interval (Pro) →
- Mortgage (P&I)
- −$577
- Tax from tax record
- −$116 /mo · $1,393/yr
- Insurance
- −$46
- HOA
- −$0
- Vacancy / Maint / Mgmt
- −$266
- Net cashflow
- $263
Break-even live
UW: 25.0% down · 7.5% · 30yr · 1.5% tax · 5.0% vac · 8.0% maint · 8.0% mgmt
Financing live
Cash to close
- Down payment
- $27,500
- Closing costs
- $3,300
- Reserves months
- —
- Total cash needed
- —
Loan-product check · same deal, 3 products live
Conventional
25% down · 7.5% · 30yr
- Down + closing
- —
- Monthly P&I
- —
- Monthly cashflow
- —
- DSCR
- —
- Eligible?
- —
Personal DTI + credit; lowest rate.
DSCR
20% down · 8.5% · 30yr
- Down + closing
- —
- Monthly P&I
- —
- Monthly cashflow
- —
- DSCR
- —
- Eligible?
- —
No personal income docs; deal must DSCR.
Hard money
10% down · 12.0% · 12mo
- Down + closing
- —
- Monthly P&I
- —
- Monthly cashflow
- —
- DSCR
- —
- Eligible?
- —
Short-term bridge; refi at stabilization.
Rent comps 19 comps
| Address | Beds | Baths | Sqft | Rent | $/sqft | DOM | Units | Dist |
|---|---|---|---|---|---|---|---|---|
| 629 Lanett Ave Birmingham, AL | 3.0 | 1.0 | 1092 | $1,200 | $1.10 | 44d | 1 | 0.06mi |
| 617 Ozark Ct Birmingham, AL | 3.0 | 2.0 | 1242 | $1,195 | $0.96 | 3d | 1 | 0.20mi |
| 436 Henry St Birmingham, AL | 3.0 | 2.0 | 1159 | $1,090 | $0.94 | 44d | 1 | 0.34mi |
| 528 Lamplighter Ln Birmingham, AL | 3.0 | 1.0 | 1114 | $1,220 | $1.10 | 3d | 1 | 0.53mi |
| 225 Bayberry Rd Birmingham, AL | 3.0 | 1.0 | 1496 | $1,261 | $0.84 | 19d | 1 | 0.58mi |
| 1137 Pratt Hwy Birmingham, AL | 3.0 | 1.0 | 993 | $1,045 | $1.05 | 2d | 1 | 0.62mi |
| 1143 Oakley Dr Birmingham, AL | 3.0 | 1.0 | 1066 | $1,300 | $1.22 | 44d | 1 | 0.62mi |
| 1147 Oakley Dr Birmingham, AL | 3.0 | 1.0 | 1352 | $1,250 | $0.92 | 44d | 1 | 0.64mi |
| 1204 Pratt Hwy Birmingham, AL | 3.0 | 1.0 | 1124 | $1,125 | $1.00 | 16d | 1 | 0.67mi |
| 120 Dewberry Ln Birmingham, AL | 3.0 | 2.0 | 1485 | $1,510 | $1.02 | 19d | 1 | 0.82mi |
| 305 Rose Hill Rd Birmingham, AL | 3.0 | 1.5 | 1285 | $1,200 | $0.93 | 10d | 1 | 0.89mi |
| 115 Crabapple Ln Birmingham, AL | 1.0–3.0 | 1.0–2.0 | 906 | $1,027 | $1.13 | 11d | 19 | 0.93mi |
| 1344 Pratt Hwy Birmingham, AL | 3.0 | 2.0 | 936 | $980 | $1.05 | 44d | 1 | 1.01mi |
| 161 Cindy Ln Birmingham, AL | 3.0 | 2.0 | 1388 | $1,425 | $1.03 | 24d | 1 | 1.07mi |
| 204 5th Way Birmingham, AL | 3.0 | 1.5 | 1051 | $1,100 | $1.05 | 21d | 1 | 1.22mi |
| 315 Avenue U Birmingham, AL | 3.0 | 1.0 | 1088 | $1,200 | $1.10 | 3d | 1 | 1.32mi |
| 656 Kenwood Dr Birmingham, AL | 3.0 | 1.0 | 1252 | $1,175 | $0.94 | 16d | 1 | 1.34mi |
| 408 Miles Ave Birmingham, AL | 3.0 | 2.0 | 1377 | $1,050 | $0.76 | 21d | 1 | 1.42mi |
| 1425 Hibernian St Birmingham, AL | 3.0 | 1.0 | 1152 | $1,200 | $1.04 | 24d | 1 | 1.46mi |
Listing history 14 events
-
2026-06-10days on market $110,000 Active 98 DOM
-
2026-06-09days on market $110,000 Active 97 DOM
-
2026-06-08days on market $110,000 Active 96 DOM
-
2026-06-07days on market $110,000 Active 95 DOM
-
2026-06-03days on market $110,000 Active 91 DOM
-
2026-06-02days on market $110,000 Active 90 DOM
-
2026-06-01days on market $110,000 Active 89 DOM
-
2026-05-31days on market $110,000 Active 88 DOM
-
2026-03-04$110,000 Active 269-char remark
Show marketing remark (269 chars)
Come check out this beautiful 3 bedroom, 1 bath home! Featuring a fenced yard, covered front porch, 2-car detached garage and renovated with all of the extras you're looking for! Updated with modern fixtures, fresh paint are just a few things this charmer has to offer!
-
2018-10-16soldstatus $92,100
-
2018-10-15soldstatus $92,000 77-char remark
Show marketing remark (77 chars)
Beautiful 3BR/1BA home in Birmingham with covered front porch and fenced yard
-
2018-09-12$92,000 77-char remark
Show marketing remark (77 chars)
Beautiful 3BR/1BA home in Birmingham with covered front porch and fenced yard
-
1996-07-30soldstatus $50,000
-
1981-05-22soldstatus $28,000
ⓘ Source: listings_history table (triggers on properties + properties_extension) + one-shot
backfill from property_details.listing_events for pre-trigger history.
Tax reassessment forecast AL · Resets to sale price
- Current annual tax
- $1,393 · $116/mo
- Projected year-2 tax
- $1,393 · $116/mo
- Expected delta
- $0/yr ($0/mo · 0.0%)
ⓘ Screening estimate from a state-policy table — verify with the county assessor before closing.
Climate risk First Street
- Flood 1/10 Low FEMA zone X (unshaded) · 0% chance over 30 yrs
- Wildfire 4/10 Moderate
- Heat 6/10 Major 7 d/yr ≥107°F today · 19 d/yr by 30 yrs out
- Wind 6/10 Major 27% chance of damaging wind over 30 yrs
- Air quality 4/10 Moderate 5 unhealthy d/yr today · 5 by 30 yrs out
Nearby sold comps map
Loading sold comps map…
Walkable amenities ~0.75 mi
Loading nearby amenities…
Taxation est. · year 1
- Rental income
- $15,219
- − Mortgage interest
- −$6,162
- − Property taxes
- −$1,393
- − Insurance
- −$550
- − Repairs & maintenance
- −$1,218
- − Management
- −$1,218
- − Depreciation
- −$3,200
- Taxable income
- $1,479
- Est. tax owed @ 24.0%
- −$355
- After-tax cash flow
- $2,802/yr
For passive investors: Depreciation is non-cash, so a rental often shows a tax loss while cash-flowing — sheltering income. Rental losses are passive: they offset passive income freely, and up to $25,000/yr can offset ordinary (W-2) income if you actively participate and your MAGI is under $100k (phasing out to $0 by $150k); unused losses carry forward. On sale, claimed depreciation is recaptured at up to 25%, and gains may owe capital-gains tax (a 1031 exchange can defer both). Figures are a year-1 estimate at your 24.0% rate — not tax advice; consult a CPA.
Schools (NCES district)
- District
- Birmingham City
- NCES district ID
- 0100390
- Math proficiency
- 4% ▼ -17.00%
- Reading proficiency
- 20% ▼ -4.00%
- Median HH income
- $31,988
- Composite
- 9.49/100
- National rank
- #9850
- State rank
- #116 of 129 in AL
Livability — Birmingham
- Score
- 67/100
- State rank
- #78
- US rank
- #10412
Category grades
Schools grade is shown separately in the Schools card above.
Census & demographics
- Census place
- Birmingham, AL
- County
- Jefferson County · 527,445 people
- City population
- 210,422
- Metro
- Birmingham-Hoover, AL
- Population (ZIP)
- 17,027
- Household income
- $56,383
- Rent vs Own
- Severe rent burden
- 578.0
Population outlook (Jefferson County) Hauer SSP2
- Today (2025)
- 669,185 people
- By 2030
- 669,694 · +0.1%
- By 2040
- 661,388 · -1.2%
- By 2050
- 643,086 · -3.9%
- By 2075
- 577,267 · -13.7%
- By 2100
- 474,758 · -29.1%
Race, ethnicity, and origin ACS 2023
- Neighborhood character
- Predominantly Black (77%)
- Race & ethnicity
- Black 77% White 18% Two or more races 2%
- Foreign-born
- 1% · Canada
- Languages at home
- 98% English-only · Spanish 2%
Political lean MEDSL · Jefferson
- 2024 margin
- D (+10.4) · D 54.6% · R 44.2% · Other 1.2%
- 2008→2024 swing
- +5.4pp toward D · 2008: 5.1pp · 2024: 10.4pp
- All cycles
- 2024: D+10.4 2020: D+13.2 2016: D+7.2 2012: D+6.0 2008: D+5.1
Not yet ingested
- Civics
- —
Market trends
- HPI YoY
- ▼ -54.48%
- Current HPI
- 218.5233
- Rent YoY
- ▲ 0.74%
- Metro
- Birmingham-Hoover, AL
- State GDP YoY
- ▲ 2.94%
- F500 in state
- 4
Industry mix (Fortune 500 HQ in AL)
| Industry | F500 HQs | Revenue |
|---|---|---|
| Financial Services | 1 | $8B |
|
||
| Healthcare | 1 | $5B |
|
||
Price history
+292.9% since first listed6 events — show timeline
- 2026-03-04 Listed $110,000 Greater Alabama MLS
- 2018-10-16 Sold (Public Records) $92,100 Public Records
- 2018-10-15 Sold (MLS) $92,000 Greater Alabama MLS
- 2018-09-12 Listed $92,000 Greater Alabama MLS
- 1996-07-30 Sold (Public Records) $50,000 Public Records
- 1981-05-22 Sold (Public Records) $28,000 Public Records
Property tax history
+10.3%/yrLatest (2025): $1,393 · -0.1% YoY. Source: county tax records.
Cash-flow waterfall
monthlySold comps — $/sqft
last 12 mo · ≤1 miLoading sold comps…