8471 Bannock Cir · Burnettown, SC
Flood risk No data
- FEMA flood zone
- —
- Chance of flooding over 30 yrs
- —
- Est. flood insurance / yr
- —
Fire risk No data
- Est. fire insurance / yr
- —
Heat risk No data
- Hot days now (above threshold)
- —
- Hot days in 30 yrs
- —
Wind risk No data
- Chance of severe wind over 30 yrs
- —
Air-quality risk No data
- Unhealthy air days now
- —
- Unhealthy air days in 30 yrs
- —
Risk factors via First Street. Map © Google.
Why this score? — see what drove the D- grade
The composite is a weighted blend of 9 inputs, each scored 0–100. Each bar is that input's sub-score; the figure is the points it added to the 100-point composite (weight × sub-score).
- Appreciation +9.2/10.0
- Cash flow +6.8/30.0
- ARV discount +6.8/15.0
- Condition / age +4.0/5.0
- Schools +3.2/10.0
- Livability +3.2/5.0
- Rent growth +2.5/5.0
- 1% rule +1.9/10.0
- DSCR +1.0/10.0
$299,900
🖨 Deal sheet 📄 Offer letter ✓ Due diligence
Listing remarks
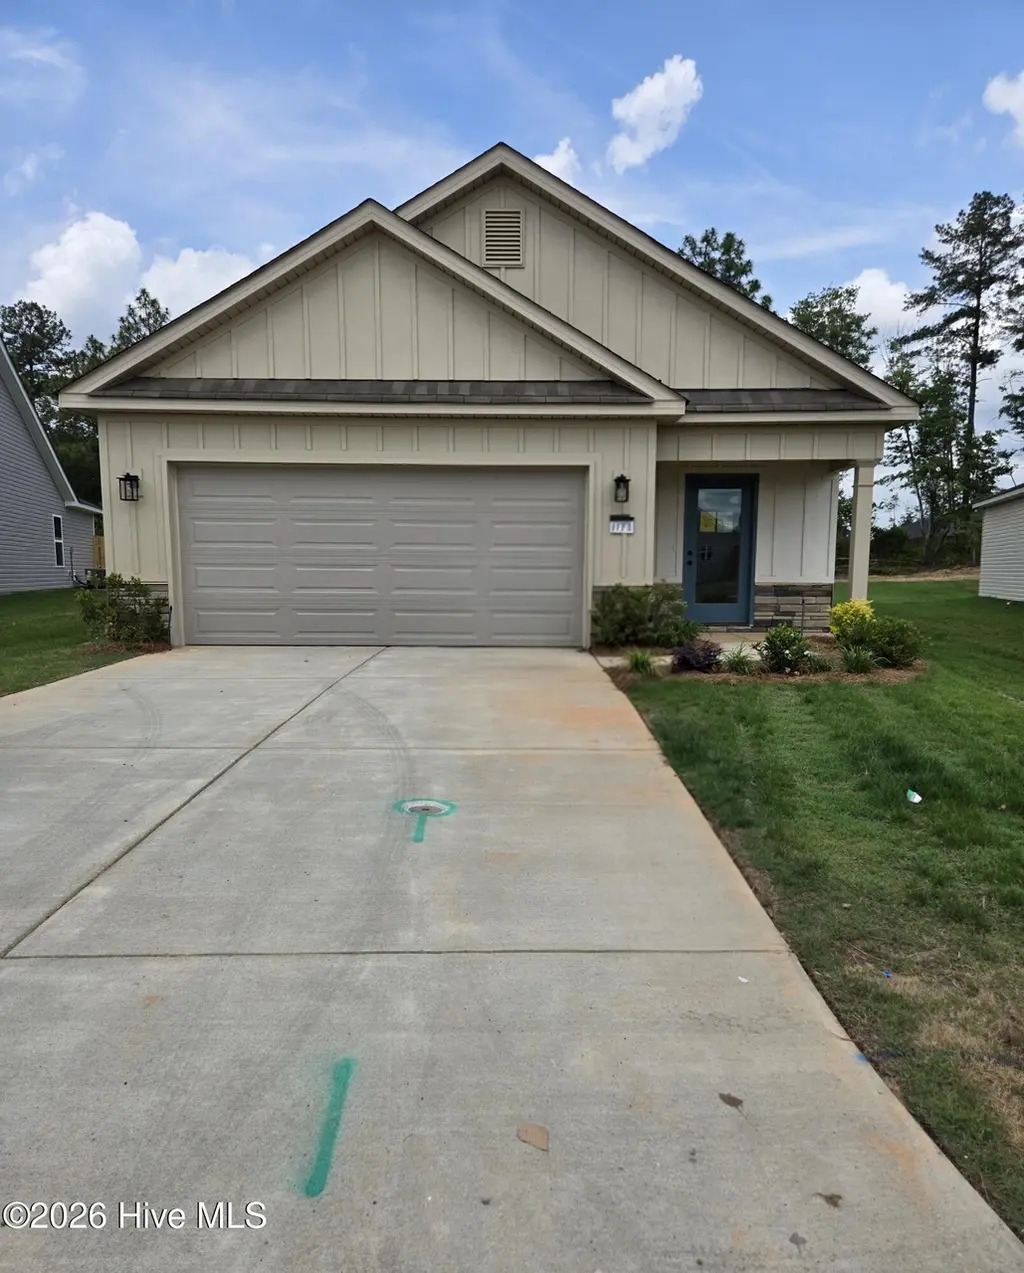
The Walker Plan by Crawford Construction is a 3-bedroom, 2-bathroom ranch-style home nestled in Clearwater Preserve neighborhood featuring a pool, pickleball courts, fire pit, nature trails, street lights, sidewalks, and pavilion, enhancing community living with recreational and outdoor amenities. This premium ranch home offers single-level convenience with upscale features like custom wood cabinets (soft-close doors/hardware), upgraded designer tile backsplash, undermounted stainless steel sink, high-end stainless-steel appliances, taller countertops (kitchen/primary bath), gas range, pot filler, and gas tankless water heater. Baths include standard-height vanities (secondary), ceramic til
Key facts
- Pickleball courts
- Community pool
- Street lights
Tags
Property features AI
Finance
- HOA & community: Homeowners association; Annual association fee; Community pool; Sidewalks; Street lights; Trails and sport court
Exterior
- Parking: Attached garage; 2 garage spaces; 2 total parking spaces; Concrete driveway; Garage door opener
- Security: Smoke detector(s)
- Utilities: Public water; Public sewer; Utilities as noted in remarks
- Home design: Single family residence; One level; Entry level on main floor
- Construction: New construction; Stone, fiber cement and vinyl siding exterior; Composition roof; Slab foundation; Built recently
- Exterior features: Covered rear porch; Front porch; Fenced yard; Landscaped yard; Sprinklers in front and rear; Paved road access; Has view
Interior
- Kitchen: Range; Dishwasher; Disposal; Tankless water heater
- Flooring: Carpet; Ceramic tile
- Bathrooms: 2 full bathrooms
- Heating & cooling: Central air; Natural gas heating; Fireplace with insert
- Interior features: Walk-in closets; Kitchen island; Pantry; Insulated windows; Smoke detectors
- Laundry & utility: Washer hookup
Neighborhood map
What this means for you Summary
Snapshot
- This is a 3-bed/2.0-bath single-family listed at $300k. Condition is rated good.
Deal economics
- At list price, monthly cash flow is $-470 ($-6k/yr) — negative.
- To cash-flow at today's rent, offer at most $232k (22.7% below list).
- To meet the 1% rule (rent ≥ 1% of price), the offer needs to be $208k (30.5% below list).
- Recommended offer: $208k (30.5% below list) — sets the bar for 1% rule.
Location & tenants
- Location reads 64/100 on livability (#159 in SC) — a middle-class / working-renter tenant base. Strengths: crime A+, cost of living A+, housing A+; Watch: amenities F, commute F, employment D-.
- Aiken 01 (suburban): math 31% / reading 44% proficiency, ranked #36 of 80 in SC (top 45%) — families likely to look elsewhere, expect single-tenant / working-renter base with shorter leases.
- Zoned schools: Clearwater Elementary (math 42% / reading 47%, grade F, #226 of 597 statewide, top 40%, 370 students, 100% FRL); Midland Valley High (math 31% / reading 83%, grade C, #120 of 196 statewide, top 64%, 1,477 students, 62% FRL) — zoned schools average 81% FRL vs 54% district-wide (27 pts higher); higher-poverty schools than district average — tighter screening recommended.
- Zoned-school proficiency averages 51% at this address vs 38% district-wide (+13 pts) — the actual schools serving this property are materially stronger than the Aiken 01 average implies; a family-tenant draw the district grade alone would hide.
- Market conditions: 299 active listings in the ZIP; 6 comparable units currently listed for rent nearby; rentals at typical pace (median 24d on market — plan ~3-4 weeks tenant-placement turnaround); solid renter incomes; 2,500 units permitted in Aiken County in 2024 (1,023 in 5+ unit buildings).
Forward outlook
- In year one you build about $27k of equity ($2k loan paydown + $25k appreciation (8.4% local appreciation)).
- Aiken County population projected at +9% by 2050 — modest demand growth; plan on rents tracking national, not racing it.
- By year 2, paydown + projected appreciation supports a ~$44k cash-out refi (75% LTV) — recoverable capital for the next deal without selling this one.
Negotiation context
- It's been on market 38 days — a 3% lower offer ($291k) is reasonable based on typical stale-listing flexibility.
- 2 sale attempts with the ask held roughly flat each time — persistent listings suggest the price (not the market) is what's stuck; bring a comps-based counter.
Questions for the listing agent
- What do current leases actually rent for vs. the listed asking? Can we see a recent rent roll and the last 12 months of T-12 income?
- It's been on market 38 days. Have you received any prior offers? Is the seller open to a 31% concession, seller financing, or rate buy-down credit?
- What does the HOA fee cover, when was the last increase, and are there any pending special assessments or reserve-fund shortfalls?
- Is there a deadline driving the sale (1031 exchange, divorce, estate, relocation)? That informs how much negotiation room exists.
- Schools are D-rated, which usually means shorter tenancies and higher turnover. Who's the typical renter profile here, and what's been the actual vacancy rate?
- The area grade is low — what's the realistic commute time and amenity access for the typical tenant pool here? Any planned neighborhood developments (good or bad) we should know about?
- What's the average days-on-market for RENTAL listings here right now (not sales)? A rising rental-DOM trend means longer vacancies and softer asking-rent achievability than the comps imply.
- What's the recent tenant-quality profile in this submarket — average credit score on applications, eviction rate, late-payment / NSF rate, and stable-employment percentage? A property-management company in the area should have these aggregated.
- How much new for-sale + rental construction is in the pipeline within 1–3 miles? Heavy new supply typically softens prices + rents 12–24 months out; constrained supply supports both.
Investment metrics
- 1% rule
- 0.69% ✗
- Cap rate
- 4.41%
- Cash-on-cash
- -6.72%
- DSCR
- 0.70
- GRM
- 12.0
CMA / ARV
- ARV (on-the-fly)
- $295,500
- Comps found
- 12
Show comp detail 12 sales within ~0.75 mi
| Address | Dist | Beds/Ba | Sqft | Sold | Price | $/sf | Match |
|---|---|---|---|---|---|---|---|
| 8088 Bannock Cir | 0.06mi | 3/2.0 | 1,501 (+0%) | 4mo | $280,900 | $187 | 94 |
| 8439 Bannock Cir | 0.03mi | 3/2.0 | 1,501 (+0%) | 9mo | $279,250 | $186 | 91 |
| 8549 Bannock Cir | 0.06mi | 3/2.0 | 1,501 (+0%) | 9mo | $287,850 | $192 | 90 |
| 8148 Bannock Cir | 0.10mi | 3/2.0 | 1,501 (+0%) | 15mo | $273,900 | $182 | 82 |
| 8468 Bannock Cir | 0.03mi | 3/2.0 | 1,358 (-10%) | 1mo | $259,900 | $191 | 82 |
| 8154 Bannock Cir | 0.11mi | 3/2.0 | 1,472 (-2%) | 14mo | $259,900 | $177 | 80 |
| 3140 Banter Dr | 0.05mi | 3/2.0 | 1,658 (+10%) | 1mo | $329,900 | $199 | 79 |
| 3094 Banter Dr | 0.05mi | 3/2.0 | 1,659 (+11%) | 5mo | $329,900 | $199 | 76 |
| 144 Williamson Dr | 0.38mi | 3/2.0 | 1,459 (-3%) | 7mo | $300,000 | $206 | 72 |
| 8371 Bannock Cir | 0.06mi | 3/2.0 | 1,284 (-14%) | 2mo | $259,900 | $202 | 71 |
| 3169 Banter Dr | 0.08mi | 3/2.0 | 1,662 (+11%) | 9mo | $350,600 | $211 | 71 |
| 8138 Bannock Cir | 0.09mi | 3/2.0 | 1,284 (-14%) | 12mo | $252,900 | $197 | 62 |
Match score weights: distance 35% · size 25% · config 20% · recency 20%. Top-matched comps best support the ARV.
Projected returns pro-forma
8.38% appreciation · 3.0% rent growth · sell at horizon
- IRR
- 15.8%
- Equity multiple
- 2.20×
- Total profit
- $100,972
- Equity at exit
- $235,640
- IRR
- 15.4%
- Equity multiple
- 4.76×
- Total profit
- $315,794
- Equity at exit
- $475,383
Cash invested: $83,972 (down + closing). Projections, not guarantees.
Landlord ↔ Tenant lean methodology
- Overall (STATE)
- 90 Strongly Landlord-Friendly
- State South Carolina
- 90 Strongly Landlord-Friendly · R+6
- County
- — inherits STATE
- City
- — inherits STATE
ZIP-level market 29829
- Home prices YoY
- 3.0%
- Active inventory
- 299
- Price-to-rent
- 12.0×
Monthly cashflow live
- Estimated rent
- $2,084 high interval (Pro) →
- Mortgage (P&I)
- −$1,573
- Tax est. 1.5%
- −$375 /mo · $4,498/yr
- Insurance
- −$125
- HOA
- −$44
- Vacancy / Maint / Mgmt
- −$438
- Net cashflow
- $-470
Break-even live
UW: 25.0% down · 7.5% · 30yr · 1.5% tax · 5.0% vac · 8.0% maint · 8.0% mgmt
Financing live
Cash to close
- Down payment
- $74,975
- Closing costs
- $8,997
- Reserves months
- —
- Total cash needed
- —
Loan-product check · same deal, 3 products live
Conventional
25% down · 7.5% · 30yr
- Down + closing
- —
- Monthly P&I
- —
- Monthly cashflow
- —
- DSCR
- —
- Eligible?
- —
Personal DTI + credit; lowest rate.
DSCR
20% down · 8.5% · 30yr
- Down + closing
- —
- Monthly P&I
- —
- Monthly cashflow
- —
- DSCR
- —
- Eligible?
- —
No personal income docs; deal must DSCR.
Hard money
10% down · 12.0% · 12mo
- Down + closing
- —
- Monthly P&I
- —
- Monthly cashflow
- —
- DSCR
- —
- Eligible?
- —
Short-term bridge; refi at stabilization.
Rent comps 6 comps
| Address | Beds | Baths | Sqft | Rent | $/sqft | DOM | Units | Dist |
|---|---|---|---|---|---|---|---|---|
| 8115 Bannock Cir Graniteville, SC | 2.0 | 2.0 | 1237 | $1,825 | $1.48 | 23d | 1 | 0.12mi |
| 8121 Bannock Cir Graniteville, SC | 2.0 | 2.0 | 1213 | $1,795 | $1.48 | 23d | 1 | 0.13mi |
| 8125 Bannock Cir Graniteville, SC | 2.0 | 2.0 | 1213 | $1,795 | $1.48 | 23d | 1 | 0.13mi |
| 8131 Bannock Cir Graniteville, SC | 2.0 | 2.0 | 1213 | $1,795 | $1.48 | 23d | 1 | 0.14mi |
| 752 Calvin TER Belvedere, SC | 2.0 | 1.0–2.0 | 783 | $1,729 | $2.21 | 14d | 25 | 1.16mi |
| 6279 Whirlaway Rd Graniteville, SC | 3.0 | 2.0 | 1295 | $1,900 | $1.47 | 21d | 1 | 1.44mi |
HOA detail
- Monthly dues
- $44 · $528/yr
- Likely covers
- watergaspool
Listing history 18 events
-
2026-06-18days on market $299,900 Active 38 DOM
-
2026-06-17days on market $299,900 Active 37 DOM
-
2026-06-16days on market $299,900 Active 36 DOM
-
2026-06-15days on market $299,900 Active 35 DOM
-
2026-06-14days on market $299,900 Active 33 DOM
-
2026-06-13days on market $299,900 Active 32 DOM
-
2026-06-10days on market $299,900 Active 30 DOM
-
2026-06-09days on market $299,900 Active 29 DOM
-
2026-06-08days on market $299,900 Active 28 DOM
-
2026-06-07days on market $299,900 Active 27 DOM
-
2026-06-03days on market $299,900 Active 23 DOM
-
2026-06-02days on market $299,900 Active 22 DOM
-
2026-06-01days on market $299,900 Active 21 DOM
-
2026-05-31days on market $299,900 Active 20 DOM
-
2026-05-30days on market $299,900 Active 19 DOM
-
2026-05-11historical
-
2026-01-20$299,900 Active
-
2026-01-20$299,900 Active
ⓘ Source: listings_history table (triggers on properties + properties_extension) + one-shot
backfill from property_details.listing_events for pre-trigger history.
Nearby sold comps map
Loading sold comps map…
Walkable amenities ~0.75 mi
Loading nearby amenities…
Taxation est. · year 1
- Rental income
- $25,005
- − Mortgage interest
- −$16,799
- − Property taxes
- −$4,498
- − Insurance
- −$1,500
- − Repairs & maintenance
- −$2,000
- − Management
- −$2,000
- − HOA
- −$528
- − Depreciation
- −$8,724
- Taxable loss
- −$11,045
- Est. tax savings @ 24.0%
- +$2,651
- After-tax cash flow
- $-2,994/yr
For passive investors: Depreciation is non-cash, so a rental often shows a tax loss while cash-flowing — sheltering income. Rental losses are passive: they offset passive income freely, and up to $25,000/yr can offset ordinary (W-2) income if you actively participate and your MAGI is under $100k (phasing out to $0 by $150k); unused losses carry forward. On sale, claimed depreciation is recaptured at up to 25%, and gains may owe capital-gains tax (a 1031 exchange can defer both). Figures are a year-1 estimate at your 24.0% rate — not tax advice; consult a CPA.
Condition & rehab AI · 1 photo
This single-family home is in good condition with a good exterior and interior. It has a good foundation and structure, and the HVAC and mechanical systems appear to be in good condition. The landscaping and curb appeal are well-maintained. Painting the exterior and landscaping improvements would be the highest-ROI updates to increase its value.
Value-add opportunities
- Both Painting the exterior — Enhances curb appeal and can increase both resale and rental value
- Both Landscaping improvements — Enhances curb appeal and can increase both resale and rental value
Renovation cost estimate screening
Value-add ROI direction
- Both Painting the exterior — Enhances curb appeal and can increase both resale and rental value ↑
- Both Landscaping improvements — Enhances curb appeal and can increase both resale and rental value ↑
ⓘ Cost ranges are severity-bucket heuristics (US national rule-of-thumb). Get contractor quotes + a written scope before underwriting a rehab budget.
Schools (NCES district)
- District
- Aiken 01
- NCES district ID
- 4500720
- Math proficiency
- 31% ▼ -11.00%
- Reading proficiency
- 44% ▼ -1.00%
- Median HH income
- $45,081
- Composite
- 31.91/100
- National rank
- #5857
- State rank
- #36 of 80 in SC
Livability — Burnettown
- Score
- 64/100
- State rank
- #159
- US rank
- #14711
Category grades
Schools grade is shown separately in the Schools card above.
Census & demographics
- Census place
- Burnettown, SC
- County
- Aiken County · 116,534 people
- City population
- 931
- Metro
- Augusta-Richmond County, GA-SC
- Population (ZIP)
- 12,385
- Household income
- $84,228
- Rent vs Own
- Severe rent burden
- 213.0
Population outlook (Aiken County) Hauer SSP2
- Today (2025)
- 178,003 people
- By 2030
- 182,876 · +2.7%
- By 2040
- 189,970 · +6.7%
- By 2050
- 193,840 · +8.9%
- By 2075
- 199,453 · +12.1%
- By 2100
- 192,403 · +8.1%
Race, ethnicity, and origin ACS 2023
- Neighborhood character
- Diverse neighborhood (Simpson 0.58)
- Race & ethnicity
- White 59% Black 26% Hispanic / Latino 12% Two or more races 9% Asian 1%
- Hispanic origin (detail)
- Mexican 8% Puerto Rican 1%
- Common ancestry
- Italian 2% Swedish 2% Slovak 1%
- Foreign-born
- 6% · Canada
- Languages at home
- 89% English-only · Spanish 10% Other Indo-European 1%
Political lean MEDSL · Aiken
- 2024 margin
- Strong R (+25.9) · D 36.4% · R 62.2% · Other 1.4%
- 2008→2024 swing
- -1.9pp toward R · 2008: -24.0pp · 2024: -25.9pp
- All cycles
- 2024: R+25.9 2020: R+22.7 2016: R+27.5 2012: R+26.0 2008: R+24.0
Not yet ingested
- Civics
- —
Market trends
- HPI YoY
- ▲ 8.38%
- Current HPI
- 286.4155
- Rent YoY
- —
- Metro
- Augusta-Richmond County, GA-SC
- State GDP YoY
- ▲ 4.51%
- F500 in state
- 2
Industry mix (Fortune 500 HQ in SC)
| Industry | F500 HQs | Revenue |
|---|---|---|
| Packaging | 1 | $7B |
|
||
Price history
+0.0% since first listed3 events — show timeline
- 2026-05-11 Listing Removed — Hive MLS
- 2026-01-20 Listed $299,900 Hive MLS
- 2026-01-20 Listed $299,900 Hive MLS
Cash-flow waterfall
monthlySold comps — $/sqft
last 12 mo · ≤1 miLoading sold comps…