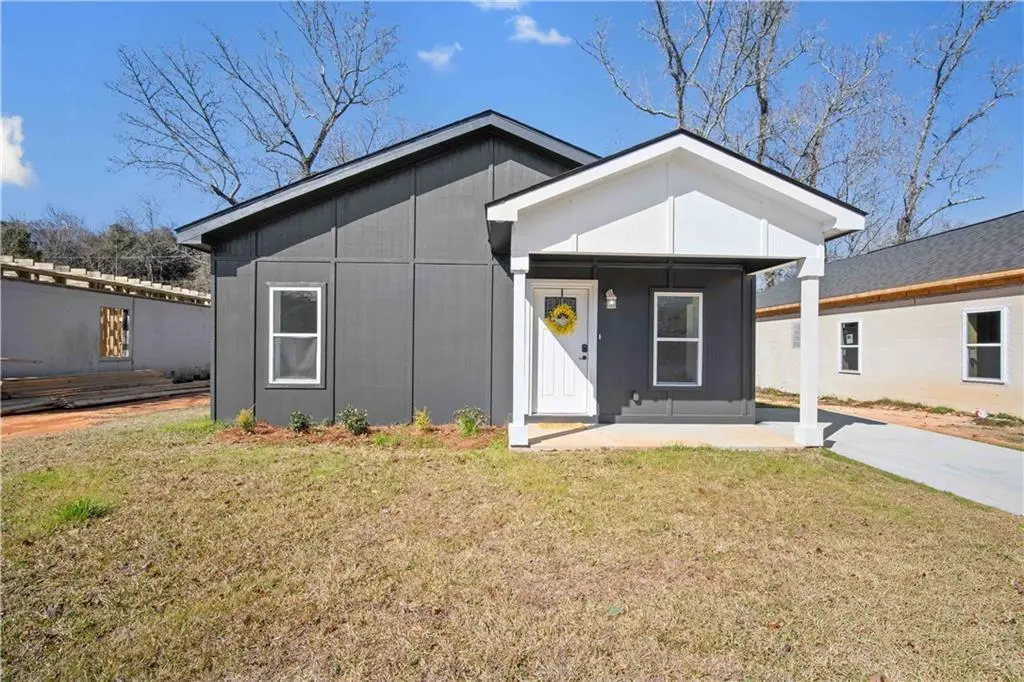
507 Yukers St · Mobile, AL
Flood risk 1/10 · Minimal
- FEMA flood zone
- X (unshaded)
- Chance of flooding over 30 yrs
- 0.0%
- Est. flood insurance / yr
- $507 – $1,088
Fire risk 1/10 · Minimal
- Est. fire insurance / yr
- $916 – $1,700
Heat risk 9/10 · Severe
- Hot days now (above 104°F)
- 7 days/yr
- Hot days in 30 yrs
- 21 days/yr
Wind risk 9/10 · Severe
- Chance of severe wind over 30 yrs
- 99.0%
Air-quality risk 2/10 · Minimal
- Unhealthy air days now
- 1 days/yr
- Unhealthy air days in 30 yrs
- 1 days/yr
Risk factors via First Street. Map © Google.
Why this score? — see what drove the C grade
The composite is a weighted blend of 9 inputs, each scored 0–100. Each bar is that input's sub-score; the figure is the points it added to the 100-point composite (weight × sub-score).
- Cash flow +19.6/30.0
- ARV discount +7.5/15.0
- Appreciation +7.4/10.0
- DSCR +6.2/10.0
- 1% rule +3.8/10.0
- Livability +3.8/5.0
- Rent growth +2.5/5.0
- Condition / age +2.5/5.0
- Schools +2.3/10.0
$149,999
🖨 Deal sheet 📄 Offer letter ✓ Due diligence
Listing remarks
Modern construction with stylish curb appeal and thoughtful design throughout. This beautifully crafted home features a striking dark exterior with crisp white trim, covered front porch, and clean contemporary lines. The open-concept layout offers comfortable living with abundant natural light, energy-efficient features, and low-maintenance finishes. Convenient driveway parking and a spacious yard provide plenty of outdoor potential. Perfect for first-time buyers, downsizing, or investment opportunities. Come see why this home feels just right—schedule your showing today! Must contact selling agent for appointments. Buyer to verify all information deemed important during the due dilig
Key facts
- Covered front porch
- Spacious yard
- Driveway parking
Tags
Property features AI
Exterior
- Parking: Driveway; Parking for 2 vehicles
- Utilities: Electricity available (110 volts); Public sewer
- Home design: Single Family Residence; Residential property; View available
- Construction: Built in 1969; Other construction materials; Shingle roof; Slab foundation
- Exterior features: No notable exterior features listed; No fencing; No pool or spa
Interior
- Kitchen: White cabinets; Stone counters; Dishwasher; Electric oven; Microwave
- Bedrooms: 3 bedrooms
- Flooring: Carpet
- Bathrooms: 2 full bathrooms
- Heating & cooling: Central heating (electric); Central air; Ceiling fan(s)
- Interior features: Other; Open floorplan
- Laundry & utility: Electric water heater
Neighborhood map
What this means for you Summary
Snapshot
- This is a 3-bed/1.0-bath single-family listed at $150k.
Deal economics
- At list price, monthly cash flow is $172 ($2k/yr) — positive.
- The deal already cash-flows at list — no discount required.
- To meet the 1% rule (rent ≥ 1% of price), the offer needs to be $133k (11.5% below list).
- Recommended offer: $133k (11.5% below list) — sets the bar for 1% rule.
Location & tenants
- Location reads 75/100 on livability (#20 in AL, #4,262 nationally) — a middle-class / working-renter tenant base. Strengths: commute A+, cost of living A+, housing A+; Watch: crime F, employment D-.
- Mobile County (urban): math 15% / reading 39% proficiency, ranked #81 of 129 in AL (top 63%) — low school quality limits family demand, transient renter base, plan for 1-2y turnover; 67% free/reduced lunch — lower-income household profile, screen leases tightly.
- Zoned schools: Florence Howard Elementary School (math 2% / reading 22%, grade F, #536 of 627 statewide, top 88%, 488 students, 94% FRL); John L Leflore Magnet School (math 2% / reading 2%, grade F, #291 of 305 statewide, top 100%, 618 students, 84% FRL) — zoned schools average 89% FRL vs 67% district-wide (22 pts higher); higher-poverty schools than district average — tighter screening recommended.
- Zoned-school proficiency averages 7% at this address vs 27% district-wide (-20 pts) — the specific schools serving this property underperform the Mobile County average; the district grade overstates school quality for this exact location.
- Market conditions: 40 active listings in the ZIP; 7 comparable units currently listed for rent nearby; rentals lingering (median 44d on market — plan ~5-8 weeks vacancy on turnover, expect pricing pressure); 57% of comp listings sitting > 30 days — soft ceiling on asking rent; 1,678 units permitted in Mobile County in 2024 (264 in 5+ unit buildings).
Forward outlook
- In year one you build about $8k of equity ($1k loan paydown + $7k appreciation (4.8% local appreciation)).
- Mobile County population projected to shrink 8% by 2050 — rents likely to lag national; underwrite the cash flow, not the appreciation.
- At projected returns (4.8% appreciation + 3.0% rent growth), your $42k cash investment doubles in ~4 years — after that, you're playing with house money.
- By year 5, paydown + projected appreciation supports a ~$36k cash-out refi (75% LTV) — recoverable capital for the next deal without selling this one.
Negotiation context
- It's been on market 27 days — a 2% lower offer ($148k) is reasonable based on typical stale-listing flexibility.
- 2 sale attempts with the ask held roughly flat each time — persistent listings suggest the price (not the market) is what's stuck; bring a comps-based counter.
- Current owner paid $54k; list at $150k implies a 178% gain — meaningful room to come down on a strong offer.
Risks & watch-outs
- Climate carrying-cost: severe wind risk, 99% chance of damaging wind over 30y; extreme-heat days projected 7→21/yr by 2055 (HVAC capex compounding) — expect insurance premiums to compound above CPI over the hold.
Questions for the listing agent
- Built in 1969 — when were the roof, HVAC, electrical panel, plumbing, and water heater last replaced?
- Is there a deadline driving the sale (1031 exchange, divorce, estate, relocation)? That informs how much negotiation room exists.
- Schools are D-rated, which usually means shorter tenancies and higher turnover. Who's the typical renter profile here, and what's been the actual vacancy rate?
- Crime grade is F in this area — have there been break-ins, vandalism, or insurance claims at this property in the last 3 years? What carrier currently insures it and at what premium?
- What's the average days-on-market for RENTAL listings here right now (not sales)? A rising rental-DOM trend means longer vacancies and softer asking-rent achievability than the comps imply.
- What's the recent tenant-quality profile in this submarket — average credit score on applications, eviction rate, late-payment / NSF rate, and stable-employment percentage? A property-management company in the area should have these aggregated.
- How much new for-sale + rental construction is in the pipeline within 1–3 miles? Heavy new supply typically softens prices + rents 12–24 months out; constrained supply supports both.
Investment metrics
- 1% rule
- 0.88% ✗
- Cap rate
- 7.67%
- Cash-on-cash
- 4.91%
- DSCR
- 1.22
- GRM
- 9.4
CMA / ARV
- ARV (on-the-fly)
- $95,256
- Comps found
- 11
Show comp detail 11 sales within ~0.75 mi
| Address | Dist | Beds/Ba | Sqft | Sold | Price | $/sf | Match |
|---|---|---|---|---|---|---|---|
| 511 Yukers St | 0.02mi | 3/2.0 | 1,176 (0%) | 7mo | $150,000 | $128 | 89 |
| 508 Avondale Ct | 0.20mi | 3/1.5 | 1,165 (-1%) | 22mo | $94,250 | $81 | 69 |
| 315 Oak Dr | 0.31mi | 3/1.5 | 1,140 (-3%) | 13mo | $65,000 | $57 | 68 |
| 2007 Carstens Ct | 0.29mi | 3/1.5 | 1,206 (+3%) | 19mo | $95,150 | $79 | 64 |
| 284 Magnolia Dr | 0.42mi | 3/2.0 | 1,263 (+7%) | 6mo | $190,000 | $150 | 58 |
| 2024 Mott Dr W | 0.55mi | 2/1.0 (-1) | 1,070 (-9%) | 0mo | $38,500 | $36 | 54 |
| 1863 St Stephens Ct | 0.56mi | 3/2.0 | 1,157 (-2%) | 17mo | $80,000 | $69 | 53 |
| 400 Short St Charles Ave | 0.43mi | 4/1.0 (+1) | 1,320 (+12%) | 4mo | $31,000 | $23 | 51 |
| 1869 S Mott Dr | 0.56mi | 3/1.0 | 1,076 (-8%) | 13mo | $95,000 | $88 | 48 |
| 1851 Seale St | 0.63mi | 4/1.0 (+1) | 1,222 (+4%) | 22mo | $122,500 | $100 | 41 |
| 1854 St Stephens Ct | 0.51mi | 4/2.0 (+1) | 1,350 (+15%) | 14mo | $148,000 | $110 | 31 |
Match score weights: distance 35% · size 25% · config 20% · recency 20%. Top-matched comps best support the ARV.
Projected returns pro-forma
4.78% appreciation · 3.0% rent growth · sell at horizon
- IRR
- 16.5%
- Equity multiple
- 2.04×
- Total profit
- $43,541
- Equity at exit
- $82,977
- IRR
- 16.9%
- Equity multiple
- 3.93×
- Total profit
- $122,959
- Equity at exit
- $141,560
Cash invested: $42,000 (down + closing). Projections, not guarantees.
Landlord ↔ Tenant lean methodology
- Overall (STATE)
- 90 Strongly Landlord-Friendly
- State Alabama
- 90 Strongly Landlord-Friendly · R+15
- County
- — inherits STATE
- City
- — inherits STATE
ZIP-level market 36617
- Home prices YoY
- 3.9%
- Active inventory
- 40
- Price-to-rent
- 9.4×
Monthly cashflow live
- Estimated rent
- $1,327 high interval (Pro) →
- Mortgage (P&I)
- −$787
- Tax from tax record
- −$28 /mo · $330/yr
- Insurance
- −$62
- HOA
- −$0
- Vacancy / Maint / Mgmt
- −$279
- Net cashflow
- $172
Break-even live
UW: 25.0% down · 7.5% · 30yr · 1.5% tax · 5.0% vac · 8.0% maint · 8.0% mgmt
Financing live
Cash to close
- Down payment
- $37,500
- Closing costs
- $4,500
- Reserves months
- —
- Total cash needed
- —
Loan-product check · same deal, 3 products live
Conventional
25% down · 7.5% · 30yr
- Down + closing
- —
- Monthly P&I
- —
- Monthly cashflow
- —
- DSCR
- —
- Eligible?
- —
Personal DTI + credit; lowest rate.
DSCR
20% down · 8.5% · 30yr
- Down + closing
- —
- Monthly P&I
- —
- Monthly cashflow
- —
- DSCR
- —
- Eligible?
- —
No personal income docs; deal must DSCR.
Hard money
10% down · 12.0% · 12mo
- Down + closing
- —
- Monthly P&I
- —
- Monthly cashflow
- —
- DSCR
- —
- Eligible?
- —
Short-term bridge; refi at stabilization.
Rent comps 7 comps
| Address | Beds | Baths | Sqft | Rent | $/sqft | DOM | Units | Dist |
|---|---|---|---|---|---|---|---|---|
| 510 Schwartz St Mobile, AL | 3.0 | 2.0 | 1288 | $1,400 | $1.09 | 13d | 1 | 0.76mi |
| 402 Havens St Mobile, AL | 4.0 | 2.0 | 960 | $1,350 | $1.41 | 13d | 1 | 1.08mi |
| 423 Devon Dr Mobile, AL | 3.0 | 1.0 | 1220 | $950 | $0.78 | 43d | 1 | 1.21mi |
| 305 Indian Creek Dr E Unit 1043809P Mobile, AL | 3.0 | 2.5 | 1496 | $3,985 | $2.66 | 13d | 1 | 1.27mi |
| 519 Bay Bridge Rd Unit B Prichard, AL | 2.0 | 1.0 | 1000 | $925 | $0.93 | 43d | 1 | 1.39mi |
| 38 Flock Ave Mobile, AL | 2.0 | 1.0 | 849 | $795 | $0.94 | 43d | 1 | 1.46mi |
| 186 Stanton Rd Mobile, AL | 1.0–3.0 | 1.0–2.5 | 1263 | $2,450 | $1.94 | 43d | 1 | 1.48mi |
Listing history 25 events
-
2026-06-18days on market $149,999 Active 27 DOM
-
2026-06-17days on market $149,999 Active 26 DOM
-
2026-06-16days on market $149,999 Active 25 DOM
-
2026-06-15days on market $149,999 Active 24 DOM
-
2026-06-14days on market $149,999 Active 22 DOM
-
2026-06-13days on market $149,999 Active 21 DOM
-
2026-06-10days on market $149,999 Active 19 DOM
-
2026-06-09days on market $149,999 Active 18 DOM
-
2026-06-08days on market $149,999 Active 17 DOM
-
2026-06-07days on market $149,999 Active 16 DOM
-
2026-06-05days on market $149,999 Active 13 DOM
-
2026-06-03days on market $149,999 Active 12 DOM
-
2026-06-02days on market $149,999 Active 11 DOM
-
2026-06-01days on market $149,999 Active 10 DOM
-
2026-05-31days on market $149,999 Active 9 DOM
-
2026-05-30days on market $149,999 Active 8 DOM
-
2026-05-22status Active
-
2026-05-21historical
-
2026-05-21$149,999 Active
-
2026-03-04price $139,900
-
2026-01-12price $145,000
-
2025-10-24price $149,900
-
2025-05-01soldstatus $54,000
-
2025-04-30soldstatus $54,000
-
2022-09-30soldstatus $120,000
ⓘ Source: listings_history table (triggers on properties + properties_extension) + one-shot
backfill from property_details.listing_events for pre-trigger history.
Tax reassessment forecast AL · Resets to sale price
- Current annual tax
- $330 · $28/mo
- Projected year-2 tax
- $615 · $51/mo
- Expected delta
- +$285/yr (+$24/mo · 86.2%)
ⓘ Screening estimate from a state-policy table — verify with the county assessor before closing.
Climate risk First Street
- Flood 1/10 Low FEMA zone X (unshaded) · 0% chance over 30 yrs
- Wildfire 1/10 Low
- Heat 9/10 Extreme 7 d/yr ≥104°F today · 21 d/yr by 30 yrs out
- Wind 9/10 Extreme 99% chance of damaging wind over 30 yrs
- Air quality 2/10 Low 1 unhealthy d/yr today · 1 by 30 yrs out
Nearby sold comps map
Loading sold comps map…
Walkable amenities ~0.75 mi
Loading nearby amenities…
Taxation est. · year 1
- Rental income
- $15,927
- − Mortgage interest
- −$8,402
- − Property taxes
- −$330
- − Insurance
- −$750
- − Repairs & maintenance
- −$1,274
- − Management
- −$1,274
- − Depreciation
- −$4,364
- Taxable loss
- −$467
- Est. tax savings @ 24.0%
- +$112
- After-tax cash flow
- $2,175/yr
For passive investors: Depreciation is non-cash, so a rental often shows a tax loss while cash-flowing — sheltering income. Rental losses are passive: they offset passive income freely, and up to $25,000/yr can offset ordinary (W-2) income if you actively participate and your MAGI is under $100k (phasing out to $0 by $150k); unused losses carry forward. On sale, claimed depreciation is recaptured at up to 25%, and gains may owe capital-gains tax (a 1031 exchange can defer both). Figures are a year-1 estimate at your 24.0% rate — not tax advice; consult a CPA.
Schools (NCES district)
- District
- Mobile County
- NCES district ID
- 0102370
- Math proficiency
- 15% ▼ -28.00%
- Reading proficiency
- 39% ▬ 0.00%
- Median HH income
- $42,455
- Composite
- 22.9/100
- National rank
- #8002
- State rank
- #81 of 129 in AL
Livability — Mobile
- Score
- 75/100
- State rank
- #20
- US rank
- #4262
Category grades
Schools grade is shown separately in the Schools card above.
Census & demographics
- Census place
- Mobile, AL
- City population
- 205,729
- Population (ZIP)
- 11,952
Population outlook (Mobile County) Hauer SSP2
- Today (2025)
- 415,303 people
- By 2030
- 411,755 · -0.9%
- By 2040
- 399,670 · -3.8%
- By 2050
- 382,616 · -7.9%
- By 2075
- 337,353 · -18.8%
- By 2100
- 283,391 · -31.8%
Race, ethnicity, and origin ACS 2023
- Neighborhood character
- Predominantly Black (97%)
- Race & ethnicity
- Black 97% White 2%
- Foreign-born
- 0%
Political lean MEDSL · Mobile
- 2024 margin
- R (+16.4) · D 41.3% · R 57.7%
- 2008→2024 swing
- -7.7pp toward R · 2008: -8.7pp · 2024: -16.4pp
- All cycles
- 2024: R+16.4 2020: R+11.9 2016: R+13.9 2012: R+9.3 2008: R+8.7
Not yet ingested
- Civics
- —
Market trends
- HPI YoY
- ▲ 4.78%
- Current HPI
- 128.8377
- Rent YoY
- —
- Metro
- —
- State GDP YoY
- ▲ 2.94%
- F500 in state
- 4
Industry mix (Fortune 500 HQ in AL)
| Industry | F500 HQs | Revenue |
|---|---|---|
| Financial Services | 1 | $8B |
|
||
| Healthcare | 1 | $5B |
|
||
Price history
+25.0% since first listed9 events — show timeline
- 2026-05-22 Relisted — GCMLS AL
- 2026-05-21 Delisted — GCMLS AL
- 2026-05-21 Listed $149,999 GCMLS AL
- 2026-03-04 Price Changed $139,900 GCMLS AL
- 2026-01-12 Price Changed $145,000 GCMLS AL
- 2025-10-24 Price Changed $149,900 GCMLS AL
- 2025-05-01 Sold (Public Records) $54,000 Public Records
- 2025-04-30 Sold (Public Records) $54,000 Public Records
- 2022-09-30 Sold (Public Records) $120,000 Public Records
Property tax history
+7.3%/yrLatest (2025): $330 · +7.0% YoY. Source: county tax records.
Cash-flow waterfall
monthlySold comps — $/sqft
last 12 mo · ≤1 miLoading sold comps…