10212 E State Road 156 · Vevay, IN
Flood risk 10/10 · Severe
- FEMA flood zone
- AE
- Chance of flooding over 30 yrs
- 0.99%
- Est. flood insurance / yr
- $1,737 – $8,500
Fire risk 1/10 · Minimal
- Est. fire insurance / yr
- $717 – $1,331
Heat risk 4/10 · Minor
- Hot days now (above 104°F)
- 7 days/yr
- Hot days in 30 yrs
- 19 days/yr
Wind risk 2/10 · Minimal
- Chance of severe wind over 30 yrs
- 1.0%
Air-quality risk 2/10 · Minimal
- Unhealthy air days now
- 1 days/yr
- Unhealthy air days in 30 yrs
- 2 days/yr
Risk factors via First Street. Map © Google.
Why this score? — see what drove the B grade
The composite is a weighted blend of 9 inputs, each scored 0–100. Each bar is that input's sub-score; the figure is the points it added to the 100-point composite (weight × sub-score).
- Cash flow +30.0/30.0
- 1% rule +10.0/10.0
- DSCR +10.0/10.0
- Appreciation +9.1/10.0
- ARV discount +4.2/15.0
- Livability +3.0/5.0
- Rent growth +2.5/5.0
- Condition / age +2.5/5.0
- Schools +2.4/10.0
$94,900
🖨 Deal sheet 📄 Offer letter ✓ Due diligence
Listing remarks
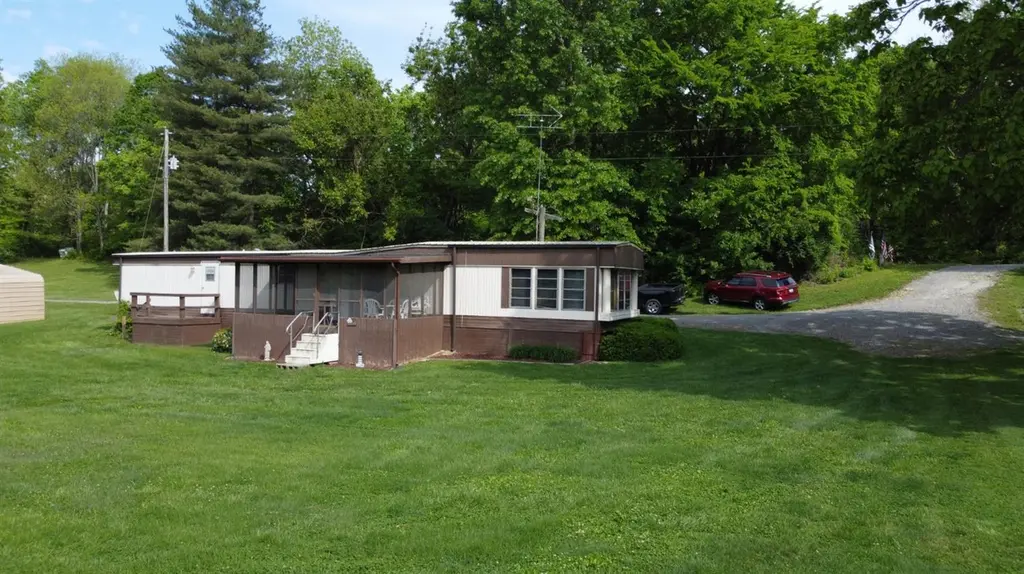
Looking for your river escape? This 2+ acre property is set up for weekend enjoyment. Property includes a partially furnished well maintained single wide that has 3 bedrooms and a full bath, newer roof and heat pump. Home comes partially furnished, purchase this home and bring your suitcase and stay the very first night! Outside is where you will be, sitting on the screened porch or enjoying the large yard space. Property has two carports along with two storage sheds, an outdoor bathroom and shower and a shared shelter house. Located just minutes from Vevay, Indiana. Call today, don't let the river pass you by!
Key facts
- Large yard space
- Two carports
- Screened porch
Tags
Property features AI
Exterior
- Parking: Gravel parking
- Utilities: Public water; Septic tank sewer
- Home design: Single-family residence; One story
- Construction: Aluminum siding
- Exterior features: Metal roof; Shed(s) on the property; Level lot; Waterfront lot with view
Interior
- Kitchen: Range; Oven; Refrigerator; Dishwasher not listed
- Bathrooms: One full bathroom
- Heating & cooling: Heat pump heating; Central air conditioning
- Interior features: Five total rooms; Electric water heater
- Laundry & utility: Washer and Dryer included
Neighborhood map
What this means for you Summary
Snapshot
- This is a 3-bed/2.0-bath manufactured listed at $95k.
Deal economics
- At list price, monthly cash flow is $182 ($2k/yr) — positive.
- The deal already cash-flows at list — no discount required.
- Meets the 1% rule at list price ($2k rent vs $95k).
- Recommended offer: $92k (3.0% below list) — sets the bar for market timing.
Location & tenants
- Location reads 59/100 on livability (#555 in IN) — a working-class tenant base; expect higher turnover. Strengths: crime A+, cost of living A+, housing A+; Watch: amenities F, commute F, employment F.
- Switzerland County School Corporation (rural): math 25% / reading 31% proficiency, ranked #254 of 301 in IN (top 84%) — low school quality limits family demand, transient renter base, plan for 1-2y turnover.
- Zoned schools: Jefferson-Craig Elementary School (math 30% / reading 31%, grade F, #688 of 994 statewide, top 70%, 412 students, 58% FRL).
- Market conditions: 35 active listings in the ZIP; 80 units permitted in Switzerland County in 2024 (0 in 5+ unit buildings).
Forward outlook
- In year one you build about $8k of equity ($656 loan paydown + $8k appreciation (8.2% local appreciation)).
- Switzerland County population projected at -14% by 2050 — secular population decline; favor cash flow + early exit over multi-decade hold.
- At projected returns (8.2% appreciation + 3.0% rent growth), your $27k cash investment doubles in ~3 years — after that, you're playing with house money.
- By year 5, paydown + projected appreciation supports a ~$38k cash-out refi (75% LTV) — recoverable capital for the next deal without selling this one.
Negotiation context
- It's been on market 45 days — a 3% lower offer ($92k) is reasonable based on typical stale-listing flexibility.
Risks & watch-outs
- Watch-outs: flood insurance adds $427/mo.
- Climate carrying-cost: in FEMA flood zone AE (mandatory federal flood insurance) — expect insurance premiums to compound above CPI over the hold.
Questions for the listing agent
- It's been on market 45 days. Have you received any prior offers? Is the seller open to a 3% concession, seller financing, or rate buy-down credit?
- Built in 1977 — when were the roof, HVAC, electrical panel, plumbing, and water heater last replaced?
- What's the actual annual flood-insurance premium (NFIP or private), and is the property in a SFHA with mandatory coverage?
- Is there a deadline driving the sale (1031 exchange, divorce, estate, relocation)? That informs how much negotiation room exists.
- Schools are D-rated, which usually means shorter tenancies and higher turnover. Who's the typical renter profile here, and what's been the actual vacancy rate?
- What's the average days-on-market for RENTAL listings here right now (not sales)? A rising rental-DOM trend means longer vacancies and softer asking-rent achievability than the comps imply.
- What's the recent tenant-quality profile in this submarket — average credit score on applications, eviction rate, late-payment / NSF rate, and stable-employment percentage? A property-management company in the area should have these aggregated.
- How much new for-sale + rental construction is in the pipeline within 1–3 miles? Heavy new supply typically softens prices + rents 12–24 months out; constrained supply supports both.
Investment metrics
- 1% rule
- 1.59% ✓
- Cap rate
- 13.98%
- Cash-on-cash
- 27.46%
- DSCR
- 2.22
- GRM
- 5.3
CMA / ARV
- ARV (median comp)
- $88,342
- List price
- $94,900
- Delta
- 7.42%
- Verdict
- FAIR
- Comps
- 1 within 2.0 mi
Projected returns pro-forma
8.15% appreciation · 3.0% rent growth · sell at horizon
- IRR
- 26.7%
- Equity multiple
- 2.95×
- Total profit
- $51,792
- Equity at exit
- $73,047
- IRR
- 24.0%
- Equity multiple
- 6.35×
- Total profit
- $142,202
- Equity at exit
- $145,913
Cash invested: $26,572 (down + closing). Projections, not guarantees.
Landlord ↔ Tenant lean methodology
- Overall (STATE)
- 90 Strongly Landlord-Friendly
- State Indiana
- 90 Strongly Landlord-Friendly · R+11
- County
- — inherits STATE
- City
- — inherits STATE
ZIP-level market 47043
- Home prices YoY
- 4.0%
- Active inventory
- 35
- Price-to-rent
- 5.3×
Monthly cashflow live
- Estimated rent
- $1,506 medium interval (Pro) →
- Mortgage (P&I)
- −$498
- Tax from tax record
- −$44 /mo · $529/yr
- Insurance
- −$40
- Flood insurance flood zone
- −$427 /mo · $5,118/yr
- HOA
- −$0
- Vacancy / Maint / Mgmt
- −$316
- Net cashflow
- $182
Break-even live
UW: 25.0% down · 7.5% · 30yr · 1.5% tax · 5.0% vac · 8.0% maint · 8.0% mgmt
Financing live
Cash to close
- Down payment
- $23,725
- Closing costs
- $2,847
- Reserves months
- —
- Total cash needed
- —
Loan-product check · same deal, 3 products live
Conventional
25% down · 7.5% · 30yr
- Down + closing
- —
- Monthly P&I
- —
- Monthly cashflow
- —
- DSCR
- —
- Eligible?
- —
Personal DTI + credit; lowest rate.
DSCR
20% down · 8.5% · 30yr
- Down + closing
- —
- Monthly P&I
- —
- Monthly cashflow
- —
- DSCR
- —
- Eligible?
- —
No personal income docs; deal must DSCR.
Hard money
10% down · 12.0% · 12mo
- Down + closing
- —
- Monthly P&I
- —
- Monthly cashflow
- —
- DSCR
- —
- Eligible?
- —
Short-term bridge; refi at stabilization.
Listing history 18 events
-
2026-06-18days on market $94,900 Active 45 DOM
-
2026-06-17days on market $94,900 Active 44 DOM
-
2026-06-16days on market $94,900 Active 43 DOM
-
2026-06-15days on market $94,900 Active 42 DOM
-
2026-06-13days on market $94,900 Active 40 DOM
-
2026-06-12remarks 618-char remark
-
2026-06-12days on market $94,900 Active 39 DOM
-
2026-06-09days on market $94,900 Active 36 DOM
-
2026-06-08days on market $94,900 Active 35 DOM
-
2026-06-07remarks 598-char remark
-
2026-06-07pricedays on market $94,900 Active 34 DOM
-
2026-06-07days on market $99,900 Active 33 DOM
-
2026-06-04days on market $99,900 Active 30 DOM
-
2026-06-02days on market $99,900 Active 29 DOM
-
2026-06-01days on market $99,900 Active 28 DOM
-
2026-05-31days on market $99,900 Active 27 DOM
-
2026-05-31days on market $99,900 Active 26 DOM
-
2026-05-04$99,900 Active 492-char remark
ⓘ Source: listings_history table (triggers on properties + properties_extension) + one-shot
backfill from property_details.listing_events for pre-trigger history.
Tax reassessment forecast IN · Partial reset (capped growth)
- Current annual tax
- $529 · $44/mo
- Projected year-2 tax
- $668 · $56/mo
- Expected delta
- +$139/yr (+$12/mo · 26.2%)
ⓘ Screening estimate from a state-policy table — verify with the county assessor before closing.
Climate risk First Street
- Flood 10/10 Extreme FEMA zone AE · 99% chance over 30 yrs
- Wildfire 1/10 Low
- Heat 4/10 Moderate 7 d/yr ≥104°F today · 19 d/yr by 30 yrs out
- Wind 2/10 Low 100% chance of damaging wind over 30 yrs
- Air quality 2/10 Low 1 unhealthy d/yr today · 2 by 30 yrs out
Nearby sold comps map
Loading sold comps map…
Walkable amenities ~0.75 mi
Loading nearby amenities…
Taxation est. · year 1
- Rental income
- $18,068
- − Mortgage interest
- −$5,316
- − Property taxes
- −$529
- − Insurance
- −$5,593
- − Repairs & maintenance
- −$1,445
- − Management
- −$1,445
- − Depreciation
- −$2,761
- Taxable income
- $978
- Est. tax owed @ 24.0%
- −$235
- After-tax cash flow
- $1,945/yr
For passive investors: Depreciation is non-cash, so a rental often shows a tax loss while cash-flowing — sheltering income. Rental losses are passive: they offset passive income freely, and up to $25,000/yr can offset ordinary (W-2) income if you actively participate and your MAGI is under $100k (phasing out to $0 by $150k); unused losses carry forward. On sale, claimed depreciation is recaptured at up to 25%, and gains may owe capital-gains tax (a 1031 exchange can defer both). Figures are a year-1 estimate at your 24.0% rate — not tax advice; consult a CPA.
Schools (NCES district)
- District
- Switzerland County School Corporation
- NCES district ID
- 1811220
- Math proficiency
- 25% ▼ -10.00%
- Reading proficiency
- 31% ▼ -9.00%
- Median HH income
- $44,127
- Composite
- 23.96/100
- National rank
- #7780
- State rank
- #254 of 301 in IN
Livability — Vevay
- Score
- 59/100
- State rank
- #555
- US rank
- #19928
Category grades
Schools grade is shown separately in the Schools card above.
Census & demographics
- Population (ZIP)
- 4,851
Population outlook (Switzerland County) Hauer SSP2
- Today (2025)
- 10,189 people
- By 2030
- 9,909 · -2.7%
- By 2040
- 9,347 · -8.3%
- By 2050
- 8,721 · -14.4%
- By 2075
- 7,542 · -26.0%
- By 2100
- 6,601 · -35.2%
Race, ethnicity, and origin ACS 2023
- Neighborhood character
- Predominantly White (96%)
- Race & ethnicity
- White 96% Two or more races 2%
- Common ancestry
- Slovak 3% Italian 2% Serbian 2%
- Foreign-born
- 1% · Canada
- Languages at home
- 96% English-only · German/W. Germanic 4% Spanish 0%
Political lean MEDSL · Switzerland
- 2024 margin
- Solid R (+57.5) · D 20.5% · R 78.0% · Other 1.5%
- 2008→2024 swing
- -49.2pp toward R · 2008: -8.3pp · 2024: -57.5pp
- All cycles
- 2024: R+57.5 2020: R+52.2 2016: R+44.7 2012: R+12.8 2008: R+8.3
Not yet ingested
- Civics
- —
Market trends
- HPI YoY
- ▲ 8.15%
- Current HPI
- 212.0481
- Rent YoY
- —
- Metro
- —
- State GDP YoY
- ▲ 2.90%
- F500 in state
- 18
Industry mix (Fortune 500 HQ in IN)
| Industry | F500 HQs | Revenue |
|---|---|---|
| Industrial Machinery | 2 | $37B |
|
||
| Healthcare | 1 | $177B |
|
||
| Pharmaceuticals | 1 | $45B |
|
||
| Metals / Steel | 1 | $18B |
|
||
| Agriculture | 1 | $17B |
|
||
| Packaging | 1 | $12B |
|
||
Price history
-5.0% since first listed2 events — show timeline
- 2026-06-07 Price Changed $94,900 SEIBR
- 2026-05-04 Listed $99,900 SEIBR
Property tax history
+32.5%/yrLatest (2024): $529 · +1.1% YoY. Source: county tax records.
Cash-flow waterfall
monthlySold comps — $/sqft
last 12 mo · ≤1 miLoading sold comps…