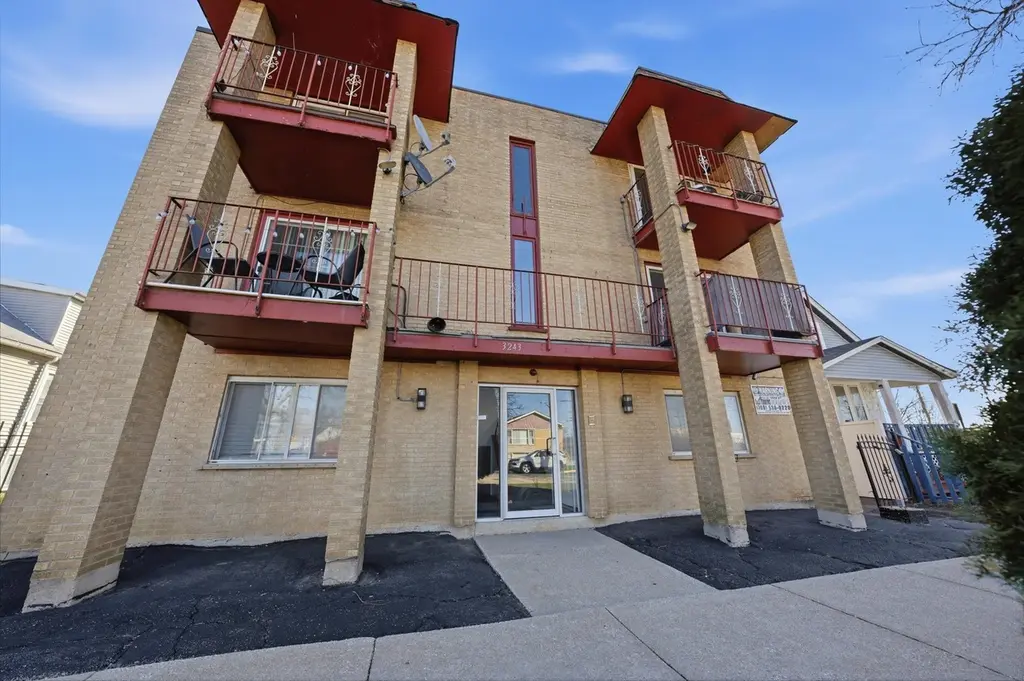
3243 S 49th Ave #103 · Cicero, IL
Flood risk 6/10 · Moderate
- FEMA flood zone
- X (unshaded)
- Chance of flooding over 30 yrs
- 0.71%
- Est. flood insurance / yr
- $507 – $1,088
Fire risk 1/10 · Minimal
- Est. fire insurance / yr
- $804 – $1,492
Heat risk 3/10 · Minor
- Hot days now (above 99°F)
- 7 days/yr
- Hot days in 30 yrs
- 15 days/yr
Wind risk 2/10 · Minimal
- Chance of severe wind over 30 yrs
- 0.0%
Air-quality risk 4/10 · Minor
- Unhealthy air days now
- 4 days/yr
- Unhealthy air days in 30 yrs
- 6 days/yr
Risk factors via First Street. Map © Google.
Why this score? — see what drove the D+ grade
The composite is a weighted blend of 9 inputs, each scored 0–100. Each bar is that input's sub-score; the figure is the points it added to the 100-point composite (weight × sub-score).
- Cash flow +14.6/30.0
- ARV discount +7.5/15.0
- 1% rule +6.8/10.0
- DSCR +4.4/10.0
- Livability +4.1/5.0
- Condition / age +3.8/5.0
- Rent growth +3.1/5.0
- Schools +1.1/10.0
- Appreciation +0.0/10.0
$124,000
🖨 Deal sheet (PDF) 📄 Offer letter ✓ Due diligence
Listing remarks
Bright, spacious 1 bedroom condo. Updates include new flooring, paint throughout, doors, trim, stainless steel appliances, white shaker kitchen cabinets, pristine countertop and much more. This is a must see.
Key facts
- New flooring
- Pristine countertop
- $265 HOA
Tags
Property features AI
Finance
- Other: Part of a 6-unit building; Living area is an estimate
- HOA & community: Monthly association fee of $265 covering exterior maintenance, lawn care, scavenger and snow removal; Pets allowed (cats and dogs) with limits; maximum pet weight 30 lbs
Exterior
- Parking: One parking space
- Utilities: Water source: Lake Michigan; Public sewer
- Home design: Attached single condo; Entry at level 1; Fee simple ownership; Brick construction
- Construction: Built 41–50 years ago; Built before 1978
- Exterior features: Lot dimensions approximately 25 x 125; Commuter-friendly location with access to commuter bus, commuter train and interstate
Interior
- Kitchen: Range; Refrigerator; Kitchen (main level) — 9 x 8
- Bedrooms: Master bedroom (main level) — 17 x 12; Additional bedrooms (2) — listed as Bedroom 2 and Bedroom 3
- Bathrooms: One full bathroom
- Heating & cooling: Natural gas heating
- Interior features: Four total rooms
- Laundry & utility: Laundry room
Neighborhood map
What this means for you Summary
Snapshot
- This is a 1-bed/1.0-bath condo listed at $124k. Condition is rated good.
Deal economics
- At list price, monthly cash flow is $29 ($350/yr) — positive.
- The deal already cash-flows at list — no discount required.
- Meets the 1% rule at list price ($1k rent vs $124k).
- Recommended offer: $117k (6.0% below list) — sets the bar for market timing.
- Cap rate 6.6% vs local median 4.5% in Cicero — top-decile yield for the area; either an underpriced asset or a hidden risk that comps aren't pricing in. Stress-test before assuming the spread holds.
Location & tenants
- Location reads 82/100 on livability (#77 in IL, #1,276 nationally) — a professional / high-income tenant draw. Strengths: commute A+, cost of living A+, housing A+.
- J S Morton Hsd 201 (suburban): math 9% / reading 14% proficiency, ranked #557 of 620 in IL (top 90%) — low school quality limits family demand, transient renter base, plan for 1-2y turnover.
- Zoned schools: Unity Jr High School (math 6% / reading 10%, grade F, #608 of 665 statewide, top 92%, 2,054 students, 0% FRL); J Sterling Morton East High Sch (math 7% / reading 11%, grade F, #580 of 693 statewide, top 84%, 3,445 students, 0% FRL).
- Market conditions: Rents rising (+2.4%/yr); 109 active listings in the ZIP; 11 comparable units currently listed for rent nearby; rentals at typical pace (median 17d on market — plan ~3-4 weeks tenant-placement turnaround); 6,272 units permitted in Cook County in 2024 (4,658 in 5+ unit buildings).
Forward outlook
- Local home prices are declining (-3.0%/yr); year-one equity from $857 of loan paydown is wiped out by about $4k of value loss. Plan a longer hold.
Negotiation context
- It's been on market 86 days — a 6% lower offer ($117k) is reasonable based on typical stale-listing flexibility.
Risks & watch-outs
- Climate carrying-cost: major flood risk — expect insurance premiums to compound above CPI over the hold.
Questions for the listing agent
- It's been on market 86 days. Have you received any prior offers? Is the seller open to a 6% concession, seller financing, or rate buy-down credit?
- What does the HOA fee cover, when was the last increase, and are there any pending special assessments or reserve-fund shortfalls?
- Any open or pending special assessments — roof, HVAC, plumbing, elevator, façade? What's the per-unit balance and payoff schedule, and is the seller paying it off at close or rolling it to the buyer?
- Why hasn't it sold? Are there any deal-killer items the seller is aware of (foundation, flood, title, zoning, code violations)?
- Is there a deadline driving the sale (1031 exchange, divorce, estate, relocation)? That informs how much negotiation room exists.
- Schools are F-rated, which usually means shorter tenancies and higher turnover. Who's the typical renter profile here, and what's been the actual vacancy rate?
- The area grade is low — what's the realistic commute time and amenity access for the typical tenant pool here? Any planned neighborhood developments (good or bad) we should know about?
- What's the average days-on-market for RENTAL listings here right now (not sales)? A rising rental-DOM trend means longer vacancies and softer asking-rent achievability than the comps imply.
- What's the recent tenant-quality profile in this submarket — average credit score on applications, eviction rate, late-payment / NSF rate, and stable-employment percentage? A property-management company in the area should have these aggregated.
- How much new apartment / multifamily construction is in the pipeline within 1–3 miles? Heavy new supply (>2% of stock underway) typically softens rents 12–24 months out; light construction supports rent growth.
Investment metrics
- 1% rule
- 1.18% ✓
- Cap rate
- 6.58%
- Cash-on-cash
- 1.01%
- DSCR
- 1.04
- GRM
- 7.1
CMA / ARV
No comps found within radius.
Projected returns pro-forma
-3.0% appreciation · 2.43% rent growth · sell at horizon
- IRR
- -15.3%
- Equity multiple
- 0.46×
- Total profit
- $-18,880
- Equity at exit
- $18,489
- IRR
- -7.8%
- Equity multiple
- 0.52×
- Total profit
- $-16,666
- Equity at exit
- $10,721
Cash invested: $34,720 (down + closing). Projections, not guarantees.
Landlord ↔ Tenant lean methodology
- Overall (STATE)
- 43 Moderately Tenant-Leaning
- State Illinois
- 43 Moderately Tenant-Leaning · D+7
- County
- — inherits STATE
- City
- — inherits STATE
ZIP-level market 60804
- Rents YoY
- 2.4%
- Active inventory
- 109
- Price-to-rent
- 7.1×
Monthly cashflow live
- Estimated rent
- $1,457 high interval (Pro) →
- Mortgage (P&I)
- −$650
- Tax est. 1.5%
- −$155 /mo · $1,860/yr
- Insurance
- −$52
- HOA
- −$265
- Vacancy / Maint / Mgmt
- −$306
- Net cashflow
- $29
Break-even live
Sensitivity live
| Price | -10% $115 | -5% $72 | +0% $29 | +5% $-14 | +10% $-56 |
|---|---|---|---|---|---|
| Rent | -10% $-86 | -5% $-28 | +0% $29 | +5% $87 | +10% $144 |
| Rate | -1.0pp $92 | -0.5pp $61 | base $29 | +0.5pp $-3 | +1.0pp $-36 |
UW: 25.0% down · 7.5% · 30yr · 1.5% tax · 5.0% vac · 8.0% maint · 8.0% mgmt
Financing live
Cash to close
- Down payment
- $31,000
- Closing costs
- $3,720
- Reserves months
- —
- Total cash needed
- —
Loan-product check · same deal, 3 products live
Conventional
25% down · 7.5% · 30yr
- Down + closing
- —
- Monthly P&I
- —
- Monthly cashflow
- —
- DSCR
- —
- Eligible?
- —
Personal DTI + credit; lowest rate.
DSCR
20% down · 8.5% · 30yr
- Down + closing
- —
- Monthly P&I
- —
- Monthly cashflow
- —
- DSCR
- —
- Eligible?
- —
No personal income docs; deal must DSCR.
Hard money
10% down · 12.0% · 12mo
- Down + closing
- —
- Monthly P&I
- —
- Monthly cashflow
- —
- DSCR
- —
- Eligible?
- —
Short-term bridge; refi at stabilization.
Rent comps 11 comps
| Address | Beds | Baths | Sqft | Rent | $/sqft | DOM | Units | Dist |
|---|---|---|---|---|---|---|---|---|
| 5309 30th Pl Unit 1 Cicero, IL | 2.0 | 1.0 | 950 | $2,000 | $2.11 | 17d | 1 | 0.58mi |
| 2341 S 53rd Ave Cicero, IL | 1.0 | 1.0 | 700 | $960 | $1.37 | 26d | 1 | 1.11mi |
| 5400 W 23rd St Unit 2 Cicero, IL | 2.0 | 1.0 | 1000 | $2,000 | $2.00 | 26d | 1 | 1.30mi |
| 5042 W 21st Pl Unit 8 Cicero, IL | — | 1.0 | 700 | $1,050 | $1.50 | 17d | 1 | 1.33mi |
| 5040 W 21st Pl Unit 9 Cicero, IL | — | 1.0 | 600 | $1,050 | $1.75 | 17d | 1 | 1.34mi |
| 2119 S 51st Ave Unit 1 Cicero, IL | 2.0 | 1.0 | 1100 | $1,625 | $1.48 | 4d | 1 | 1.34mi |
| 5108 W 21st Pl Cicero, IL | 2.0 | 1.0 | 875 | $1,295 | $1.48 | 9d | 1 | 1.34mi |
| 2123 S 51st Ct Unit 101 Cicero, IL | 1.0 | 1.0 | 600 | $1,195 | $1.99 | 5d | 1 | 1.35mi |
| 5134 W 21st St #2 Cicero, IL | 2.0 | 1.0 | 715 | $1,700 | $2.38 | 17d | 1 | 1.43mi |
| 1903 S 49th Ave Cicero, IL | 2.0 | 1.0 | 1000 | $1,600 | $1.60 | 16d | 1 | 1.50mi |
| 1903 S 49th Ave Unit 1 Cicero, IL | 2.0 | 1.0 | 1000 | $1,600 | $1.60 | 17d | 1 | 1.50mi |
HOA detail condo
- Monthly dues
- $265 · $3,180/yr
- Assessments
- None detected in remarks — confirm with the listing agent.
Listing history 15 events
-
2026-06-21days on market $124,000 Active 86 DOM
-
2026-06-18days on market $124,000 Active 83 DOM
-
2026-06-17days on market $124,000 Active 82 DOM
-
2026-06-16days on market $124,000 Active 81 DOM
-
2026-06-15days on market $124,000 Active 80 DOM
-
2026-06-13days on market $124,000 Active 78 DOM
-
2026-06-09days on market $124,000 Active 74 DOM
-
2026-06-08days on market $124,000 Active 73 DOM
-
2026-06-07days on market $124,000 Active 72 DOM
-
2026-06-04days on market $124,000 Active 69 DOM
-
2026-06-03days on market $124,000 Active 68 DOM
-
2026-06-02days on market $124,000 Active 67 DOM
-
2026-06-01days on market $124,000 Active 66 DOM
-
2026-05-31days on market $124,000 Active 65 DOM
-
2026-03-26$124,000 Active
ⓘ Source: listings_history table (triggers on properties + properties_extension) + one-shot
backfill from property_details.listing_events for pre-trigger history.
Climate risk First Street
- Flood 6/10 Major FEMA zone X (unshaded) · 71% chance over 30 yrs
- Wildfire 1/10 Low
- Heat 3/10 Moderate 7 d/yr ≥99°F today · 15 d/yr by 30 yrs out
- Wind 2/10 Low 0% chance of damaging wind over 30 yrs
- Air quality 4/10 Moderate 4 unhealthy d/yr today · 6 by 30 yrs out
Nearby sold comps map
Loading sold comps map…
Walkable amenities ~0.75 mi
Loading nearby amenities…
Taxation est. · year 1
- Rental income
- $17,486
- − Mortgage interest
- −$6,946
- − Property taxes
- −$1,860
- − Insurance
- −$620
- − Repairs & maintenance
- −$1,399
- − Management
- −$1,399
- − HOA
- −$3,180
- − Depreciation
- −$3,607
- Taxable loss
- −$1,525
- Est. tax savings @ 24.0%
- +$366
- After-tax cash flow
- $716/yr
For passive investors: Depreciation is non-cash, so a rental often shows a tax loss while cash-flowing — sheltering income. Rental losses are passive: they offset passive income freely, and up to $25,000/yr can offset ordinary (W-2) income if you actively participate and your MAGI is under $100k (phasing out to $0 by $150k); unused losses carry forward. On sale, claimed depreciation is recaptured at up to 25%, and gains may owe capital-gains tax (a 1031 exchange can defer both). Figures are a year-1 estimate at your 24.0% rate — not tax advice; consult a CPA.
Condition & rehab AI · 14 photos
This 1-bedroom condo is in good condition with recent updates, including new flooring and paint. It's ready for move-in and would benefit from exterior painting and landscaping to further enhance its value.
Value-add opportunities
- Both Paint exterior — Enhances curb appeal and value
- Both Landscaping — Improves curb appeal and rental value
Renovation cost estimate screening
Value-add ROI direction
- Both Paint exterior — Enhances curb appeal and value ↑
- Both Landscaping — Improves curb appeal and rental value ↑
ⓘ Cost ranges are severity-bucket heuristics (US national rule-of-thumb). Get contractor quotes + a written scope before underwriting a rehab budget.
Schools (NCES district)
- District
- J S Morton Hsd 201
- NCES district ID
- 1726880
- Math proficiency
- 9% ▲ 1.00%
- Reading proficiency
- 14% ▼ -1.00%
- Median HH income
- $48,698
- Composite
- 10.73/100
- National rank
- #9768
- State rank
- #557 of 620 in IL
Livability — Cicero
- Score
- 82/100
- State rank
- #77
- US rank
- #1276
Category grades
Schools grade is shown separately in the Schools card above.
Census & demographics
- Census place
- Cicero, IL
- County
- Cook County · 4,486,803 people
- City population
- 82,797
- Metro
- Chicago-Naperville-Elgin, IL-IN-WI
- Population (ZIP)
- 82,797
- Household income
- $70,842
- Rent vs Own
- Severe rent burden
- 2178.0
Population outlook (Cook County) Hauer SSP2
- Today (2025)
- 5,347,519 people
- By 2030
- 5,357,703 · +0.2%
- By 2040
- 5,324,924 · -0.4%
- By 2050
- 5,230,762 · -2.2%
- By 2075
- 4,785,735 · -10.5%
- By 2100
- 4,188,836 · -21.7%
Race, ethnicity, and origin ACS 2023
- Neighborhood character
- Predominantly Hispanic (89%)
- Race & ethnicity
- Hispanic / Latino 89% Two or more races 17% White 7% Black 3% Native American 2%
- Hispanic origin (detail)
- Mexican 80% Puerto Rican 3%
- Common ancestry
- Romanian 2%
- Foreign-born
- 40% · Canada, Jamaica
- Languages at home
- 18% English-only · Spanish 80%
Political lean MEDSL · Cook
- 2024 margin
- Solid D (+42.0) · D 70.4% · R 28.4% · Other 1.2%
- 2008→2024 swing
- -11.4pp toward R · 2008: 53.4pp · 2024: 42.0pp
- All cycles
- 2024: D+42.0 2020: D+50.3 2016: D+53.0 2012: D+49.4 2008: D+53.4
Not yet ingested
- Civics
- —
Market trends
- HPI YoY
- ▼ -165.38%
- Current HPI
- 262.83
- Rent YoY
- ▲ 2.43%
- Metro
- Chicago-Naperville-Elgin, IL-IN-WI
- State GDP YoY
- ▲ 1.59%
- F500 in state
- 60
Industry mix (Fortune 500 HQ in IL)
| Industry | F500 HQs | Revenue |
|---|---|---|
| Insurance | 4 | $201B |
|
||
| Consumer Goods | 4 | $87B |
|
||
| Industrial Machinery | 3 | $64B |
|
||
| Healthcare | 2 | $55B |
|
||
| Retail / Pharmacy | 1 | $148B |
|
||
| Agriculture / Food | 1 | $86B |
|
||
Price history
1 event — show timeline
- 2026-03-26 Listed $124,000 MRED as Distributed by MLS Grid
Cash-flow waterfall
monthlySold comps — $/sqft
last 12 mo · ≤1 miLoading sold comps…