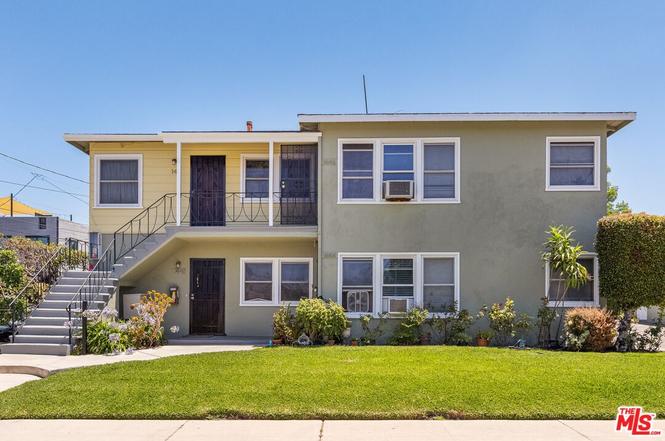
 Fourplex
1444 Hazelwood Ave · Los Angeles, CA
Flood risk 4/10 · Minor
- FEMA flood zone
- X (unshaded)
- Chance of flooding over 30 yrs
- 0.2%
- Est. flood insurance / yr
- $507 – $1,088
Fire risk 1/10 · Minimal
- Est. fire insurance / yr
- $659 – $1,223
Heat risk 6/10 · Moderate
- Hot days now (above 97°F)
- 7 days/yr
- Hot days in 30 yrs
- 22 days/yr
Wind risk 1/10 · Minimal
- Chance of severe wind over 30 yrs
- —
Air-quality risk 6/10 · Moderate
- Unhealthy air days now
- 11 days/yr
- Unhealthy air days in 30 yrs
- 12 days/yr
Risk factors via First Street. Map © Google.
Why this score? — see what drove the D+ grade
The composite is a weighted blend of 9 inputs, each scored 0–100. Each bar is that input's sub-score; the figure is the points it added to the 100-point composite (weight × sub-score).
- Cash flow +17.0/30.0
- ARV discount +11.0/15.0
- DSCR +5.3/10.0
- 1% rule +4.0/10.0
- Schools +3.6/10.0
- Livability +3.4/5.0
- Rent growth +2.8/5.0
- Condition / age +2.5/5.0
- Appreciation +0.0/10.0
$1,299,000
🖨 Deal sheet 📄 Offer letter ✓ Due diligence
Multi-family units
County records classify this as Multi-Family (2-4 Unit). Listing-text estimate: 4 units. confirmed
Listing remarks
Fantastic 4 Unit Multi-family Mid-Century Property located in close proximity to both York Blvd and Eagle Rock Blvd. This large corner lot property has so much to offer. Two 2 bed 1 bath units and two 1 bed 1bath units, a four car carport, coin-operated laundry room, an additional storage room, as well as a large grassy backyard. The property exterior has been freshly painted. The lower one bedroom unit has been nicely updated and boasts beautiful hardwood floors and split system air. Great upside potential! Units will be shown only upon accepted offer. Drive by only! Please do not disturb tenants! Buyer(s) to possibly cooperate with a seller 1031 exchange at no cost to buyer(s).
Key facts
- Storage room
- Grassy backyard
- Updated unit
Tags
Property features AI
Finance
- Other: Property consists of 2 buildings (quadruplex configuration)
- Financial info: Gross income reported at $55,500; Gross operating income reported at $55,250; Net operating income reported at $30,500; Total annual expenses reported at $24,700; Cap rate reported at 2.5%; Gross rent multiplier reported at 21.8; Vacancy rate reported at 25%; Rent roll (actual rents): $1,846; $854; $1,082; $1,485; Projected rents shown: $2,500; $2,500; $3,000; $3,000
- HOA & community: Four units in the complex
Exterior
- Parking: Assigned parking; Detached carport; Total of 4 parking spaces (including 4 carport spaces)
- Security: No security details provided
- Utilities: No water, sewer, or power provider details provided
- Home design: Residential income property; Two-level building across 2 floors; Fee land tenure
- Construction: No year built or specific construction material provided; No roof or foundation details provided
- Exterior features: Accessory buildings on the property; Zoned LARD3
Interior
- Kitchen: No detailed appliance list provided
- Bedrooms: One 1-bedroom unit; One additional 1-bedroom unit; One 2-bedroom unit; One additional 2-bedroom unit
- Flooring: No flooring details provided
- Bathrooms: Each unit has 1 bath
- Heating & cooling: Wall gas heating; Window-unit cooling and other cooling types
- Interior features: Actual rents reported for current tenants; Projected market rents provided
- Laundry & utility: No laundry or utility details provided
Neighborhood map
What this means for you Summary
Snapshot
- This is a 2×2bd/1.0ba + 2×1bd/1.0ba units multifamily listed at $1.30M.
Deal economics
- At list price, monthly cash flow is $882 ($11k/yr) — positive. Per door: $220/mo.
- The deal already cash-flows at list — no discount required.
- To meet the 1% rule (rent ≥ 1% of price), the offer needs to be $1.16M (10.4% below list).
- Recommended offer: $1.16M (10.4% below list) — sets the bar for 1% rule.
- Cap rate 7.1% vs local median 2.1% in Los Angeles — top-decile yield for the area; either an underpriced asset or a hidden risk that comps aren't pricing in. Stress-test before assuming the spread holds.
Location & tenants
- Location reads 68/100 on livability (#273 in CA) — a middle-class / working-renter tenant base. Strengths: amenities A+, commute A+, employment B; Watch: health & safety C-, schools D+, crime F.
- Los Angeles Unified (urban): math 29% / reading 54% proficiency, ranked #223 of 517 in CA (top 43%) — families likely to look elsewhere, expect single-tenant / working-renter base with shorter leases; 67% free/reduced lunch — lower-income household profile, screen leases tightly.
- Market conditions: Rents rising (+1.2%/yr); 58 active listings in the ZIP; 1 comparable units currently listed for rent nearby; high-income renter base; 19,697 units permitted in Los Angeles County in 2024 (9,426 in 5+ unit buildings).
- At $11,642/mo this rent would consume 122% of the median local household income ($115k/yr) (locally 1107% of renters already pay >50% of income on rent) — very limited rent-growth headroom before tenants either downsize or default.
Forward outlook
- Local home prices are declining (-3.0%/yr); year-one equity from $9k of loan paydown is wiped out by about $39k of value loss. Plan a longer hold.
- Los Angeles County population projected at +9% by 2050 — modest demand growth; plan on rents tracking national, not racing it.
Negotiation context
- Only 2 days on market — expect competitive offers; lowballing is unlikely to land.
- 7 sale attempts since 12y ago with the ask held roughly flat each time — persistent listings suggest the price (not the market) is what's stuck; bring a comps-based counter.
- Current owner paid $758k; list at $1.30M implies a 71% gain — meaningful room to come down on a strong offer.
Risks & watch-outs
- Watch-outs: built in 1952 — expect roof / HVAC / electrical / plumbing capex.
- Climate carrying-cost: extreme-heat days projected 7→22/yr by 2055 (HVAC capex compounding) — expect insurance premiums to compound above CPI over the hold.
Questions for the listing agent
- Can we see the unit-by-unit rent roll, current vacancy, and any below-market leases? What's the average tenancy length?
- What capital expenditures (roof, boiler, parking lot, exteriors) have been made in the last 5 years, and what's planned in the next 2?
- Built in 1952 — when were the roof, HVAC, electrical panel, plumbing, and water heater last replaced?
- Is there a deadline driving the sale (1031 exchange, divorce, estate, relocation)? That informs how much negotiation room exists.
- Schools are D-rated, which usually means shorter tenancies and higher turnover. Who's the typical renter profile here, and what's been the actual vacancy rate?
- Crime grade is F in this area — have there been break-ins, vandalism, or insurance claims at this property in the last 3 years? What carrier currently insures it and at what premium?
- The area grade is low — what's the realistic commute time and amenity access for the typical tenant pool here? Any planned neighborhood developments (good or bad) we should know about?
- What's the average days-on-market for RENTAL listings here right now (not sales)? A rising rental-DOM trend means longer vacancies and softer asking-rent achievability than the comps imply.
- What's the recent tenant-quality profile in this submarket — average credit score on applications, eviction rate, late-payment / NSF rate, and stable-employment percentage? A property-management company in the area should have these aggregated.
- How much new apartment / multifamily construction is in the pipeline within 1–3 miles? Heavy new supply (>2% of stock underway) typically softens rents 12–24 months out; light construction supports rent growth.
Investment metrics
- 1% rule
- 0.90% ✗
- Cap rate
- 7.11%
- Cash-on-cash
- 2.91%
- DSCR
- 1.13
- GRM
- 9.3
CMA / ARV
- ARV (on-the-fly)
- $1,407,000
- Comps found
- 6
Show comp detail 6 sales within ~0.75 mi
| Address | Dist | Beds/Ba | Sqft | Sold | Price | $/sf | Match |
|---|---|---|---|---|---|---|---|
| 4557 Paulhan Ave | 0.35mi | 6/4.0 | 2,932 (-2%) | 1mo | $1,225,000 | $418 | 79 |
| 4501 Alumni Ave | 0.30mi | 6/4.0 | 2,727 (-9%) | 0mo | $1,280,000 | $469 | 71 |
| 4401 Westdale Ave | 0.56mi | 7/5.0 (+1) | 2,947 (-2%) | 1mo | $1,085,000 | $368 | 61 |
| 1361 Armadale Ave | 0.12mi | 7/3.0 (+1) | 2,557 (-15%) | 0mo | $1,610,000 | $630 | 60 |
| 4727 Lincoln Ave | 0.12mi | 6/5.0 | 2,727 (-9%) | 24mo | $1,250,000 | $458 | 55 |
| 1068 El Paso Dr | 0.33mi | 6/7.0 | 3,394 (+13%) | 16mo | $1,620,000 | $477 | 37 |
Match score weights: distance 35% · size 25% · config 20% · recency 20%. Top-matched comps best support the ARV.
Projected returns pro-forma
-3.0% appreciation · 1.22% rent growth · sell at horizon
- IRR
- -13.6%
- Equity multiple
- 0.52×
- Total profit
- $-175,043
- Equity at exit
- $193,685
- IRR
- -7.6%
- Equity multiple
- 0.55×
- Total profit
- $-162,152
- Equity at exit
- $112,314
Cash invested: $363,720 (down + closing). Projections, not guarantees.
Landlord ↔ Tenant lean methodology
- Overall (CITY)
- 0 Strongly Tenant-Friendly
- State California
- 18 Strongly Tenant-Friendly · D+13
- County
- — inherits STATE
- City Los Angeles
- 0 Strongly Tenant-Friendly · D+22
ZIP-level market 90041
- Rents YoY
- 1.2%
- Active inventory
- 58
- Price-to-rent
- 35.8×
Monthly cashflow live
- Estimated rent
- $11,642 high interval (Pro) →
- Mortgage (P&I)
- −$6,812
- Tax from tax record
- −$962 /mo · $11,543/yr
- Insurance
- −$541
- HOA
- −$0
- Vacancy / Maint / Mgmt
- −$2,445
- Net cashflow
- $882
Break-even live
4-unit breakdown (identical units grouped — click to expand)
| Units | Beds | Baths | Est. rent |
|---|---|---|---|
| 2× units | 2 | 1 | $6,042 |
| #1 | 2 | 1 | $3,021 |
| #2 | 2 | 1 | $3,021 |
| 2× units | 1 | 1 | $5,600 |
| #3 | 1 | 1 | $2,800 |
| #4 | 1 | 1 | $2,800 |
| Total (4 units) | $11,642 | ||
UW: 25.0% down · 7.5% · 30yr · 1.5% tax · 5.0% vac · 8.0% maint · 8.0% mgmt
Financing live
Cash to close
- Down payment
- $324,750
- Closing costs
- $38,970
- Reserves months
- —
- Total cash needed
- —
Loan-product check · same deal, 3 products live
Conventional
25% down · 7.5% · 30yr
- Down + closing
- —
- Monthly P&I
- —
- Monthly cashflow
- —
- DSCR
- —
- Eligible?
- —
Personal DTI + credit; lowest rate.
DSCR
20% down · 8.5% · 30yr
- Down + closing
- —
- Monthly P&I
- —
- Monthly cashflow
- —
- DSCR
- —
- Eligible?
- —
No personal income docs; deal must DSCR.
Hard money
10% down · 12.0% · 12mo
- Down + closing
- —
- Monthly P&I
- —
- Monthly cashflow
- —
- DSCR
- —
- Eligible?
- —
Short-term bridge; refi at stabilization.
Rent comps 1 comps
| Address | Beds | Baths | Sqft | Rent | $/sqft | DOM | Units | Dist |
|---|---|---|---|---|---|---|---|---|
| 2025 Addison Way Unit 2027 B Eagle Rock, CA | 7.0 | 6.0 | 4421 | $2,300 | $0.52 | 24d | 1 | 0.83mi |
Listing history 4 events
-
2026-06-18days on market $1,299,000 Active 2 DOM
-
2026-06-18remarks 690-char remark
-
2026-06-17remarks 642-char remark
-
2026-06-17$1,299,000 Active 1 DOM
ⓘ Source: listings_history table (triggers on properties + properties_extension) + one-shot
backfill from property_details.listing_events for pre-trigger history.
Tax reassessment forecast CA · Resets to sale price
- Current annual tax
- $11,543 · $962/mo
- Projected year-2 tax
- $11,543 · $962/mo
- Expected delta
- $0/yr ($0/mo · 0.0%)
ⓘ Screening estimate from a state-policy table — verify with the county assessor before closing.
Climate risk First Street
- Flood 4/10 Moderate FEMA zone X (unshaded) · 20% chance over 30 yrs
- Wildfire 1/10 Low
- Heat 6/10 Major 7 d/yr ≥97°F today · 22 d/yr by 30 yrs out
- Wind 1/10 Low
- Air quality 6/10 Major 11 unhealthy d/yr today · 12 by 30 yrs out
Nearby sold comps map
Loading sold comps map…
Walkable amenities ~0.75 mi
Loading nearby amenities…
Taxation est. · year 1
- Rental income
- $139,704
- − Mortgage interest
- −$72,764
- − Property taxes
- −$11,543
- − Insurance
- −$6,495
- − Repairs & maintenance
- −$11,176
- − Management
- −$11,176
- − Depreciation
- −$37,789
- Taxable loss
- −$11,240
- Est. tax savings @ 24.0%
- +$2,698
- After-tax cash flow
- $13,281/yr
For passive investors: Depreciation is non-cash, so a rental often shows a tax loss while cash-flowing — sheltering income. Rental losses are passive: they offset passive income freely, and up to $25,000/yr can offset ordinary (W-2) income if you actively participate and your MAGI is under $100k (phasing out to $0 by $150k); unused losses carry forward. On sale, claimed depreciation is recaptured at up to 25%, and gains may owe capital-gains tax (a 1031 exchange can defer both). Figures are a year-1 estimate at your 24.0% rate — not tax advice; consult a CPA.
Schools (NCES district)
- District
- Los Angeles Unified
- NCES district ID
- 0622710
- Math proficiency
- 29% ▼ -4.00%
- Reading proficiency
- 54% ▲ 10.00%
- Median HH income
- $50,403
- Composite
- 35.67/100
- National rank
- #4875
- State rank
- #223 of 517 in CA
Livability — Los Angeles
- Score
- 68/100
- State rank
- #273
- US rank
- #9237
Category grades
Schools grade is shown separately in the Schools card above.
Census & demographics
- Census place
- Los Angeles, CA
- County
- Los Angeles County · 9,444,647 people
- City population
- 3,838,149
- Metro
- Los Angeles-Long Beach-Anaheim, CA
- Population (ZIP)
- 27,920
- Household income
- $114,526
- Rent vs Own
- Severe rent burden
- 1107.0
Population outlook (Los Angeles County) Hauer SSP2
- Today (2025)
- 10,940,515 people
- By 2030
- 11,256,481 · +2.9%
- By 2040
- 11,729,929 · +7.2%
- By 2050
- 11,948,407 · +9.2%
- By 2075
- 11,818,114 · +8.0%
- By 2100
- 10,842,928 · -0.9%
Race, ethnicity, and origin ACS 2023
- Neighborhood character
- Highly diverse neighborhood (Simpson 0.72)
- Race & ethnicity
- Hispanic / Latino 33% White 33% Asian 25% Two or more races 17% Black 2% Native American 1%
- Hispanic origin (detail)
- Mexican 23%
- Common ancestry
- Lithuanian 2% Scotch-Irish 2% Romanian 2%
- Foreign-born
- 30% · Canada, China, South Korea
- Languages at home
- 57% English-only · Spanish 20% Tagalog/Filipino 14% Other Indo-European 4%
Political lean MEDSL · Los Angeles
- 2024 margin
- Solid D (+32.9) · D 64.8% · R 31.9% · Other 3.3%
- 2008→2024 swing
- -7.4pp toward R · 2008: 40.4pp · 2024: 32.9pp
- All cycles
- 2024: D+32.9 2020: D+44.2 2016: D+48.0 2012: D+40.0 2008: D+40.4
Not yet ingested
- Civics
- —
Market trends
- HPI YoY
- ▼ -906.86%
- Current HPI
- 521.7291
- Rent YoY
- ▲ 1.22%
- Metro
- Los Angeles-Long Beach-Anaheim, CA
- State GDP YoY
- ▲ 3.21%
- F500 in state
- 116
Industry mix (Fortune 500 HQ in CA)
| Industry | F500 HQs | Revenue |
|---|---|---|
| Technology | 27 | $1,492B |
|
||
| Financial Services | 3 | $174B |
|
||
| Retail | 3 | $44B |
|
||
| Insurance | 3 | $26B |
|
||
| Media / Entertainment | 2 | $115B |
|
||
| Pharmaceuticals / Biotech | 2 | $62B |
|
||
Price history
+73.2% since first listed16 events — show timeline
- 2026-06-13 Listed $1,299,000 TheMLS
- 2019-04-23 Listing Removed — SDMLS
- 2019-04-23 Delisted — TheMLS
- 2019-03-07 Relisted — TheMLS
- 2019-03-05 Contingent — TheMLS
- 2019-02-20 Pending — TheMLS
- 2019-01-24 Listed $1,199,000 SDMLS
- 2019-01-24 Listed — TheMLS
- 2015-01-02 Sold (Public Records) $771,000 Public Records
- 2015-01-02 Sold (MLS) $758,500 CRMLS
- 2014-12-18 Pending — CRMLS
- 2014-12-16 Relisted — CRMLS
- 2014-11-26 Pending — CRMLS
- 2014-11-14 Relisted — CRMLS
- 2014-11-11 Pending — CRMLS
- 2014-10-31 Listed $749,900 CRMLS
Property tax history
+15.1%/yrLatest (2025): $11,543 · +1.3% YoY. Source: county tax records.
Cash-flow waterfall
monthlySold comps — $/sqft
last 12 mo · ≤1 miLoading sold comps…