 Duplex
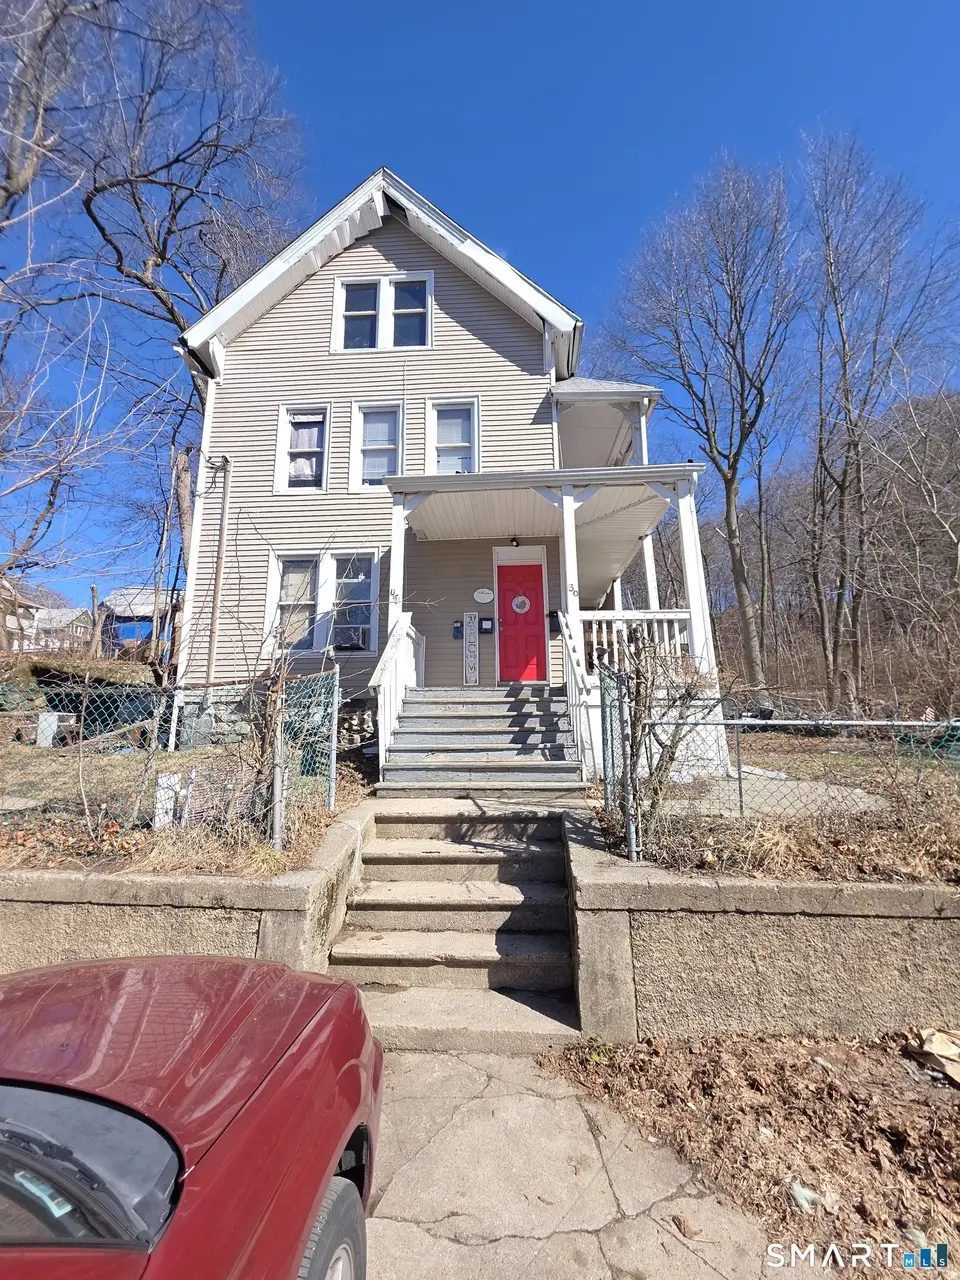
48 Taylor St · Waterbury, CT
Flood risk 5/10 · Moderate
- FEMA flood zone
- X (unshaded)
- Chance of flooding over 30 yrs
- 0.24%
- Est. flood insurance / yr
- $473 – $860
Fire risk 1/10 · Minimal
- Est. fire insurance / yr
- $829 – $1,539
Heat risk 5/10 · Moderate
- Hot days now (above 96°F)
- 7 days/yr
- Hot days in 30 yrs
- 15 days/yr
Wind risk 6/10 · Moderate
- Chance of severe wind over 30 yrs
- 27.0%
Air-quality risk 3/10 · Minor
- Unhealthy air days now
- 2 days/yr
- Unhealthy air days in 30 yrs
- 3 days/yr
Risk factors via First Street. Map © Google.
Why this score? — see what drove the C+ grade
The composite is a weighted blend of 9 inputs, each scored 0–100. Each bar is that input's sub-score; the figure is the points it added to the 100-point composite (weight × sub-score).
- Cash flow +24.7/30.0
- ARV discount +8.7/15.0
- DSCR +8.0/10.0
- 1% rule +6.3/10.0
- Appreciation +5.0/10.0
- Livability +4.0/5.0
- Rent growth +2.5/5.0
- Condition / age +2.5/5.0
- Schools +1.5/10.0
$295,000
🖨 Deal sheet 📄 Offer letter ✓ Due diligence
Multi-family units
County records classify this as Multi-Family (2-4 Unit). Listing-text estimate: 2 units. confirmed
Listing remarks MLS
Great opportunity for investors looking to build equity! This 2-family located at 48 Taylor Street in Waterbury offers strong potential with the right vision and renovations. Each unit provides a functional layout with separate living spaces, making it ideal for rental income or multi-generational living. Property requires repairs and updates but offers a solid opportunity to customize and increase value. Conveniently located near local amenities, shopping, schools, and major routes. Being sold as-is. Bring your ideas and make this property shine! PROPERTY IS BEING SOLD AS-IS AND IS SUBJECT TO SHORT SALE APPROVAL.
Key facts
- 2-family
- Functional layout
- Local amenities
Tags
Neighborhood map
What this means for you Summary
Snapshot
- This is a 2 × 3-bed/1.0-bath units multifamily listed at $295k.
Deal economics
- At list price, monthly cash flow is $618 ($7k/yr) — positive. Per door: $309/mo.
- The deal already cash-flows at list — no discount required.
- Meets the 1% rule at list price ($3k rent vs $295k).
- Recommended offer: $268k (9.0% below list) — sets the bar for market timing.
- Cap rate 8.8% vs local median 3.6% in Waterbury — top-decile yield for the area; either an underpriced asset or a hidden risk that comps aren't pricing in. Stress-test before assuming the spread holds.
Location & tenants
- Location reads 79/100 on livability (#32 in CT, #2,205 nationally) — a middle-class / working-renter tenant base. Strengths: commute A+, cost of living A+, housing A+; Watch: schools D+, crime D, employment D.
- Waterbury School District (suburban): math 12% / reading 23% proficiency, ranked #148 of 153 in CT (top 97%) — low school quality limits family demand, transient renter base, plan for 1-2y turnover; 73% free/reduced lunch — lower-income household profile, screen leases tightly.
- Market conditions: 5 active listings in the ZIP; 1 comparable units currently listed for rent nearby; lower-income renter base — watch delinquency; 502 units permitted in Naugatuck Valley Planning Region in 2024 (171 in 5+ unit buildings).
- At $3,336/mo this rent would consume 277% of the median local household income ($14k/yr) (locally 729% of renters already pay >50% of income on rent) — very limited rent-growth headroom before tenants either downsize or default.
Forward outlook
- In year one you build about $11k of equity ($2k loan paydown + $9k appreciation (3.0% local appreciation)).
- At projected returns (3.0% appreciation + 3.0% rent growth), your $83k cash investment doubles in ~5 years — after that, you're playing with house money.
- By year 4, paydown + projected appreciation supports a ~$37k cash-out refi (75% LTV) — recoverable capital for the next deal without selling this one.
Negotiation context
- It's been on market 99 days — a 9% lower offer ($268k) is reasonable based on typical stale-listing flexibility.
- 8 sale attempts since 25y ago with the ask held roughly flat each time — persistent listings suggest the price (not the market) is what's stuck; bring a comps-based counter.
- Current owner paid $115k; list at $295k implies a 157% gain — meaningful room to come down on a strong offer.
Risks & watch-outs
- Watch-outs: built in 1891 — expect roof / HVAC / electrical / plumbing capex.
- Climate carrying-cost: moderate flood risk; major wind risk, 27% chance of damaging wind over 30y; extreme-heat days projected 7→15/yr by 2055 (HVAC capex compounding) — expect insurance premiums to compound above CPI over the hold.
Questions for the listing agent
- It's been on market 99 days. Have you received any prior offers? Is the seller open to a 9% concession, seller financing, or rate buy-down credit?
- Can we see the unit-by-unit rent roll, current vacancy, and any below-market leases? What's the average tenancy length?
- What capital expenditures (roof, boiler, parking lot, exteriors) have been made in the last 5 years, and what's planned in the next 2?
- Built in 1891 — when were the roof, HVAC, electrical panel, plumbing, and water heater last replaced?
- Why hasn't it sold? Are there any deal-killer items the seller is aware of (foundation, flood, title, zoning, code violations)?
- Is there a deadline driving the sale (1031 exchange, divorce, estate, relocation)? That informs how much negotiation room exists.
- Schools are D-rated, which usually means shorter tenancies and higher turnover. Who's the typical renter profile here, and what's been the actual vacancy rate?
- Crime grade is D in this area — have there been break-ins, vandalism, or insurance claims at this property in the last 3 years? What carrier currently insures it and at what premium?
- What's the average days-on-market for RENTAL listings here right now (not sales)? A rising rental-DOM trend means longer vacancies and softer asking-rent achievability than the comps imply.
- What's the recent tenant-quality profile in this submarket — average credit score on applications, eviction rate, late-payment / NSF rate, and stable-employment percentage? A property-management company in the area should have these aggregated.
- How much new apartment / multifamily construction is in the pipeline within 1–3 miles? Heavy new supply (>2% of stock underway) typically softens rents 12–24 months out; light construction supports rent growth.
Investment metrics
- 1% rule
- 1.13% ✓
- Cap rate
- 8.81%
- Cash-on-cash
- 8.98%
- DSCR
- 1.40
- GRM
- 7.4
CMA / ARV
- ARV (median comp)
- $303,070
- List price
- $295,000
- Delta
- -2.66%
- Verdict
- FAIR
- Comps
- 20 within 1.0 mi
Show comp detail 10 sales within ~0.75 mi
| Address | Dist | Beds/Ba | Sqft | Sold | Price | $/sf | Match |
|---|---|---|---|---|---|---|---|
| 9 Kenyon St | 0.15mi | 6/2.0 | 1,881 (-7%) | 2mo | $283,600 | $151 | 80 |
| 151 Beech St | 0.34mi | 5/2.0 (-1) | 2,128 (+6%) | 7mo | $330,000 | $155 | 64 |
| 107 Wolcott St | 0.22mi | 6/3.0 | 1,886 (-6%) | 21mo | $410,000 | $217 | 57 |
| 250 Orange St | 0.47mi | 6/2.0 | 2,248 (+11%) | 7mo | $355,000 | $158 | 53 |
| 1260 E Main St | 0.53mi | 5/2.0 (-1) | 2,182 (+8%) | 7mo | $340,000 | $156 | 50 |
| 61 E Dover St | 0.66mi | 5/2.0 (-1) | 2,024 (+0%) | 21mo | $269,999 | $133 | 46 |
| 18 Adams Street Ext | 0.70mi | 5/3.0 (-1) | 2,090 (+4%) | 16mo | $215,000 | $103 | 39 |
| 23 Robinson St | 0.70mi | 6/3.0 | 2,133 (+6%) | 20mo | $260,000 | $122 | 37 |
| 221 Long Hill Rd | 0.64mi | 5/3.0 (-1) | 2,160 (+7%) | 22mo | $295,000 | $137 | 31 |
| 133 Griggs St | 0.67mi | 7/2.0 (+1) | 2,280 (+13%) | 20mo | $315,000 | $138 | 25 |
Match score weights: distance 35% · size 25% · config 20% · recency 20%. Top-matched comps best support the ARV.
Projected returns pro-forma
3.0% appreciation · 3.0% rent growth · sell at horizon
- IRR
- 15.9%
- Equity multiple
- 1.91×
- Total profit
- $74,962
- Equity at exit
- $132,645
- IRR
- 17.5%
- Equity multiple
- 3.56×
- Total profit
- $211,754
- Equity at exit
- $204,421
Cash invested: $82,600 (down + closing). Projections, not guarantees.
Landlord ↔ Tenant lean methodology
- Overall (STATE)
- 27 Tenant-Leaning
- State Connecticut
- 27 Tenant-Leaning · D+7
- County
- — inherits STATE
- City
- — inherits STATE
ZIP-level market 06702
- Active inventory
- 5
- Price-to-rent
- 14.7×
Monthly cashflow live
- Estimated rent
- $3,336 high interval (Pro) →
- Mortgage (P&I)
- −$1,547
- Tax from tax record
- −$347 /mo · $4,165/yr
- Insurance
- −$123
- HOA
- −$0
- Vacancy / Maint / Mgmt
- −$701
- Net cashflow
- $618
Break-even live
2-unit breakdown (identical units grouped — click to expand)
| Units | Beds | Baths | Est. rent |
|---|---|---|---|
| 2× units | 3 | 1 | $3,336 |
| #1 | 3 | 1 | $1,668 |
| #2 | 3 | 1 | $1,668 |
| Total (2 units) | $3,336 | ||
UW: 25.0% down · 7.5% · 30yr · 1.5% tax · 5.0% vac · 8.0% maint · 8.0% mgmt
Financing live
Cash to close
- Down payment
- $73,750
- Closing costs
- $8,850
- Reserves months
- —
- Total cash needed
- —
Loan-product check · same deal, 3 products live
Conventional
25% down · 7.5% · 30yr
- Down + closing
- —
- Monthly P&I
- —
- Monthly cashflow
- —
- DSCR
- —
- Eligible?
- —
Personal DTI + credit; lowest rate.
DSCR
20% down · 8.5% · 30yr
- Down + closing
- —
- Monthly P&I
- —
- Monthly cashflow
- —
- DSCR
- —
- Eligible?
- —
No personal income docs; deal must DSCR.
Hard money
10% down · 12.0% · 12mo
- Down + closing
- —
- Monthly P&I
- —
- Monthly cashflow
- —
- DSCR
- —
- Eligible?
- —
Short-term bridge; refi at stabilization.
Rent comps 1 comps
| Address | Beds | Baths | Sqft | Rent | $/sqft | DOM | Units | Dist |
|---|---|---|---|---|---|---|---|---|
| 37 Johnson St Waterbury, CT | 6.0 | 1.5 | 2002 | $3,200 | $1.60 | 3d | 1 | 1.15mi |
Listing history 36 events
-
2026-06-18days on market $295,000 Active 99 DOM
-
2026-06-17days on market $295,000 Active 98 DOM
-
2026-06-16days on market $295,000 Active 97 DOM
-
2026-06-15days on market $295,000 Active 96 DOM
-
2026-06-14days on market $295,000 Active 94 DOM
-
2026-06-13days on market $295,000 Active 93 DOM
-
2026-06-10days on market $295,000 Active 91 DOM
-
2026-06-09days on market $295,000 Active 90 DOM
-
2026-06-08days on market $295,000 Active 89 DOM
-
2026-06-07days on market $295,000 Active 88 DOM
-
2026-06-05days on market $295,000 Active 85 DOM
-
2026-06-03days on market $295,000 Active 84 DOM
-
2026-06-03days on market $295,000 Active 83 DOM
-
2026-06-01days on market $295,000 Active 82 DOM
-
2026-05-31days on market $295,000 Active 81 DOM
-
2026-03-09$295,000 Active 621-char remark
Show marketing remark (621 chars)
Great opportunity for investors looking to build equity! This 2-family located at 48 Taylor Street in Waterbury offers strong potential with the right vision and renovations. Each unit provides a functional layout with separate living spaces, making it ideal for rental income or multi-generational living. Property requires repairs and updates but offers a solid opportunity to customize and increase value. Conveniently located near local amenities, shopping, schools, and major routes. Being sold as-is. Bring your ideas and make this property shine! PROPERTY IS BEING SOLD AS-IS AND IS SUBJECT TO SHORT SALE APPROVAL.
-
2020-08-24soldstatus $115,000
-
2019-09-10historical
-
2019-07-16$89,900
-
2012-06-15soldstatus $12,650
-
2011-07-17historical
-
2011-04-29$18,000
-
2011-02-17historical
-
2010-09-20$18,000
-
2008-03-24historical
-
2007-09-24$161,900
-
2005-04-06soldstatus $150,000
-
2005-02-23soldstatus $150,000
-
2004-12-01$154,900
-
2004-07-20soldstatus $120,000
-
2004-07-19soldstatus $120,000
-
2004-05-03$124,900
-
2001-06-07soldstatus $37,000
-
2001-06-06soldstatus $37,000
-
2001-05-30$44,900
-
1998-08-03soldstatus $72,000
ⓘ Source: listings_history table (triggers on properties + properties_extension) + one-shot
backfill from property_details.listing_events for pre-trigger history.
Tax reassessment forecast CT · Partial reset (capped growth)
- Current annual tax
- $4,165 · $347/mo
- Projected year-2 tax
- $5,239 · $437/mo
- Expected delta
- +$1,074/yr (+$90/mo · 25.8%)
ⓘ Screening estimate from a state-policy table — verify with the county assessor before closing.
Climate risk First Street
- Flood 5/10 Major FEMA zone X (unshaded) · 24% chance over 30 yrs
- Wildfire 1/10 Low
- Heat 5/10 Major 7 d/yr ≥96°F today · 15 d/yr by 30 yrs out
- Wind 6/10 Major 27% chance of damaging wind over 30 yrs
- Air quality 3/10 Moderate 2 unhealthy d/yr today · 3 by 30 yrs out
Nearby sold comps map
Loading sold comps map…
Walkable amenities ~0.75 mi
Loading nearby amenities…
Taxation est. · year 1
- Rental income
- $40,032
- − Mortgage interest
- −$16,525
- − Property taxes
- −$4,165
- − Insurance
- −$1,475
- − Repairs & maintenance
- −$3,203
- − Management
- −$3,203
- − Depreciation
- −$8,582
- Taxable income
- $2,880
- Est. tax owed @ 24.0%
- −$691
- After-tax cash flow
- $6,730/yr
For passive investors: Depreciation is non-cash, so a rental often shows a tax loss while cash-flowing — sheltering income. Rental losses are passive: they offset passive income freely, and up to $25,000/yr can offset ordinary (W-2) income if you actively participate and your MAGI is under $100k (phasing out to $0 by $150k); unused losses carry forward. On sale, claimed depreciation is recaptured at up to 25%, and gains may owe capital-gains tax (a 1031 exchange can defer both). Figures are a year-1 estimate at your 24.0% rate — not tax advice; consult a CPA.
Schools (NCES district)
- District
- Waterbury School District
- NCES district ID
- 0904830
- Math proficiency
- 12% ▼ -7.00%
- Reading proficiency
- 23% ▼ -8.00%
- Median HH income
- $40,040
- Composite
- 14.85/100
- National rank
- #9380
- State rank
- #148 of 153 in CT
Livability — Waterbury
- Score
- 79/100
- State rank
- #32
- US rank
- #2205
Category grades
Schools grade is shown separately in the Schools card above.
Census & demographics
- Census place
- Waterbury, CT
- County
- New Haven County · 688,236 people
- City population
- 115,012
- Metro
- New Haven-Milford, CT
- Population (ZIP)
- 2,946
- Household income
- $14,474
- Rent vs Own
- Severe rent burden
- 729.0
Population outlook (Naugatuck Valley County) Hauer SSP2
- By 2040
- 496,846
Race, ethnicity, and origin ACS 2023
- Neighborhood character
- Diverse neighborhood (Simpson 0.68)
- Race & ethnicity
- Black 37% Hispanic / Latino 36% White 24% Two or more races 7%
- Hispanic origin (detail)
- Mexican 2% Puerto Rican 20% Cuban 3% Dominican 9%
- Common ancestry
- Russian 1% Subsaharan African 1% Romanian 1%
- Foreign-born
- 10% · Canada
- Languages at home
- 68% English-only · Spanish 30% Other Indo-European 1%
Political lean MEDSL · Naugatuck Valley
- 2024 margin
- Lean R (+7.4) · D 45.6% · R 53.0% · Other 1.4%
- All cycles
- 2024: R+7.4
Not yet ingested
- Civics
- —
Market trends
- HPI YoY
- —
- Current HPI
- —
- Rent YoY
- —
- Metro
- New Haven-Milford, CT
- State GDP YoY
- ▲ 1.06%
- F500 in state
- 38
Industry mix (Fortune 500 HQ in CT)
| Industry | F500 HQs | Revenue |
|---|---|---|
| Industrial Machinery | 4 | $38B |
|
||
| Insurance | 3 | $71B |
|
||
| Financial Services | 2 | $25B |
|
||
| Transportation / Logistics | 2 | $18B |
|
||
| Healthcare | 1 | $247B |
|
||
| Telecommunications | 1 | $55B |
|
||
Price history
+309.7% since first listed21 events — show timeline
- 2026-03-09 Listed $295,000 Smart MLS
- 2020-08-24 Sold (Public Records) $115,000 Public Records
- 2019-09-10 Listing Removed — Smart MLS
- 2019-07-16 Listed $89,900 Smart MLS
- 2012-06-15 Sold (Public Records) $12,650 Public Records
- 2011-07-17 Listing Removed — Smart MLS
- 2011-04-29 Listed $18,000 Smart MLS
- 2011-02-17 Listing Removed — Smart MLS
- 2010-09-20 Listed $18,000 Smart MLS
- 2008-03-24 Listing Removed — Smart MLS
- 2007-09-24 Listed $161,900 Smart MLS
- 2005-04-06 Sold (Public Records) $150,000 Public Records
- 2005-02-23 Sold (MLS) $150,000 Smart MLS
- 2004-12-01 Listed $154,900 Smart MLS
- 2004-07-20 Sold (Public Records) $120,000 Public Records
- 2004-07-19 Sold (MLS) $120,000 Smart MLS
- 2004-05-03 Listed $124,900 Smart MLS
- 2001-06-07 Sold (Public Records) $37,000 Public Records
- 2001-06-06 Sold (MLS) $37,000 Smart MLS
- 2001-05-30 Listed $44,900 Smart MLS
- 1998-08-03 Sold (Public Records) $72,000 Public Records
Property tax history
+7.7%/yrLatest (2023): $4,165 · +123.2% YoY. Source: county tax records.
Cash-flow waterfall
monthlySold comps — $/sqft
last 12 mo · ≤1 miLoading sold comps…