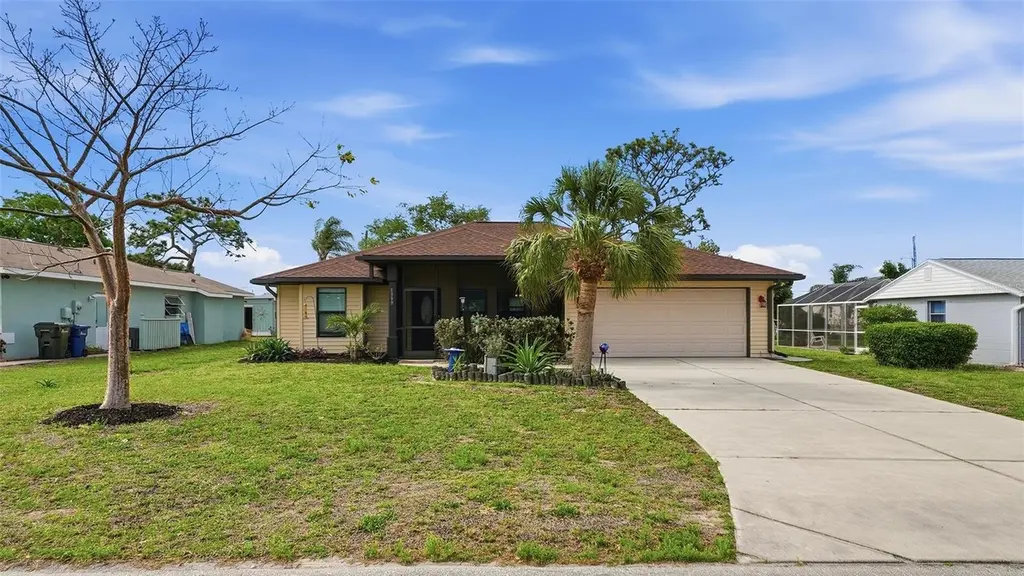
1339 Keyway Rd · Englewood, FL
Flood risk 6/10 · Moderate
- FEMA flood zone
- X (shaded)
- Chance of flooding over 30 yrs
- 0.54%
- Est. flood insurance / yr
- $507 – $1,088
Fire risk 3/10 · Minor
- Est. fire insurance / yr
- $947 – $1,759
Heat risk 10/10 · Severe
- Hot days now (above 107°F)
- 7 days/yr
- Hot days in 30 yrs
- 30 days/yr
Wind risk 10/10 · Severe
- Chance of severe wind over 30 yrs
- 99.0%
Air-quality risk 3/10 · Minor
- Unhealthy air days now
- 2 days/yr
- Unhealthy air days in 30 yrs
- 2 days/yr
Risk factors via First Street. Map © Google.
Why this score? — see what drove the D grade
The composite is a weighted blend of 9 inputs, each scored 0–100. Each bar is that input's sub-score; the figure is the points it added to the 100-point composite (weight × sub-score).
- Cash flow +10.8/30.0
- ARV discount +7.5/15.0
- Schools +5.4/10.0
- Rent growth +4.8/5.0
- Livability +3.7/5.0
- DSCR +3.1/10.0
- 1% rule +2.7/10.0
- Condition / age +2.5/5.0
- Appreciation +0.0/10.0
$365,000
🖨 Deal sheet 📄 Offer letter ✓ Due diligence
Listing remarks MLS
Nestled in the desirable Overbrook Gardens neighborhood of Englewood, 1339 Keyway Road is a beautifully maintained 3-bedroom, 2-bathroom home offering 1,514 square feet of thoughtfully designed living space. Built in 2006, this residence blends comfort and style with an open-concept great room featuring soaring vaulted ceilings, creating an inviting atmosphere that flows seamlessly from living to dining to kitchen. The kitchen is a true standout, boasting generous granite countertops and gleaming stainless steel appliances — perfect for everyday meals and effortless entertaining. Elegant 18-inch tile flooring spans the common areas while warm wood flooring adds character to each bedroom. Ceiling fans throughout keep the coastal breeze circulating in every room. A wall of sliding glass doors off the dining area opens to a generous screened lanai, ideal for morning coffee or evening relaxation. Out front, a second screened lanai welcomes you home in style. The fully fenced backyard provides privacy & security for room to roam, while the two-car garage offers ample storage. Retreat to a spacious primary suite complete with an ensuite bathroom and walk-in closet. Major updates include a new roof in late 2022 and a brand-new HVAC system in 2026, delivering true peace of mind. The low annual HOA supports community parks and a private boat ramp — a rare perk for water enthusiasts. Just minutes from Manasota Key Beach, Lemon Bay Park, and charming Dearborn Street, this home delivers the quintessential Florida lifestyle.
Key facts
- Wood flooring
- Screened lanai
- Granite countertops
Tags
Neighborhood map
What this means for you Summary
Snapshot
- This is a 3-bed/2.0-bath single-family listed at $365k.
Deal economics
- At list price, monthly cash flow is $-168 ($-2k/yr) — negative.
- To cash-flow at today's rent, offer at most $335k (8.1% below list).
- To meet the 1% rule (rent ≥ 1% of price), the offer needs to be $281k (23.1% below list).
- Recommended offer: $281k (23.1% below list) — sets the bar for 1% rule.
- Cap rate 5.7% vs local median 3.8% in Englewood — top-decile yield for the area; either an underpriced asset or a hidden risk that comps aren't pricing in. Stress-test before assuming the spread holds.
Location & tenants
- Location reads 73/100 on livability (#321 in FL) — a middle-class / working-renter tenant base. Strengths: housing A+, cost of living A, health & safety A; Watch: employment C-, amenities F, commute F.
- Sarasota (urban): math 63% / reading 63% proficiency, ranked #7 of 73 in FL (top 10%) — acceptable for families but not a draw, mixed tenant base, ~2y average lease.
- Market conditions: Rents rising fast (+9.0%/yr); 717 active listings in the ZIP; solid renter incomes; 7,466 units permitted in Sarasota County in 2024 (2,138 in 5+ unit buildings).
- This rent runs 44% of the median local income ($76k/yr) — at the standard rent-burdened threshold; future hikes will face affordability resistance.
Forward outlook
- Local home prices are declining (-3.0%/yr); year-one equity from $3k of loan paydown is wiped out by about $11k of value loss. Plan a longer hold.
- Sarasota County population projected at +20% by 2050 — long-run rental-demand tailwind backs the buy-and-hold thesis.
Negotiation context
- It's been on market 64 days — a 6% lower offer ($343k) is reasonable based on typical stale-listing flexibility.
- 4 sale attempts since 11y ago with the ask held roughly flat each time — persistent listings suggest the price (not the market) is what's stuck; bring a comps-based counter.
- Current owner paid $212k; list at $365k implies a 73% gain — meaningful room to come down on a strong offer.
Risks & watch-outs
- Climate carrying-cost: major flood risk; severe wind risk, 99% chance of damaging wind over 30y; extreme-heat days projected 7→30/yr by 2055 (HVAC capex compounding) — expect insurance premiums to compound above CPI over the hold.
Questions for the listing agent
- What do current leases actually rent for vs. the listed asking? Can we see a recent rent roll and the last 12 months of T-12 income?
- It's been on market 64 days. Have you received any prior offers? Is the seller open to a 23% concession, seller financing, or rate buy-down credit?
- What does the HOA fee cover, when was the last increase, and are there any pending special assessments or reserve-fund shortfalls?
- Why hasn't it sold? Are there any deal-killer items the seller is aware of (foundation, flood, title, zoning, code violations)?
- Is there a deadline driving the sale (1031 exchange, divorce, estate, relocation)? That informs how much negotiation room exists.
- Schools are A-rated — typically a magnet for longer-tenancy family renters. What's the average tenant stay here, and is there a school-zone premium baked into asking?
- The area grade is low — what's the realistic commute time and amenity access for the typical tenant pool here? Any planned neighborhood developments (good or bad) we should know about?
- What's the average days-on-market for RENTAL listings here right now (not sales)? A rising rental-DOM trend means longer vacancies and softer asking-rent achievability than the comps imply.
- What's the recent tenant-quality profile in this submarket — average credit score on applications, eviction rate, late-payment / NSF rate, and stable-employment percentage? A property-management company in the area should have these aggregated.
- How much new for-sale + rental construction is in the pipeline within 1–3 miles? Heavy new supply typically softens prices + rents 12–24 months out; constrained supply supports both.
Investment metrics
- 1% rule
- 0.77% ✗
- Cap rate
- 5.74%
- Cash-on-cash
- -1.97%
- DSCR
- 0.91
- GRM
- 10.8
CMA / ARV
No comps found within radius.
Projected returns pro-forma
-3.0% appreciation · 8.0% rent growth · sell at horizon
- IRR
- -14.4%
- Equity multiple
- 0.46×
- Total profit
- $-55,024
- Equity at exit
- $54,423
- IRR
- 0.7%
- Equity multiple
- 1.06×
- Total profit
- $5,698
- Equity at exit
- $31,559
Cash invested: $102,200 (down + closing). Projections, not guarantees.
Landlord ↔ Tenant lean methodology
- Overall (STATE)
- 87 Strongly Landlord-Friendly
- State Florida
- 87 Strongly Landlord-Friendly · R+3
- County
- — inherits STATE
- City
- — inherits STATE
ZIP-level market 34223
- Home prices YoY
- -34.2%
- Rents YoY
- 9.0%
- Active inventory
- 717
- Price-to-rent
- 10.8×
Monthly cashflow live
- Estimated rent
- $2,807 medium interval (Pro) →
- Mortgage (P&I)
- −$1,914
- Tax from tax record
- −$311 /mo · $3,734/yr
- Insurance
- −$152
- HOA
- −$8
- Vacancy / Maint / Mgmt
- −$590
- Net cashflow
- $-168
Break-even live
UW: 25.0% down · 7.5% · 30yr · 1.5% tax · 5.0% vac · 8.0% maint · 8.0% mgmt
Financing live
Cash to close
- Down payment
- $91,250
- Closing costs
- $10,950
- Reserves months
- —
- Total cash needed
- —
Loan-product check · same deal, 3 products live
Conventional
25% down · 7.5% · 30yr
- Down + closing
- —
- Monthly P&I
- —
- Monthly cashflow
- —
- DSCR
- —
- Eligible?
- —
Personal DTI + credit; lowest rate.
DSCR
20% down · 8.5% · 30yr
- Down + closing
- —
- Monthly P&I
- —
- Monthly cashflow
- —
- DSCR
- —
- Eligible?
- —
No personal income docs; deal must DSCR.
Hard money
10% down · 12.0% · 12mo
- Down + closing
- —
- Monthly P&I
- —
- Monthly cashflow
- —
- DSCR
- —
- Eligible?
- —
Short-term bridge; refi at stabilization.
HOA detail
- Monthly dues
- $8 · $96/yr
- Likely covers
- watersecurity
Listing history 26 events
-
2026-06-18days on market $365,000 Active 64 DOM
-
2026-06-17days on market $365,000 Active 63 DOM
-
2026-06-16days on market $365,000 Active 62 DOM
-
2026-06-15days on market $365,000 Active 61 DOM
-
2026-06-13days on market $365,000 Active 59 DOM
-
2026-06-13days on market $365,000 Active 58 DOM
-
2026-06-10days on market $365,000 Active 56 DOM
-
2026-06-09days on market $365,000 Active 55 DOM
-
2026-06-08days on market $365,000 Active 54 DOM
-
2026-06-08days on market $365,000 Active 53 DOM
-
2026-06-05days on market $365,000 Active 50 DOM
-
2026-06-03days on market $365,000 Active 49 DOM
-
2026-06-02days on market $365,000 Active 48 DOM
-
2026-06-01days on market $365,000 Active 47 DOM
-
2026-05-31days on market $365,000 Active 46 DOM
-
2026-04-15$365,000 Active 1555-char remark
Show marketing remark (1555 chars)
Nestled in the desirable Overbrook Gardens neighborhood of Englewood, 1339 Keyway Road is a beautifully maintained 3-bedroom, 2-bathroom home offering 1,514 square feet of thoughtfully designed living space. Built in 2006, this residence blends comfort and style with an open-concept great room featuring soaring vaulted ceilings, creating an inviting atmosphere that flows seamlessly from living to dining to kitchen. The kitchen is a true standout, boasting generous granite countertops and gleaming stainless steel appliances — perfect for everyday meals and effortless entertaining. Elegant 18-inch tile flooring spans the common areas while warm wood flooring adds character to each bedroom. Ceiling fans throughout keep the coastal breeze circulating in every room. A wall of sliding glass doors off the dining area opens to a generous screened lanai, ideal for morning coffee or evening relaxation. Out front, a second screened lanai welcomes you home in style. The fully fenced backyard provides privacy & security for room to roam, while the two-car garage offers ample storage. Retreat to a spacious primary suite complete with an ensuite bathroom and walk-in closet. Major updates include a new roof in late 2022 and a brand-new HVAC system in 2026, delivering true peace of mind. The low annual HOA supports community parks and a private boat ramp — a rare perk for water enthusiasts. Just minutes from Manasota Key Beach, Lemon Bay Park, and charming Dearborn Street, this home delivers the quintessential Florida lifestyle.
-
2023-10-12historical
-
2023-09-14price $430,000
-
2023-08-25status Active
-
2023-04-11price $435,000
-
2023-01-27$450,000 Active
-
2015-08-31soldstatus $211,500
-
2015-08-27soldstatus $211,500 Sold
-
2015-06-30status Pending
-
2015-06-10$235,000 Active
-
2002-10-07soldstatus $9,000
ⓘ Source: listings_history table (triggers on properties + properties_extension) + one-shot
backfill from property_details.listing_events for pre-trigger history.
Tax reassessment forecast FL · Resets to sale price
- Current annual tax
- $3,734 · $311/mo
- Projected year-2 tax
- $3,734 · $311/mo
- Expected delta
- $0/yr ($0/mo · 0.0%)
ⓘ Screening estimate from a state-policy table — verify with the county assessor before closing.
Climate risk First Street
- Flood 6/10 Major FEMA zone X (shaded) · 54% chance over 30 yrs
- Wildfire 3/10 Moderate
- Heat 10/10 Extreme 7 d/yr ≥107°F today · 30 d/yr by 30 yrs out
- Wind 10/10 Extreme 99% chance of damaging wind over 30 yrs
- Air quality 3/10 Moderate 2 unhealthy d/yr today · 2 by 30 yrs out
Nearby sold comps map
Loading sold comps map…
Walkable amenities ~0.75 mi
Loading nearby amenities…
Taxation est. · year 1
- Rental income
- $33,687
- − Mortgage interest
- −$20,446
- − Property taxes
- −$3,734
- − Insurance
- −$1,825
- − Repairs & maintenance
- −$2,695
- − Management
- −$2,695
- − HOA
- −$96
- − Depreciation
- −$10,618
- Taxable loss
- −$8,421
- Est. tax savings @ 24.0%
- +$2,021
- After-tax cash flow
- $10/yr
For passive investors: Depreciation is non-cash, so a rental often shows a tax loss while cash-flowing — sheltering income. Rental losses are passive: they offset passive income freely, and up to $25,000/yr can offset ordinary (W-2) income if you actively participate and your MAGI is under $100k (phasing out to $0 by $150k); unused losses carry forward. On sale, claimed depreciation is recaptured at up to 25%, and gains may owe capital-gains tax (a 1031 exchange can defer both). Figures are a year-1 estimate at your 24.0% rate — not tax advice; consult a CPA.
Schools (NCES district)
- District
- Sarasota
- NCES district ID
- 1201680
- Math proficiency
- 63% ▼ -8.00%
- Reading proficiency
- 63% ▼ -3.00%
- Median HH income
- $51,167
- Composite
- 53.68/100
- National rank
- #1428
- State rank
- #7 of 73 in FL
Livability — Englewood
- Score
- 73/100
- State rank
- #321
- US rank
- #5655
Category grades
Schools grade is shown separately in the Schools card above.
Census & demographics
- Census place
- Englewood, FL
- County
- Sarasota County · 448,376 people
- City population
- 35,420
- Metro
- North Port-Sarasota-Bradenton, FL
- Population (ZIP)
- 19,884
- Household income
- $76,016
- Rent vs Own
- Severe rent burden
- 290.0
Population outlook (Sarasota County) Hauer SSP2
- Today (2025)
- 452,380 people
- By 2030
- 474,175 · +4.8%
- By 2040
- 511,577 · +13.1%
- By 2050
- 541,467 · +19.7%
- By 2075
- 604,947 · +33.7%
- By 2100
- 621,965 · +37.5%
Race, ethnicity, and origin ACS 2023
- Neighborhood character
- Predominantly White (94%)
- Race & ethnicity
- White 94% Two or more races 3% Hispanic / Latino 3% Asian 1%
- Common ancestry
- Romanian 7% Lithuanian 4% Iranian 2%
- Foreign-born
- 9% · Canada
- Languages at home
- 94% English-only · German/W. Germanic 2% Spanish 1% Other Indo-European 1%
Political lean MEDSL · Sarasota
- 2024 margin
- R (+18.2) · D 40.5% · R 58.7%
- 2008→2024 swing
- -18.1pp toward R · 2008: -0.1pp · 2024: -18.2pp
- All cycles
- 2024: R+18.2 2020: R+10.4 2016: R+11.6 2012: R+7.4 2008: R+0.1
Not yet ingested
- Civics
- —
Market trends
- HPI YoY
- ▼ -146.26%
- Current HPI
- 281.0529
- Rent YoY
- ▲ 9.02%
- Metro
- North Port-Sarasota-Bradenton, FL
- State GDP YoY
- ▲ 3.28%
- F500 in state
- 36
Industry mix (Fortune 500 HQ in FL)
| Industry | F500 HQs | Revenue |
|---|---|---|
| Industrial Technology | 2 | $29B |
|
||
| Insurance | 2 | $17B |
|
||
| Retail | 1 | $60B |
|
||
| Technology Distribution | 1 | $58B |
|
||
| Homebuilding | 1 | $35B |
|
||
| Technology Manufacturing | 1 | $35B |
|
||
Price history
+3955.6% since first listed11 events — show timeline
- 2026-04-15 Listed $365,000 Stellar MLS as Distributed by MLS Grid
- 2023-10-12 Listing Removed — Stellar MLS as Distributed by MLS Grid
- 2023-09-14 Price Changed $430,000 Stellar MLS as Distributed by MLS Grid
- 2023-08-25 Relisted — Stellar MLS as Distributed by MLS Grid
- 2023-04-11 Price Changed $435,000 Stellar MLS as Distributed by MLS Grid
- 2023-01-27 Listed $450,000 Stellar MLS as Distributed by MLS Grid
- 2015-08-31 Sold (Public Records) $211,500 Public Records
- 2015-08-27 Sold (MLS) $211,500 Stellar MLS as Distributed by MLS Grid
- 2015-06-30 Pending — Stellar MLS as Distributed by MLS Grid
- 2015-06-10 Listed $235,000 Stellar MLS as Distributed by MLS Grid
- 2002-10-07 Sold (Public Records) $9,000 Public Records
Property tax history
+8.7%/yrLatest (2025): $3,734 · -7.6% YoY. Source: county tax records.
Cash-flow waterfall
monthlySold comps — $/sqft
last 12 mo · ≤1 miLoading sold comps…