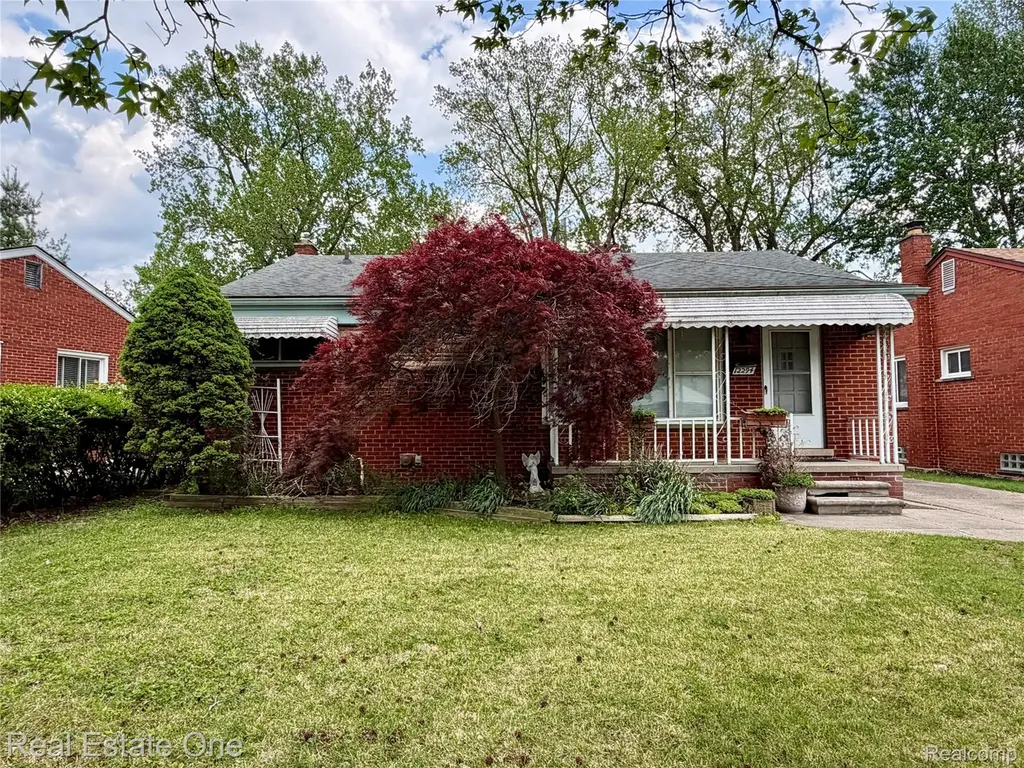
12294 Nathaline St · Livonia, MI
Flood risk No data
- FEMA flood zone
- —
- Chance of flooding over 30 yrs
- —
- Est. flood insurance / yr
- —
Fire risk No data
- Est. fire insurance / yr
- —
Heat risk No data
- Hot days now (above threshold)
- —
- Hot days in 30 yrs
- —
Wind risk No data
- Chance of severe wind over 30 yrs
- —
Air-quality risk No data
- Unhealthy air days now
- —
- Unhealthy air days in 30 yrs
- —
Risk factors via First Street. Map © Google.
Why this score? — see what drove the C grade
The composite is a weighted blend of 9 inputs, each scored 0–100. Each bar is that input's sub-score; the figure is the points it added to the 100-point composite (weight × sub-score).
- Cash flow +23.6/30.0
- ARV discount +10.7/15.0
- DSCR +7.6/10.0
- 1% rule +5.2/10.0
- Livability +3.9/5.0
- Rent growth +3.3/5.0
- Condition / age +2.5/5.0
- Schools +1.8/10.0
- Appreciation +0.0/10.0
$174,900
🖨 Deal sheet (PDF) 📄 Offer letter ✓ Due diligence
Listing remarks MLS
* * WELCOME TO 12294 NATHALINE, BRING YOUR PERSONAL TOUCHES TO MAKE THIS REDFORD RANCH YOUR OWN * * THREE BEDS, 2 FULL BATHS AND 1,046 SQ. FEET OF LIVING SPACE * * HARDWOOD FLOORING THROUGHOUT THE MAIN LEVEL, INCLUDING IN ALL THREE BEDROOMS * * GOOD SIZED KITCHEN WITH ALL APPLIANCES TO REMAIN * * FULL BASEMENT WITH SECOND HALF BATH * * WASHER AND DRYER TO REMAIN * * DEEP YARD WITH 1.5-CAR GARAGE * * MASSIVE PARK WITH BASEBALL FIELDS, WATER PARK & MORE DIRECTLY BEHIND * * KEYS AT CLOSING * * BUYERS WILL ASSUME THE CITY INSPECTION REPORT * * PRICED TO MOVE!!! * *
Key facts
- Hardwood flooring
- Good sized kitchen
- Full basement
Tags
Property features AI
Exterior
- Parking: Detached garage (1.5 car)
- Utilities: Public water; Public sewer
- Home design: Single-family residence; One level; Entry located at lower level with steps; Brick construction
- Construction: Asphalt roof; Finished below-grade area (basement)
- Exterior features: Covered porch; Paved road access; Back yard with fencing (fenced)
Interior
- Kitchen: Dishwasher; Free-standing electric range; Free-standing refrigerator; Microwave
- Bedrooms: 6 total rooms (includes bedrooms and living spaces)
- Bathrooms: 1 full bathroom; 1 half bathroom
- Heating & cooling: Forced air heating (natural gas); Central air conditioning; Attic fan; Ceiling fan(s)
- Interior features: Finished full basement; Gas water heater; Disposal
- Laundry & utility: Washer; Dryer
Neighborhood map
What this means for you Summary
Snapshot
- This is a 3-bed/1.0-bath single-family listed at $175k.
Deal economics
- At list price, monthly cash flow is $331 ($4k/yr) — positive.
- The deal already cash-flows at list — no discount required.
- Meets the 1% rule at list price ($2k rent vs $175k).
- Recommended offer: $172k (1.5% below list) — sets the bar for market timing.
- Cap rate 8.6% vs local median 4.9% in Livonia — top-decile yield for the area; either an underpriced asset or a hidden risk that comps aren't pricing in. Stress-test before assuming the spread holds.
Location & tenants
- Location reads 77/100 on livability (#116 in MI, #2,784 nationally) — a middle-class / working-renter tenant base. Strengths: employment A+, cost of living A+, housing A+; Watch: amenities D, health & safety D, commute F.
- South Redford School District (suburban): math 11% / reading 29% proficiency, ranked #455 of 540 in MI (top 84%) — low school quality limits family demand, transient renter base, plan for 1-2y turnover.
- Zoned schools: Fisher Elementary School (math 22% / reading 27%, grade F, #980 of 1,397 statewide, top 74%, 310 students, 83% FRL); John D Pierce Middle School (math 8% / reading 29%, grade F, #432 of 493 statewide, top 88%, 602 students, 68% FRL); Lee M Thurston High School (math 12% / reading 32%, grade F, #582 of 713 statewide, top 83%, 883 students, 62% FRL) — zoned schools average 71% FRL vs 52% district-wide (20 pts higher); higher-poverty schools than district average — tighter screening recommended.
- Market conditions: Rents rising (+3.2%/yr); 193 active listings in the ZIP; 5 comparable units currently listed for rent nearby; rentals leasing fast (median 12d on market — plan ~1-2 weeks tenant-placement turnaround); 2,639 units permitted in Wayne County in 2024 (1,216 in 5+ unit buildings).
- This rent runs 30% of the median local income ($71k/yr) — at the standard rent-burdened threshold; future hikes will face affordability resistance.
Forward outlook
- Local home prices are declining (-3.0%/yr); year-one equity from $1k of loan paydown is wiped out by about $5k of value loss. Plan a longer hold.
- Wayne County population projected at -17% by 2050 — secular population decline; favor cash flow + early exit over multi-decade hold.
Negotiation context
- It's been on market 25 days — a 2% lower offer ($172k) is reasonable based on typical stale-listing flexibility.
- 2 sale attempts with the ask held roughly flat each time — persistent listings suggest the price (not the market) is what's stuck; bring a comps-based counter.
- Current owner paid $93k; list at $175k implies a 88% gain — meaningful room to come down on a strong offer.
Risks & watch-outs
- Watch-outs: built in 1954 — expect roof / HVAC / electrical / plumbing capex.
Questions for the listing agent
- Built in 1954 — when were the roof, HVAC, electrical panel, plumbing, and water heater last replaced?
- Is there a deadline driving the sale (1031 exchange, divorce, estate, relocation)? That informs how much negotiation room exists.
- Schools are B-rated — typically a magnet for longer-tenancy family renters. What's the average tenant stay here, and is there a school-zone premium baked into asking?
- What's the average days-on-market for RENTAL listings here right now (not sales)? A rising rental-DOM trend means longer vacancies and softer asking-rent achievability than the comps imply.
- What's the recent tenant-quality profile in this submarket — average credit score on applications, eviction rate, late-payment / NSF rate, and stable-employment percentage? A property-management company in the area should have these aggregated.
- How much new for-sale + rental construction is in the pipeline within 1–3 miles? Heavy new supply typically softens prices + rents 12–24 months out; constrained supply supports both.
Investment metrics
- 1% rule
- 1.02% ✓
- Cap rate
- 8.56%
- Cash-on-cash
- 8.11%
- DSCR
- 1.36
- GRM
- 8.2
CMA / ARV
- ARV (on-the-fly)
- $188,280
- Comps found
- 12
Show comp detail 12 sales within ~0.75 mi
| Address | Dist | Beds/Ba | Sqft | Sold | Price | $/sf | Match |
|---|---|---|---|---|---|---|---|
| 11757 Eileen | 0.31mi | 3/1.0 | 1,040 (-1%) | 0mo | $220,000 | $212 | 84 |
| 12770 Leverne | 0.33mi | 3/1.5 | 1,026 (-2%) | 1mo | $205,000 | $200 | 79 |
| 12135 Leverne | 0.21mi | 2/1.5 (-1) | 1,050 (+0%) | 6mo | $167,000 | $159 | 77 |
| 11748 Leverne | 0.33mi | 3/1.5 | 1,075 (+3%) | 4mo | $142,000 | $132 | 74 |
| 12890 Hemingway | 0.38mi | 3/1.5 | 1,094 (+5%) | 1mo | $135,000 | $123 | 72 |
| 12009 Arcola St | 0.48mi | 3/1.0 | 1,018 (-3%) | 8mo | $192,500 | $189 | 67 |
| 9983 Hemingway | 0.66mi | 3/1.0 | 1,059 (+1%) | 3mo | $149,000 | $141 | 65 |
| 12111 Inkster Rd | 0.39mi | 3/1.0 | 1,147 (+10%) | 3mo | $155,000 | $135 | 63 |
| 13221 Columbia St | 0.49mi | 3/1.5 | 1,102 (+5%) | 8mo | $202,000 | $183 | 59 |
| 13965 Minock Dr | 0.70mi | 3/1.5 | 1,042 (-0%) | 8mo | $172,000 | $165 | 58 |
| 11756 Berwyn | 0.52mi | 2/1.5 (-1) | 930 (-11%) | 2mo | $167,500 | $180 | 49 |
| 11610 Cavell St | 0.59mi | 2/1.5 (-1) | 944 (-10%) | 9mo | $208,000 | $220 | 42 |
Match score weights: distance 35% · size 25% · config 20% · recency 20%. Top-matched comps best support the ARV.
Projected returns pro-forma
-3.0% appreciation · 3.25% rent growth · sell at horizon
- IRR
- -3.7%
- Equity multiple
- 0.86×
- Total profit
- $-6,870
- Equity at exit
- $26,078
- IRR
- 6.2%
- Equity multiple
- 1.47×
- Total profit
- $22,795
- Equity at exit
- $15,122
Cash invested: $48,972 (down + closing). Projections, not guarantees.
Landlord ↔ Tenant lean methodology
- Overall (STATE)
- 62 Landlord-Friendly
- State Michigan
- 62 Landlord-Friendly · EVEN
- County
- — inherits STATE
- City
- — inherits STATE
ZIP-level market 48239
- Rents YoY
- 3.2%
- Active inventory
- 193
- Price-to-rent
- 8.2×
Monthly cashflow live
- Estimated rent
- $1,784 high interval (Pro) →
- Mortgage (P&I)
- −$917
- Tax from tax record
- −$89 /mo · $1,062/yr
- Insurance
- −$73
- HOA
- −$0
- Vacancy / Maint / Mgmt
- −$375
- Net cashflow
- $331
Break-even live
Sensitivity live
| Price | -10% $430 | -5% $380 | +0% $331 | +5% $281 | +10% $232 |
|---|---|---|---|---|---|
| Rent | -10% $190 | -5% $260 | +0% $331 | +5% $401 | +10% $472 |
| Rate | -1.0pp $419 | -0.5pp $375 | base $331 | +0.5pp $286 | +1.0pp $239 |
UW: 25.0% down · 7.5% · 30yr · 1.5% tax · 5.0% vac · 8.0% maint · 8.0% mgmt
Financing live
Cash to close
- Down payment
- $43,725
- Closing costs
- $5,247
- Reserves months
- —
- Total cash needed
- —
Loan-product check · same deal, 3 products live
Conventional
25% down · 7.5% · 30yr
- Down + closing
- —
- Monthly P&I
- —
- Monthly cashflow
- —
- DSCR
- —
- Eligible?
- —
Personal DTI + credit; lowest rate.
DSCR
20% down · 8.5% · 30yr
- Down + closing
- —
- Monthly P&I
- —
- Monthly cashflow
- —
- DSCR
- —
- Eligible?
- —
No personal income docs; deal must DSCR.
Hard money
10% down · 12.0% · 12mo
- Down + closing
- —
- Monthly P&I
- —
- Monthly cashflow
- —
- DSCR
- —
- Eligible?
- —
Short-term bridge; refi at stabilization.
Rent comps 5 comps
| Address | Beds | Baths | Sqft | Rent | $/sqft | DOM | Units | Dist |
|---|---|---|---|---|---|---|---|---|
| 12097 Cavell St Livonia, MI | 3.0 | 1.0 | 985 | $1,200 | $1.22 | 3d | 1 | 0.52mi |
| 13231 Hemingway Redford, MI | 3.0 | 1.5 | 1074 | $1,700 | $1.58 | 18d | 1 | 0.53mi |
| 12107 Centralia Redford, MI | 3.0 | 1.0 | 912 | $1,800 | $1.97 | 45d | 1 | 0.54mi |
| 11726 Deering St Livonia, MI | 4.0 | 1.5 | 1248 | $2,125 | $1.70 | 0d | 1 | 0.66mi |
| 11141 Karen St Livonia, MI | 3.0 | 1.0 | 1322 | $1,950 | $1.48 | 12d | 1 | 1.43mi |
Listing history 13 events
-
2026-06-15statusdays on market $174,900 Pending 25 DOM
-
2026-06-13days on market $174,900 Active 24 DOM
-
2026-06-09days on market $174,900 Active 20 DOM
-
2026-06-08days on market $174,900 Active 19 DOM
-
2026-06-07days on market $174,900 Active 18 DOM
-
2026-06-04days on market $174,900 Active 15 DOM
-
2026-06-03days on market $174,900 Active 14 DOM
-
2026-06-02days on market $174,900 Active 13 DOM
-
2026-06-01days on market $174,900 Active 12 DOM
-
2026-05-31days on market $174,900 Active 11 DOM
-
2026-05-20$174,900 Active
Show marketing remark (607 chars)
* * WELCOME TO 12294 NATHALINE, BRING YOUR PERSONAL TOUCHES TO MAKE THIS REDFORD RANCH YOUR OWN * * THREE BEDS, 2 FULL BATHS AND 1,046 SQ. FEET OF LIVING SPACE * * HARDWOOD FLOORING THROUGHOUT THE MAIN LEVEL, INCLUDING IN ALL THREE BEDROOMS * * GOOD SIZED KITCHEN WITH ALL APPLIANCES TO REMAIN * * FULL BASEMENT WITH SECOND HALF BATH * * WASHER AND DRYER TO REMAIN * * DEEP YARD WITH 1.5-CAR GARAGE * * MASSIVE PARK WITH BASEBALL FIELDS, WATER PARK & MORE DIRECTLY BEHIND * * KEYS AT CLOSING * * BUYERS WILL ASSUME THE CITY INSPECTION REPORT * * PRICED TO MOVE!!! * *
-
2026-05-20$174,900 Active 607-char remark
Show marketing remark (607 chars)
* * WELCOME TO 12294 NATHALINE, BRING YOUR PERSONAL TOUCHES TO MAKE THIS REDFORD RANCH YOUR OWN * * THREE BEDS, 2 FULL BATHS AND 1,046 SQ. FEET OF LIVING SPACE * * HARDWOOD FLOORING THROUGHOUT THE MAIN LEVEL, INCLUDING IN ALL THREE BEDROOMS * * GOOD SIZED KITCHEN WITH ALL APPLIANCES TO REMAIN * * FULL BASEMENT WITH SECOND HALF BATH * * WASHER AND DRYER TO REMAIN * * DEEP YARD WITH 1.5-CAR GARAGE * * MASSIVE PARK WITH BASEBALL FIELDS, WATER PARK & MORE DIRECTLY BEHIND * * KEYS AT CLOSING * * BUYERS WILL ASSUME THE CITY INSPECTION REPORT * * PRICED TO MOVE!!! * *
-
1996-07-29soldstatus $93,000
ⓘ Source: listings_history table (triggers on properties + properties_extension) + one-shot
backfill from property_details.listing_events for pre-trigger history.
Tax reassessment forecast MI · Partial reset (capped growth)
- Current annual tax
- $1,062 · $89/mo
- Projected year-2 tax
- $1,878 · $156/mo
- Expected delta
- +$815/yr (+$68/mo · 76.8%)
ⓘ Screening estimate from a state-policy table — verify with the county assessor before closing.
Nearby sold comps map
Loading sold comps map…
Walkable amenities ~0.75 mi
Loading nearby amenities…
Taxation est. · year 1
- Rental income
- $21,410
- − Mortgage interest
- −$9,797
- − Property taxes
- −$1,062
- − Insurance
- −$874
- − Repairs & maintenance
- −$1,713
- − Management
- −$1,713
- − Depreciation
- −$5,088
- Taxable income
- $1,162
- Est. tax owed @ 24.0%
- −$279
- After-tax cash flow
- $3,692/yr
For passive investors: Depreciation is non-cash, so a rental often shows a tax loss while cash-flowing — sheltering income. Rental losses are passive: they offset passive income freely, and up to $25,000/yr can offset ordinary (W-2) income if you actively participate and your MAGI is under $100k (phasing out to $0 by $150k); unused losses carry forward. On sale, claimed depreciation is recaptured at up to 25%, and gains may owe capital-gains tax (a 1031 exchange can defer both). Figures are a year-1 estimate at your 24.0% rate — not tax advice; consult a CPA.
Schools (NCES district)
- District
- South Redford School District
- NCES district ID
- 2632280
- Math proficiency
- 11% ▼ -9.00%
- Reading proficiency
- 29% ▼ -7.00%
- Median HH income
- $52,775
- Composite
- 18.1/100
- National rank
- #8972
- State rank
- #455 of 540 in MI
Livability — Livonia
- Score
- 77/100
- State rank
- #116
- US rank
- #2784
Category grades
Schools grade is shown separately in the Schools card above.
Census & demographics
- County
- Wayne County · 1,562,939 people
- City population
- 56,806
- Metro
- Detroit-Warren-Dearborn, MI
- Population (ZIP)
- 36,976
- Household income
- $71,151
- Rent vs Own
- Severe rent burden
- 1052.0
Population outlook (Wayne County) Hauer SSP2
- Today (2025)
- 1,675,273 people
- By 2030
- 1,620,300 · -3.3%
- By 2040
- 1,502,341 · -10.3%
- By 2050
- 1,384,039 · -17.4%
- By 2075
- 1,124,592 · -32.9%
- By 2100
- 881,193 · -47.4%
Race, ethnicity, and origin ACS 2023
- Neighborhood character
- Majority Black (58%)
- Race & ethnicity
- Black 58% White 34% Hispanic / Latino 4% Two or more races 4%
- Common ancestry
- Romanian 7% Slovak 2% Lithuanian 2%
- Foreign-born
- 2% · Canada
- Languages at home
- 96% English-only · Spanish 1% Other Indo-European 1% Arabic 1%
Political lean MEDSL · Wayne
- 2024 margin
- Strong D (+29.0) · D 62.7% · R 33.7% · Other 3.6%
- 2008→2024 swing
- -20.5pp toward R · 2008: 49.5pp · 2024: 29.0pp
- All cycles
- 2024: D+29.0 2020: D+38.1 2016: D+37.3 2012: D+46.9 2008: D+49.5
Not yet ingested
- Civics
- —
Market trends
- HPI YoY
- ▼ -202.97%
- Current HPI
- 236.1136
- Rent YoY
- ▲ 3.25%
- Metro
- Detroit-Warren-Dearborn, MI
- State GDP YoY
- ▲ 1.37%
- F500 in state
- 28
Industry mix (Fortune 500 HQ in MI)
| Industry | F500 HQs | Revenue |
|---|---|---|
| Automotive Parts | 3 | $48B |
|
||
| Automotive | 2 | $372B |
|
||
| Chemicals | 1 | $45B |
|
||
| Automotive Retail | 1 | $29B |
|
||
| Healthcare / Medical Devices | 1 | $23B |
|
||
| Automotive Technology | 1 | $20B |
|
||
Price history
+88.1% since first listed3 events — show timeline
- 2026-05-20 Listed $174,900 MiRealSource-MiMLS
- 2026-05-20 Listed $174,900 REALCOMP
- 1996-07-29 Sold (Public Records) $93,000 Public Records
Property tax history
-3.7%/yrLatest (2025): $1,062 · -52.4% YoY. Source: county tax records.
Cash-flow waterfall
monthlySold comps — $/sqft
last 12 mo · ≤1 miLoading sold comps…