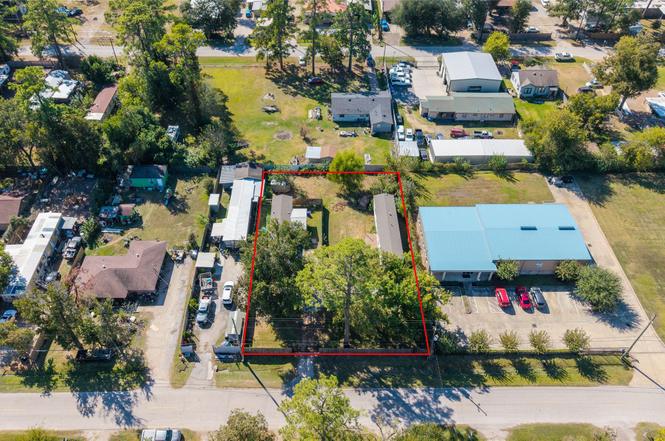
20631 Sunshine Ln · Houston, TX
Flood risk 1/10 · Minimal
- FEMA flood zone
- X (unshaded)
- Chance of flooding over 30 yrs
- 0.0%
- Est. flood insurance / yr
- $507 – $1,088
Fire risk 2/10 · Minimal
- Est. fire insurance / yr
- $1,222 – $2,270
Heat risk 8/10 · Major
- Hot days now (above 110°F)
- 7 days/yr
- Hot days in 30 yrs
- 22 days/yr
Wind risk 8/10 · Major
- Chance of severe wind over 30 yrs
- 99.0%
Air-quality risk 3/10 · Minor
- Unhealthy air days now
- 3 days/yr
- Unhealthy air days in 30 yrs
- 3 days/yr
Risk factors via First Street. Map © Google.
Why this score? — see what drove the D grade
The composite is a weighted blend of 9 inputs, each scored 0–100. Each bar is that input's sub-score; the figure is the points it added to the 100-point composite (weight × sub-score).
- Cash flow +15.0/30.0
- ARV discount +7.5/15.0
- 1% rule +5.0/10.0
- DSCR +5.0/10.0
- Livability +3.7/5.0
- Condition / age +2.5/5.0
- Rent growth +2.2/5.0
- Schools +2.0/10.0
- Appreciation +0.0/10.0
$300
🖨 Deal sheet (PDF) 📄 Offer letter ✓ Due diligence
Listing remarks
Cash-Producing Investment Opportunity! Fantastic location just off I-45 and only one block from FM 2920. This property sits on approximately 8,856 sqft lot and includes 1 manufactured home. With no deed restrictions, the possibilities are endless—ideal for residential, commercial, or mixed use. Enjoy the flexibility and potential this property offers in a prime, high-growth area.
Key facts
- 0.41 acre lot
- Built 1975
Neighborhood map
What this means for you Summary
Snapshot
- This is a 3-bed/2.0-bath manufactured listed at $300.
Deal economics
- At list price, monthly cash flow is $2k ($21k/yr) — positive.
- The deal already cash-flows at list — no discount required.
- Meets the 1% rule at list price ($2k rent vs $300).
- Cap rate 6898.1% vs local median 3.1% in Houston — top-decile yield for the area; either an underpriced asset or a hidden risk that comps aren't pricing in. Stress-test before assuming the spread holds.
Location & tenants
- Location reads 74/100 on livability (#184 in TX, #4,771 nationally) — a middle-class / working-renter tenant base. Strengths: amenities A+, cost of living A+, housing A+; Watch: crime F.
- Spring ISD (suburban): math 19% / reading 26% proficiency, ranked #730 of 826 in TX (top 88%) — low school quality limits family demand, transient renter base, plan for 1-2y turnover; 66% free/reduced lunch — lower-income household profile, screen leases tightly.
- Zoned schools: Springwoods Village Middle (math 22% / reading 29%, grade F, #1,236 of 1,662 statewide, top 76%, 511 students, 70% FRL); Spring H S (math 12% / reading 21%, grade F, #1,497 of 1,632 statewide, top 92%, 2,760 students, 72% FRL) — zoned schools at 71% FRL track the district average.
- Market conditions: Rents soft (-1.1%/yr); 325 active listings in the ZIP; 4 comparable units currently listed for rent nearby; rentals leasing fast (median 3d on market — plan ~1-2 weeks tenant-placement turnaround); solid renter incomes; 29,883 units permitted in Harris County in 2024 (8,621 in 5+ unit buildings).
Forward outlook
- Local home prices are declining (-3.0%/yr); year-one equity from $2 of loan paydown is wiped out by about $9 of value loss. Plan a longer hold.
- Harris County population projected at +47% by 2050 — long-run rental-demand tailwind backs the buy-and-hold thesis.
- At projected returns (-3.0% appreciation + 0.0% rent growth), your $84 cash investment doubles in ~1 year — after that, you're playing with house money.
Negotiation context
- Only 0 days on market — expect competitive offers; lowballing is unlikely to land.
Risks & watch-outs
- Climate carrying-cost: severe wind risk, 99% chance of damaging wind over 30y; extreme-heat days projected 7→22/yr by 2055 (HVAC capex compounding) — expect insurance premiums to compound above CPI over the hold.
Questions for the listing agent
- Built in 1975 — when were the roof, HVAC, electrical panel, plumbing, and water heater last replaced?
- Is there a deadline driving the sale (1031 exchange, divorce, estate, relocation)? That informs how much negotiation room exists.
- Schools are D-rated, which usually means shorter tenancies and higher turnover. Who's the typical renter profile here, and what's been the actual vacancy rate?
- Crime grade is F in this area — have there been break-ins, vandalism, or insurance claims at this property in the last 3 years? What carrier currently insures it and at what premium?
- The area grade is low — what's the realistic commute time and amenity access for the typical tenant pool here? Any planned neighborhood developments (good or bad) we should know about?
- What's the average days-on-market for RENTAL listings here right now (not sales)? A rising rental-DOM trend means longer vacancies and softer asking-rent achievability than the comps imply.
- What's the recent tenant-quality profile in this submarket — average credit score on applications, eviction rate, late-payment / NSF rate, and stable-employment percentage? A property-management company in the area should have these aggregated.
- How much new for-sale + rental construction is in the pipeline within 1–3 miles? Heavy new supply typically softens prices + rents 12–24 months out; constrained supply supports both.
Investment metrics
- 1% rule
- 727.86% ✓
- Cap rate
- 6898.08%
- Cash-on-cash
- 24613.53%
- DSCR
- 1096.16
- GRM
- 0.0
CMA / ARV
No comps found within radius.
Projected returns pro-forma
-3.0% appreciation · 0.0% rent growth · sell at horizon
- IRR
- —
- Equity multiple
- 1231.01×
- Total profit
- $103,321
- Equity at exit
- $45
- IRR
- —
- Equity multiple
- 2461.42×
- Total profit
- $206,675
- Equity at exit
- $26
Cash invested: $84 (down + closing). Projections, not guarantees.
Landlord ↔ Tenant lean methodology
- Overall (STATE)
- 87 Strongly Landlord-Friendly
- State Texas
- 87 Strongly Landlord-Friendly · R+5
- County
- — inherits STATE
- City
- — inherits STATE
ZIP-level market 77388
- Home prices YoY
- -34.8%
- Rents YoY
- -1.1%
- Active inventory
- 325
Monthly cashflow live
- Estimated rent
- $2,184 medium interval (Pro) →
- Mortgage (P&I)
- −$2
- Tax est. 1.5%
- −$0 /mo · $4/yr
- Insurance
- −$0
- HOA
- −$0
- Vacancy / Maint / Mgmt
- −$459
- Net cashflow
- $1,723
Break-even live
Sensitivity live
| Price | -10% $1,723 | -5% $1,723 | +0% $1,723 | +5% $1,723 | +10% $1,723 |
|---|---|---|---|---|---|
| Rent | -10% $1,550 | -5% $1,637 | +0% $1,723 | +5% $1,809 | +10% $1,895 |
| Rate | -1.0pp $1,723 | -0.5pp $1,723 | base $1,723 | +0.5pp $1,723 | +1.0pp $1,723 |
UW: 25.0% down · 7.5% · 30yr · 1.5% tax · 5.0% vac · 8.0% maint · 8.0% mgmt
Financing live
Cash to close
- Down payment
- $75
- Closing costs
- $9
- Reserves months
- —
- Total cash needed
- —
Loan-product check · same deal, 3 products live
Conventional
25% down · 7.5% · 30yr
- Down + closing
- —
- Monthly P&I
- —
- Monthly cashflow
- —
- DSCR
- —
- Eligible?
- —
Personal DTI + credit; lowest rate.
DSCR
20% down · 8.5% · 30yr
- Down + closing
- —
- Monthly P&I
- —
- Monthly cashflow
- —
- DSCR
- —
- Eligible?
- —
No personal income docs; deal must DSCR.
Hard money
10% down · 12.0% · 12mo
- Down + closing
- —
- Monthly P&I
- —
- Monthly cashflow
- —
- DSCR
- —
- Eligible?
- —
Short-term bridge; refi at stabilization.
Rent comps 4 comps
| Address | Beds | Baths | Sqft | Rent | $/sqft | DOM | Units | Dist |
|---|---|---|---|---|---|---|---|---|
| 2539 Spring Cypress Rd Spring, TX | 1.0–3.0 | 1.0–3.0 | 1086 | $2,214 | $2.04 | 3d | 20 | 0.75mi |
| 2555 Farm to Market 2920 Spring, TX | 1.0–2.0 | 1.0–2.0 | 935 | $1,941 | $2.07 | 2d | 12 | 0.94mi |
| 2953 FM 2920 Rd Spring, TX | 1.0–3.0 | 1.0–2.0 | 996 | $2,280 | $2.29 | 2d | 23 | 1.15mi |
| 21400 Big Spring Valley Ave Spring, TX | 1.0–3.0 | 1.0–2.5 | 1074 | $2,370 | $2.21 | 3d | 67 | 1.17mi |
Listing history 6 events
-
2026-06-17pricedays on market $300 Pending
-
2026-04-17status Pending
-
2026-04-16status Pending
-
2026-02-26price $200,000
-
2025-12-18price $350,000
-
2025-11-12$370,000 Active
ⓘ Source: listings_history table (triggers on properties + properties_extension) + one-shot
backfill from property_details.listing_events for pre-trigger history.
Climate risk First Street
- Flood 1/10 Low FEMA zone X (unshaded) · 0% chance over 30 yrs
- Wildfire 2/10 Low
- Heat 8/10 Severe 7 d/yr ≥110°F today · 22 d/yr by 30 yrs out
- Wind 8/10 Severe 99% chance of damaging wind over 30 yrs
- Air quality 3/10 Moderate 3 unhealthy d/yr today · 3 by 30 yrs out
Nearby sold comps map
Loading sold comps map…
Walkable amenities ~0.75 mi
Loading nearby amenities…
Taxation est. · year 1
- Rental income
- $26,203
- − Mortgage interest
- −$17
- − Property taxes
- −$4
- − Insurance
- −$2
- − Repairs & maintenance
- −$2,096
- − Management
- −$2,096
- − Depreciation
- −$9
- Taxable income
- $21,979
- Est. tax owed @ 24.0%
- −$5,275
- After-tax cash flow
- $15,400/yr
For passive investors: Depreciation is non-cash, so a rental often shows a tax loss while cash-flowing — sheltering income. Rental losses are passive: they offset passive income freely, and up to $25,000/yr can offset ordinary (W-2) income if you actively participate and your MAGI is under $100k (phasing out to $0 by $150k); unused losses carry forward. On sale, claimed depreciation is recaptured at up to 25%, and gains may owe capital-gains tax (a 1031 exchange can defer both). Figures are a year-1 estimate at your 24.0% rate — not tax advice; consult a CPA.
Schools (NCES district)
- District
- Spring ISD
- NCES district ID
- 4841220
- Math proficiency
- 19% ▼ -13.00%
- Reading proficiency
- 26% ▼ -6.00%
- Median HH income
- $51,584
- Composite
- 20.12/100
- National rank
- #8643
- State rank
- #730 of 826 in TX
Livability — Houston
- Score
- 74/100
- State rank
- #184
- US rank
- #4771
Category grades
Schools grade is shown separately in the Schools card above.
Census & demographics
- County
- Harris County · 4,702,590 people
- City population
- 3,226,434
- Metro
- Houston-The Woodlands-Sugar Land, TX
- Population (ZIP)
- 53,425
- Household income
- $102,323
- Rent vs Own
- Severe rent burden
- 1419.0
Population outlook (Harris County) Hauer SSP2
- Today (2025)
- 5,571,493 people
- By 2030
- 6,089,821 · +9.3%
- By 2040
- 7,142,806 · +28.2%
- By 2050
- 8,185,864 · +46.9%
- By 2075
- 10,574,329 · +89.8%
- By 2100
- 12,109,958 · +117.4%
Race, ethnicity, and origin ACS 2023
- Neighborhood character
- Diverse neighborhood (Simpson 0.70)
- Race & ethnicity
- White 45% Hispanic / Latino 25% Black 18% Two or more races 12% Asian 8%
- Hispanic origin (detail)
- Mexican 15%
- Common ancestry
- Slovak 2% Lithuanian 2% Romanian 1%
- Foreign-born
- 15% · Canada, Vietnam, China
- Languages at home
- 74% English-only · Spanish 18% Other Indo-European 2% Other Asian/Pacific 1%
Political lean MEDSL · Harris
- 2024 margin
- Lean D (+5.5) · D 52.0% · R 46.4% · Other 1.6%
- 2008→2024 swing
- +3.9pp toward D · 2008: 1.6pp · 2024: 5.5pp
- All cycles
- 2024: D+5.5 2020: D+13.3 2016: D+12.4 2012: D+0.1 2008: D+1.6
Not yet ingested
- Civics
- —
Market trends
- HPI YoY
- ▼ -121.68%
- Current HPI
- 228.128
- Rent YoY
- ▼ -1.08%
- Metro
- Houston-The Woodlands-Sugar Land, TX
- State GDP YoY
- ▲ 3.95%
- F500 in state
- 110
Industry mix (Fortune 500 HQ in TX)
| Industry | F500 HQs | Revenue |
|---|---|---|
| Energy | 16 | $1,198B |
|
||
| Technology | 5 | $198B |
|
||
| Engineering / Construction | 4 | $72B |
|
||
| Energy Services | 3 | $60B |
|
||
| Utilities | 3 | $41B |
|
||
| Healthcare | 2 | $330B |
|
||
Price history
-45.9% since first listed5 events — show timeline
- 2026-04-17 Pending — HARMLS
- 2026-04-16 Pending — HARMLS
- 2026-02-26 Price Changed $200,000 HARMLS
- 2025-12-18 Price Changed $350,000 HARMLS
- 2025-11-12 Listed $370,000 HARMLS
Property tax history
+0.5%/yrLatest (2025): $697 · -4.3% YoY. Source: county tax records.
Cash-flow waterfall
monthlySold comps — $/sqft
last 12 mo · ≤1 miLoading sold comps…