 🏗️ New Construction
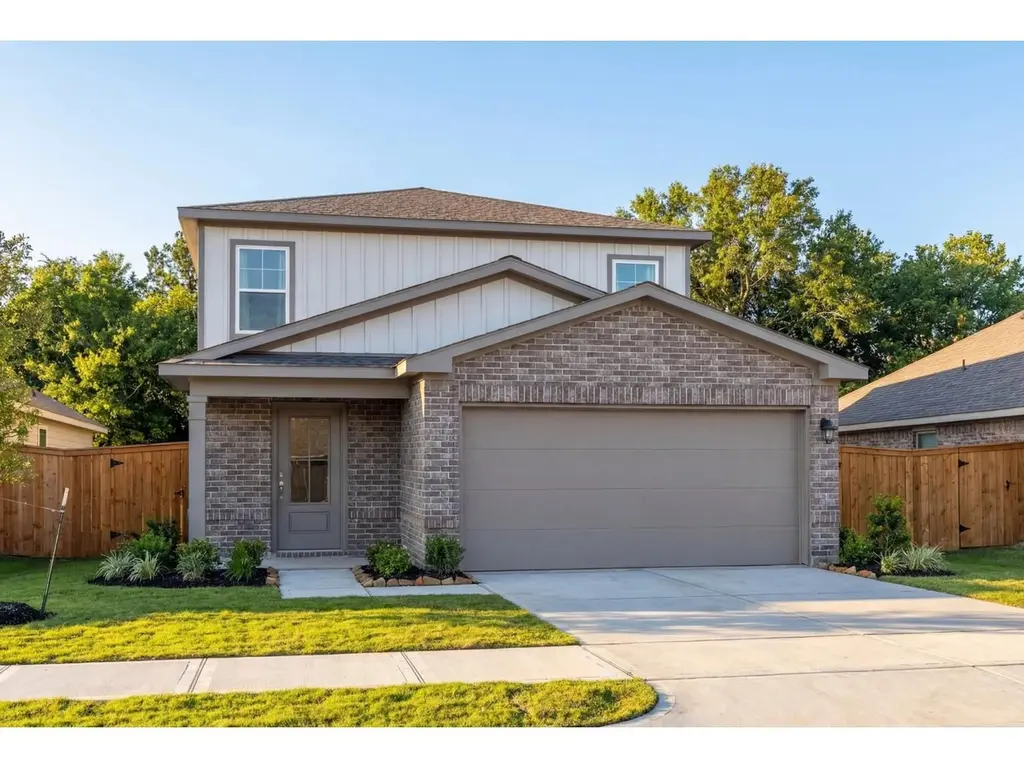
The San Marcos F Plan · Magnolia, TX
Flood risk 1/10 · Minimal
- FEMA flood zone
- X (unshaded)
- Chance of flooding over 30 yrs
- 0.0%
- Est. flood insurance / yr
- $507 – $1,088
Fire risk 5/10 · Moderate
- Est. fire insurance / yr
- $1,222 – $2,270
Heat risk 8/10 · Major
- Hot days now (above 111°F)
- 7 days/yr
- Hot days in 30 yrs
- 24 days/yr
Wind risk 8/10 · Major
- Chance of severe wind over 30 yrs
- 99.0%
Air-quality risk 2/10 · Minimal
- Unhealthy air days now
- 1 days/yr
- Unhealthy air days in 30 yrs
- 1 days/yr
Risk factors via First Street. Map © Google.
Why this score? — see what drove the D grade
The composite is a weighted blend of 9 inputs, each scored 0–100. Each bar is that input's sub-score; the figure is the points it added to the 100-point composite (weight × sub-score).
- Appreciation +10.0/10.0
- ARV discount +7.5/15.0
- Cash flow +7.2/30.0
- Condition / age +4.0/5.0
- Schools +3.9/10.0
- Livability +3.7/5.0
- Rent growth +2.6/5.0
- 1% rule +2.0/10.0
- DSCR +1.3/10.0
$332,990
🖨 Deal sheet 📄 Offer letter ✓ Due diligence
Listing remarks MLS
Welcome to The San Marcos, a two-story home perfect for any family! On the main floor, you can enjoy an open concept family and kitchen area that includes a spacious pantry. The primary suite is on the main floor along with a guest room and bathroom. Upstairs, there are three additional bedrooms as well as another bathroom and large loft space. Each bedroom has great storage space with large walk-in closets. Make it your own with The San Marcos' flexible floor plan. From additional garage space to a covered patio, you've got every opportunity to make The San Marcos your dream home. Just know that offerings vary by location, so please discuss our standard features and upgrade options with your community's agent.
Key facts
- Spacious pantry
- Flexible floor plan
- Covered patio
Tags
Neighborhood map
What this means for you Summary
Snapshot
- This is a 5-bed/3.0-bath single-family listed at $333k. Condition is rated good.
Deal economics
- At list price, monthly cash flow is $-469 ($-6k/yr) — negative.
- To cash-flow at today's rent, offer at most $269k (19.2% below list).
- To meet the 1% rule (rent ≥ 1% of price), the offer needs to be $235k (29.3% below list).
- Recommended offer: $235k (29.3% below list) — sets the bar for 1% rule.
- Cap rate 4.6% vs local median 3.4% in Magnolia — top-decile yield for the area; either an underpriced asset or a hidden risk that comps aren't pricing in. Stress-test before assuming the spread holds.
Location & tenants
- Location reads 73/100 on livability (#222 in TX) — a middle-class / working-renter tenant base. Strengths: crime A+, cost of living A+, housing A+; Watch: schools D+, amenities F, commute F.
- Magnolia ISD (rural): math 42% / reading 45% proficiency, ranked #247 of 826 in TX (top 30%) — families likely to look elsewhere, expect single-tenant / working-renter base with shorter leases.
- Market conditions: Rents flat; 1604 active listings in the ZIP; 1 comparable units currently listed for rent nearby; high-income renter base; 13,259 units permitted in Montgomery County in 2024 (1,402 in 5+ unit buildings).
Forward outlook
- In year one you build about $36k of equity ($2k loan paydown + $34k appreciation (10.0% local appreciation)).
- Montgomery County population projected at +65% by 2050 — long-run rental-demand tailwind backs the buy-and-hold thesis.
- By year 2, paydown + projected appreciation supports a ~$58k cash-out refi (75% LTV) — recoverable capital for the next deal without selling this one.
Negotiation context
- It's been on market 76 days — a 6% lower offer ($313k) is reasonable based on typical stale-listing flexibility.
Risks & watch-outs
- Climate carrying-cost: severe wind risk, 99% chance of damaging wind over 30y; moderate wildfire risk; extreme-heat days projected 7→24/yr by 2055 (HVAC capex compounding) — expect insurance premiums to compound above CPI over the hold.
Questions for the listing agent
- What do current leases actually rent for vs. the listed asking? Can we see a recent rent roll and the last 12 months of T-12 income?
- It's been on market 76 days. Have you received any prior offers? Is the seller open to a 29% concession, seller financing, or rate buy-down credit?
- Why hasn't it sold? Are there any deal-killer items the seller is aware of (foundation, flood, title, zoning, code violations)?
- Is there a deadline driving the sale (1031 exchange, divorce, estate, relocation)? That informs how much negotiation room exists.
- Schools are D-rated, which usually means shorter tenancies and higher turnover. Who's the typical renter profile here, and what's been the actual vacancy rate?
- The area grade is low — what's the realistic commute time and amenity access for the typical tenant pool here? Any planned neighborhood developments (good or bad) we should know about?
- What's the average days-on-market for RENTAL listings here right now (not sales)? A rising rental-DOM trend means longer vacancies and softer asking-rent achievability than the comps imply.
- What's the recent tenant-quality profile in this submarket — average credit score on applications, eviction rate, late-payment / NSF rate, and stable-employment percentage? A property-management company in the area should have these aggregated.
- How much new for-sale + rental construction is in the pipeline within 1–3 miles? Heavy new supply typically softens prices + rents 12–24 months out; constrained supply supports both.
Investment metrics
- 1% rule
- 0.70% ✗
- Cap rate
- 4.62%
- Cash-on-cash
- -5.97%
- DSCR
- 0.73
- GRM
- 11.9
CMA / ARV
- ARV (median comp)
- $336,895
- List price
- $332,990
- Delta
- -1.16%
- Verdict
- FAIR
- Comps
- 20 within 1.0 mi
Show comp detail 12 sales within ~0.75 mi
| Address | Dist | Beds/Ba | Sqft | Sold | Price | $/sf | Match |
|---|---|---|---|---|---|---|---|
| 212 Harlingen Dr | 0.11mi | 5/3.0 | 2,542 (0%) | 5mo | $339,990 | $134 | 91 |
| 225 Harlingen Dr | 0.15mi | 4/3.5 (-1) | 2,407 (-5%) | 10mo | $329,990 | $137 | 69 |
| 217 Harlingen Dr | 0.13mi | 4/2.5 (-1) | 2,407 (-5%) | 11mo | $329,990 | $137 | 69 |
| 236 Harlingen Dr | 0.17mi | 5/3.5 | 2,200 (-14%) | 1mo | $329,990 | $150 | 67 |
| 209 Harlingen Dr | 0.11mi | 4/3.5 (-1) | 2,407 (-5%) | 16mo | $339,990 | $141 | 66 |
| 221 Harlingen Dr | 0.14mi | 4/3.5 (-1) | 2,743 (+8%) | 16mo | $364,990 | $133 | 60 |
| 25215 Brookstone Way | 0.41mi | 4/3.0 (-1) | 2,260 (-11%) | 1mo | $333,790 | $148 | 56 |
| 455 6th St | 0.57mi | 4/3.0 (-1) | 2,833 (+11%) | 1mo | $569,990 | $201 | 49 |
| 17733 Gold Saddle Ln | 0.63mi | 4/3.0 (-1) | 2,368 (-7%) | 8mo | $547,922 | $231 | 47 |
| 631 Running Iron Ln | 0.72mi | 4/3.5 (-1) | 2,676 (+5%) | 5mo | $514,900 | $192 | 47 |
| 525 Black Bronco Rd | 0.70mi | 4/3.0 (-1) | 2,368 (-7%) | 17mo | $551,121 | $233 | 37 |
| 719 Satterwhite Farms Ln | 0.71mi | 4/3.5 (-1) | 2,904 (+14%) | 13mo | $636,926 | $219 | 25 |
Match score weights: distance 35% · size 25% · config 20% · recency 20%. Top-matched comps best support the ARV.
Projected returns pro-forma
10.0% appreciation · 0.32% rent growth · sell at horizon
- IRR
- 19.3%
- Equity multiple
- 2.56×
- Total profit
- $147,461
- Equity at exit
- $303,502
- IRR
- 17.3%
- Equity multiple
- 5.73×
- Total profit
- $446,596
- Equity at exit
- $654,514
Cash invested: $94,331 (down + closing). Projections, not guarantees.
Landlord ↔ Tenant lean methodology
- Overall (STATE)
- 87 Strongly Landlord-Friendly
- State Texas
- 87 Strongly Landlord-Friendly · R+5
- County
- — inherits STATE
- City
- — inherits STATE
ZIP-level market 77354
- Home prices YoY
- 2.4%
- Rents YoY
- 0.3%
- Active inventory
- 1604
- Price-to-rent
- 11.8×
Monthly cashflow live
- Estimated rent
- $2,353 medium interval (Pro) →
- Mortgage (P&I)
- −$1,767
- Tax est. 1.5%
- −$421 /mo · $5,053/yr
- Insurance
- −$140
- HOA
- −$0
- Vacancy / Maint / Mgmt
- −$494
- Net cashflow
- $-469
Break-even live
UW: 25.0% down · 7.5% · 30yr · 1.5% tax · 5.0% vac · 8.0% maint · 8.0% mgmt
Financing live
Cash to close
- Down payment
- $84,224
- Closing costs
- $10,107
- Reserves months
- —
- Total cash needed
- —
Loan-product check · same deal, 3 products live
Conventional
25% down · 7.5% · 30yr
- Down + closing
- —
- Monthly P&I
- —
- Monthly cashflow
- —
- DSCR
- —
- Eligible?
- —
Personal DTI + credit; lowest rate.
DSCR
20% down · 8.5% · 30yr
- Down + closing
- —
- Monthly P&I
- —
- Monthly cashflow
- —
- DSCR
- —
- Eligible?
- —
No personal income docs; deal must DSCR.
Hard money
10% down · 12.0% · 12mo
- Down + closing
- —
- Monthly P&I
- —
- Monthly cashflow
- —
- DSCR
- —
- Eligible?
- —
Short-term bridge; refi at stabilization.
Rent comps 1 comps
| Address | Beds | Baths | Sqft | Rent | $/sqft | DOM | Units | Dist |
|---|---|---|---|---|---|---|---|---|
| 139 Piney Pathway Magnolia, TX | 4.0 | 2.0 | 2332 | $1,971 | $0.85 | 24d | 1 | 1.27mi |
Listing history 14 events
-
2026-06-18days on market $332,990 Active 76 DOM
-
2026-06-17days on market $332,990 Active 75 DOM
-
2026-06-16days on market $332,990 Active 74 DOM
-
2026-06-15days on market $332,990 Active 73 DOM
-
2026-06-13days on market $332,990 Active 71 DOM
-
2026-06-09days on market $332,990 Active 67 DOM
-
2026-06-08days on market $332,990 Active 66 DOM
-
2026-06-07days on market $332,990 Active 65 DOM
-
2026-06-04days on market $332,990 Active 62 DOM
-
2026-06-03days on market $332,990 Active 61 DOM
-
2026-06-02days on market $332,990 Active 60 DOM
-
2026-06-01days on market $332,990 Active 59 DOM
-
2026-05-31days on market $332,990 Active 58 DOM
-
2026-04-03$332,990 Active 720-char remark
Show marketing remark (720 chars)
Welcome to The San Marcos, a two-story home perfect for any family! On the main floor, you can enjoy an open concept family and kitchen area that includes a spacious pantry. The primary suite is on the main floor along with a guest room and bathroom. Upstairs, there are three additional bedrooms as well as another bathroom and large loft space. Each bedroom has great storage space with large walk-in closets. Make it your own with The San Marcos' flexible floor plan. From additional garage space to a covered patio, you've got every opportunity to make The San Marcos your dream home. Just know that offerings vary by location, so please discuss our standard features and upgrade options with your community's agent.
ⓘ Source: listings_history table (triggers on properties + properties_extension) + one-shot
backfill from property_details.listing_events for pre-trigger history.
Climate risk First Street
- Flood 1/10 Low FEMA zone X (unshaded) · 0% chance over 30 yrs
- Wildfire 5/10 Major
- Heat 8/10 Severe 7 d/yr ≥111°F today · 24 d/yr by 30 yrs out
- Wind 8/10 Severe 99% chance of damaging wind over 30 yrs
- Air quality 2/10 Low 1 unhealthy d/yr today · 1 by 30 yrs out
Nearby sold comps map
Loading sold comps map…
Walkable amenities ~0.75 mi
Loading nearby amenities…
Taxation est. · year 1
- Rental income
- $28,240
- − Mortgage interest
- −$18,871
- − Property taxes
- −$5,053
- − Insurance
- −$1,684
- − Repairs & maintenance
- −$2,259
- − Management
- −$2,259
- − Depreciation
- −$9,801
- Taxable loss
- −$11,688
- Est. tax savings @ 24.0%
- +$2,805
- After-tax cash flow
- $-2,824/yr
For passive investors: Depreciation is non-cash, so a rental often shows a tax loss while cash-flowing — sheltering income. Rental losses are passive: they offset passive income freely, and up to $25,000/yr can offset ordinary (W-2) income if you actively participate and your MAGI is under $100k (phasing out to $0 by $150k); unused losses carry forward. On sale, claimed depreciation is recaptured at up to 25%, and gains may owe capital-gains tax (a 1031 exchange can defer both). Figures are a year-1 estimate at your 24.0% rate — not tax advice; consult a CPA.
Condition & rehab AI · 1 photo
This two-story home in Magnolia, TX is in excellent condition with a good condition score of 80. It is move-in ready with a cosmetic rehab level, and minor updates such as painting and landscaping would significantly enhance its resale and rental value.
Value-add opportunities
- Both Painting exterior and interior — Enhances curb appeal and interior aesthetics
- Both Landscaping improvements — Enhances curb appeal and adds value
- Both New flooring in high-traffic areas — Improves appearance and reduces maintenance
- Resale New kitchen appliances — Modernizes the kitchen and appeals to potential buyers
- Resale New bathroom fixtures — Modernizes bathrooms and appeals to potential buyers
Renovation cost estimate screening
Value-add ROI direction
- Both Painting exterior and interior — Enhances curb appeal and interior aesthetics ↑
- Both Landscaping improvements — Enhances curb appeal and adds value ↑
- Both New flooring in high-traffic areas — Improves appearance and reduces maintenance ↑
- Resale New kitchen appliances — Modernizes the kitchen and appeals to potential buyers ↑
- Resale New bathroom fixtures — Modernizes bathrooms and appeals to potential buyers ↑
ⓘ Cost ranges are severity-bucket heuristics (US national rule-of-thumb). Get contractor quotes + a written scope before underwriting a rehab budget.
Schools (NCES district)
- District
- Magnolia ISD
- NCES district ID
- 4828740
- Math proficiency
- 42% ▼ -7.00%
- Reading proficiency
- 45% ▼ -4.00%
- Median HH income
- $71,692
- Composite
- 39.46/100
- National rank
- #3958
- State rank
- #247 of 826 in TX
Livability — Magnolia
- Score
- 73/100
- State rank
- #222
- US rank
- #5442
Category grades
Schools grade is shown separately in the Schools card above.
Census & demographics
- Census place
- Magnolia, TX
- County
- Montgomery County · 663,713 people
- City population
- 32,847
- Metro
- Houston-The Woodlands-Sugar Land, TX
- Population (ZIP)
- 44,900
- Household income
- $112,504
- Rent vs Own
- Severe rent burden
- 586.0
Population outlook (Montgomery County) Hauer SSP2
- Today (2025)
- 713,896 people
- By 2030
- 805,263 · +12.8%
- By 2040
- 992,708 · +39.1%
- By 2050
- 1,179,590 · +65.2%
- By 2075
- 1,628,084 · +128.1%
- By 2100
- 1,937,880 · +171.5%
Race, ethnicity, and origin ACS 2023
- Neighborhood character
- Predominantly White (66%)
- Race & ethnicity
- White 66% Hispanic / Latino 25% Two or more races 18% Black 3% Asian 1%
- Hispanic origin (detail)
- Mexican 14% Puerto Rican 1%
- Common ancestry
- Lithuanian 4% Slovak 2% Italian 2%
- Foreign-born
- 11% · Canada, Vietnam
- Languages at home
- 83% English-only · Spanish 15% Other Indo-European 1% German/W. Germanic 1%
Political lean MEDSL · Montgomery
- 2024 margin
- Solid R (+45.5) · D 26.8% · R 72.3%
- 2008→2024 swing
- +7.2pp toward D · 2008: -52.7pp · 2024: -45.5pp
- All cycles
- 2024: R+45.5 2020: R+43.8 2016: R+51.4 2012: R+60.7 2008: R+52.7
Not yet ingested
- Civics
- —
Market trends
- HPI YoY
- ▲ 12.09%
- Current HPI
- 512.87
- Rent YoY
- ▲ 0.32%
- Metro
- Houston-The Woodlands-Sugar Land, TX
- State GDP YoY
- ▲ 3.95%
- F500 in state
- 110
Industry mix (Fortune 500 HQ in TX)
| Industry | F500 HQs | Revenue |
|---|---|---|
| Energy | 16 | $1,198B |
|
||
| Technology | 5 | $198B |
|
||
| Engineering / Construction | 4 | $72B |
|
||
| Energy Services | 3 | $60B |
|
||
| Utilities | 3 | $41B |
|
||
| Healthcare | 2 | $330B |
|
||
Price history
1 event — show timeline
- 2026-04-03 Listed $332,990 Zillow
Cash-flow waterfall
monthlySold comps — $/sqft
last 12 mo · ≤1 miLoading sold comps…